Articles | Volume 382
https://doi.org/10.5194/piahs-382-677-2020
Pre-conference publication
 | 
22 Apr 2020
Pre-conference publication |  | 22 Apr 2020

Reconstruction of earth fissures 3-D from videos

Adrián Riquelme, Roberto Tomás, Miguel Cano, José Luis Pastor, Brian Gootee, and Joseph P. Cook
Abstract

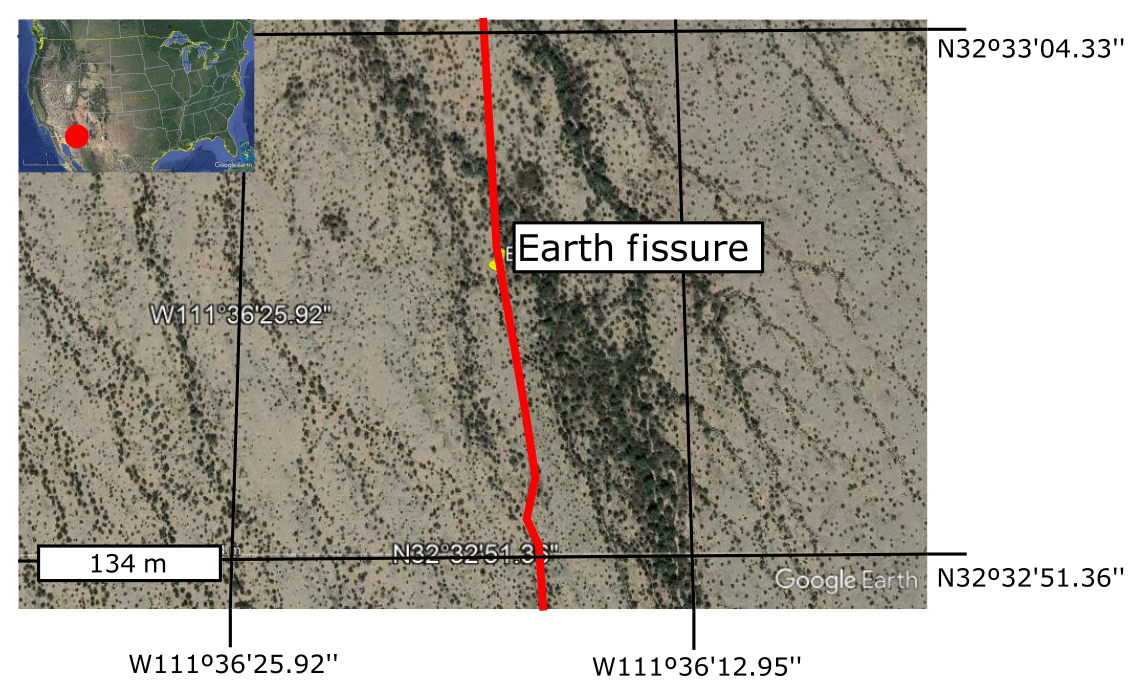
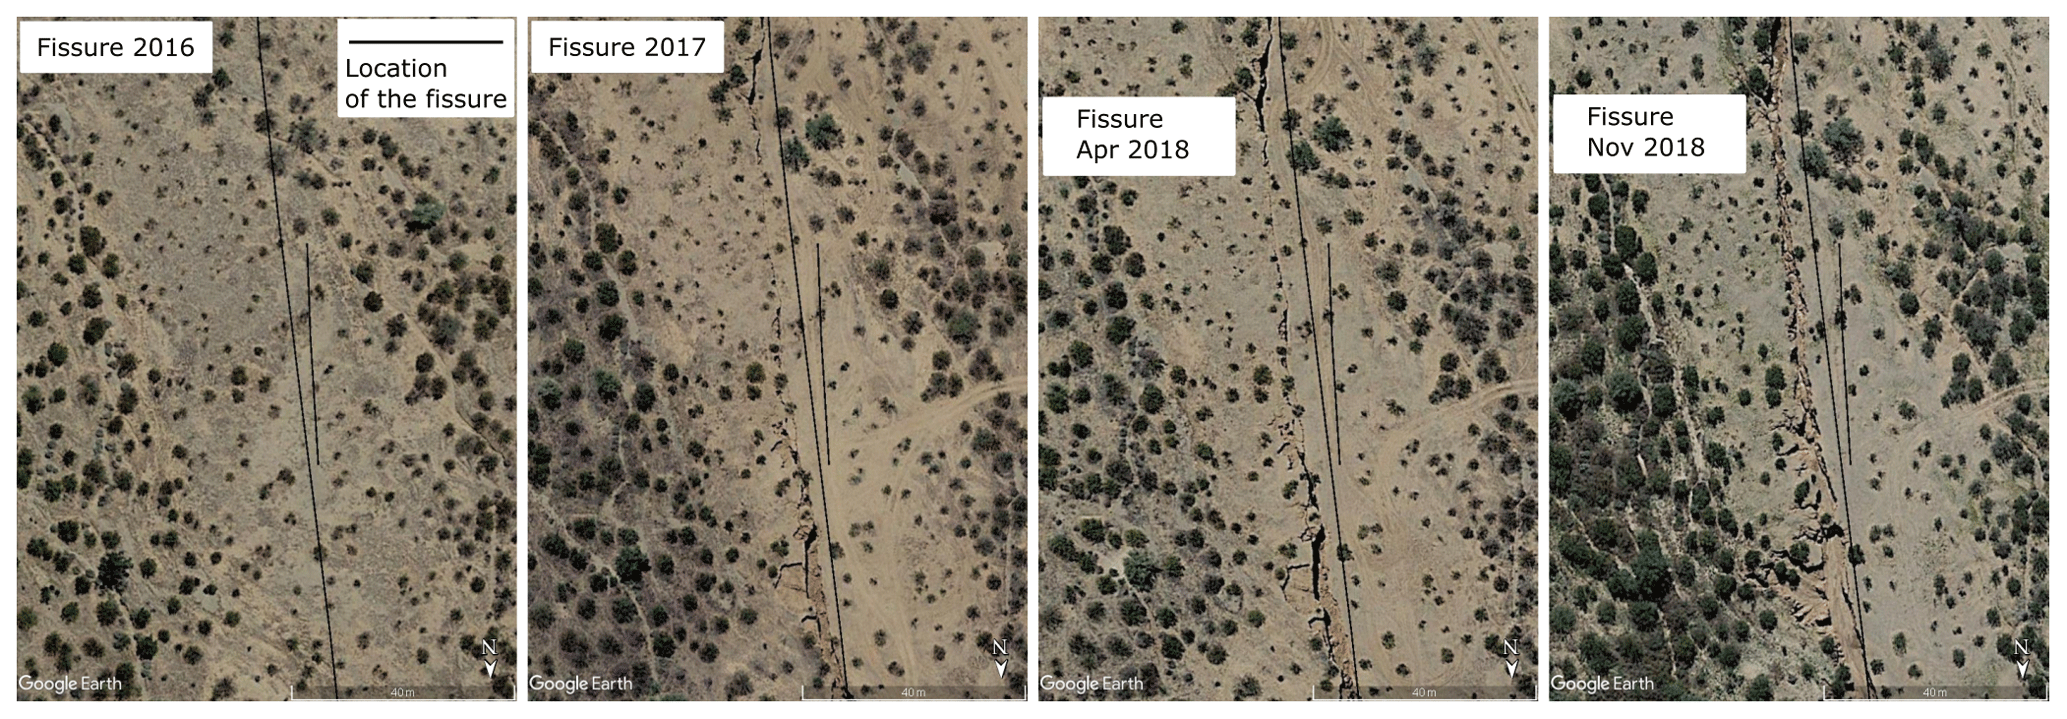
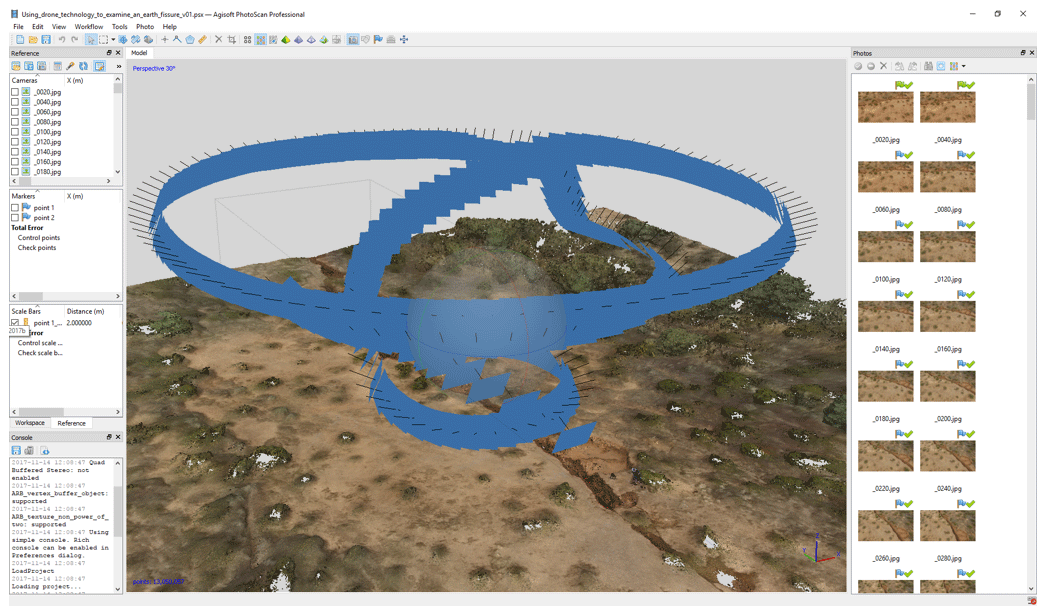
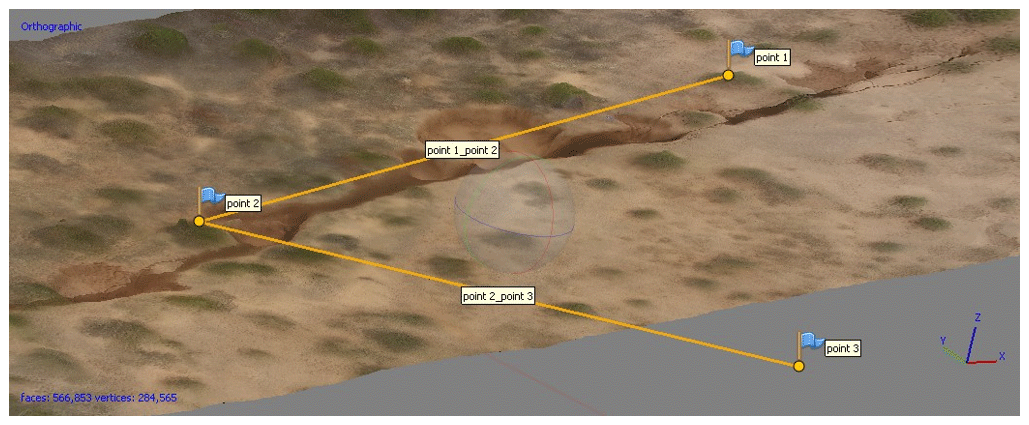
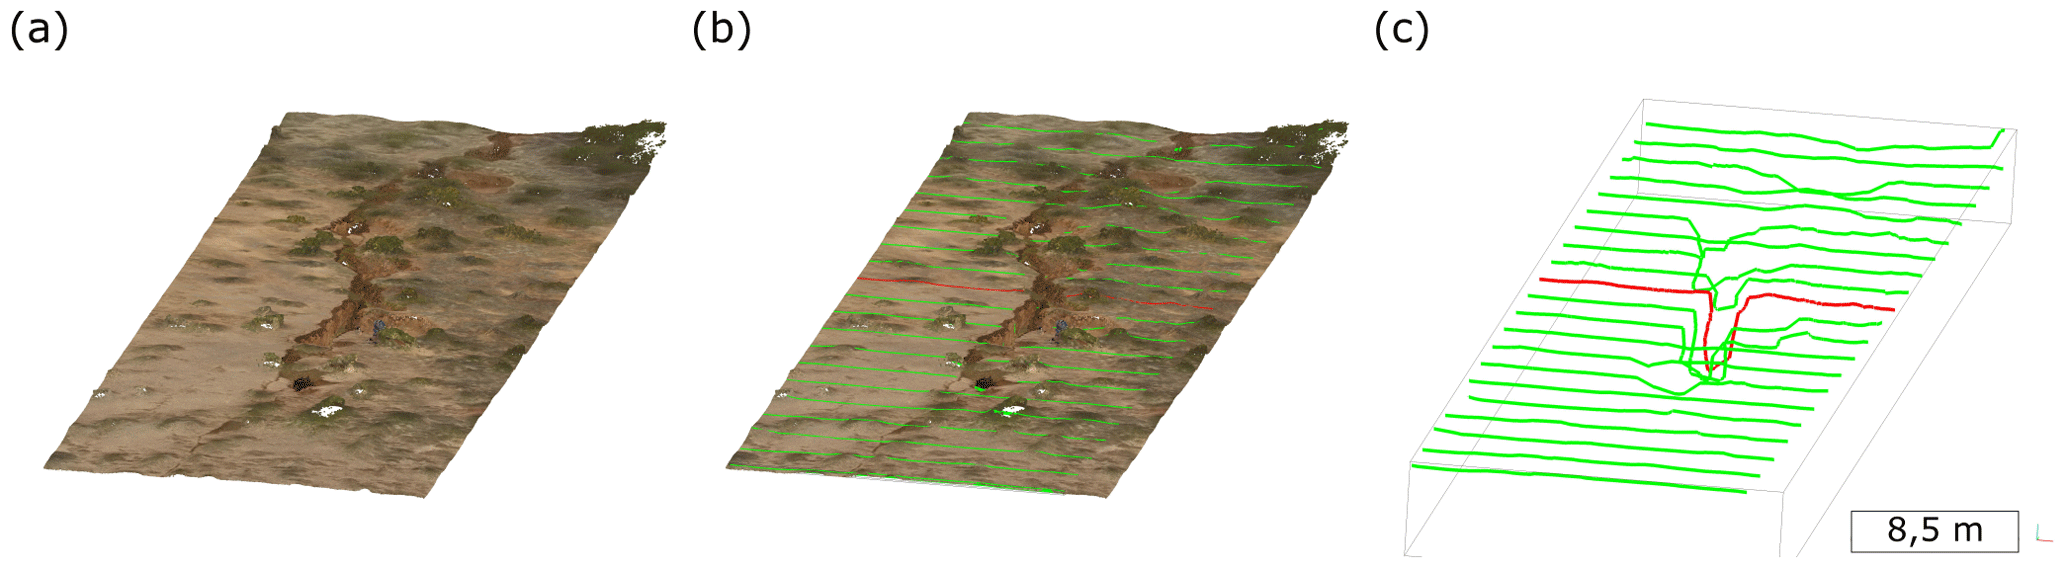
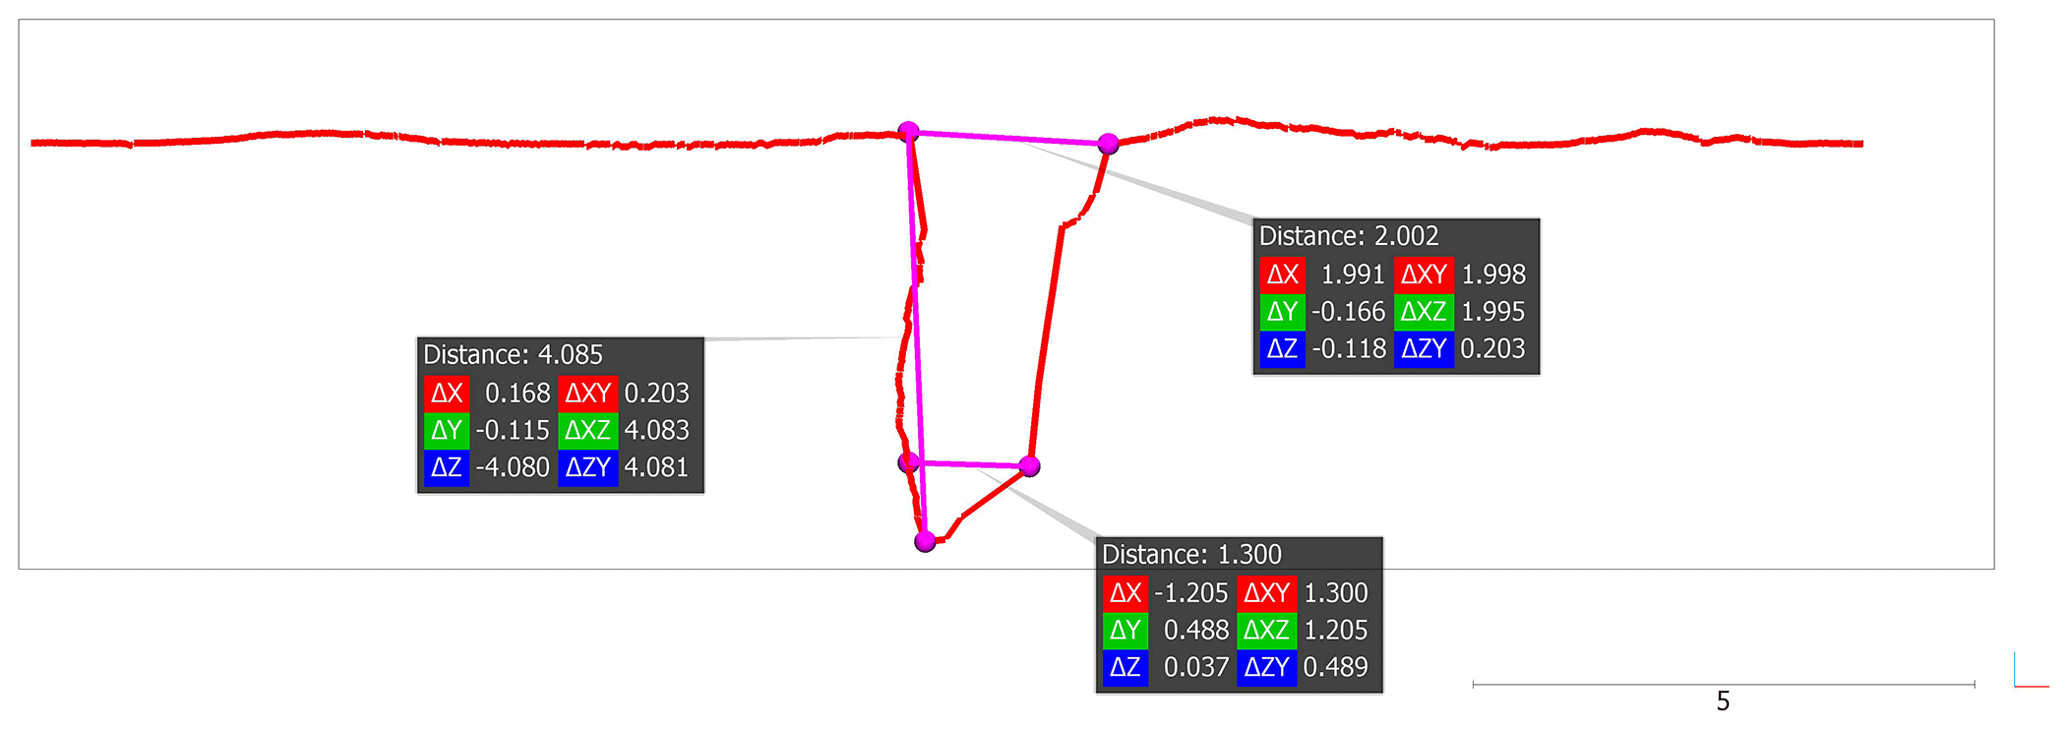
Earth fissures are pervasive cracks that develop on valley floors as a consequence of land subsidence associated with extensive groundwater withdrawal. To capture geometrical, geological and geotechnical information of ground fissures is of paramount importance for their characterization. Recent advances in remote sensing techniques and the accessibility to remotely piloted aircraft systems (RPAS) as well as the evolution of onboard digital cameras enable the capture of digital photos and videos. Using digital photos along with the Structure from Motion (SfM) technique and following certain strategies, we can reconstruct a 3-D model of the earth fissures under study. This technique requires digital photos, but when a digital video is available, we can convert it into a set of frames and equally apply the procedure. Besides, the extraction of frames from a video assures a key condition for the SfM technique: the overlap between photos. The resulting 3-D model should be scaled and oriented using a rigid transformation matrix or even better including ground control points (GCP) into the captured photos or frames. The latter enables the geo-referencing of the point cloud and the correction of linear and non-linear deformations. In this work, the proposed methodology is illustrated through the application of SfM technique to a high-resolution video downloaded from YouTube (i.e. https://youtu.be/9xdAnftBKvY, last access: 20 February 2020). The video shows a mile-long earth fissure that appeared sometime between March 2014 and December 2014 near the Tator Hills (Arizona, USA) over Quaternary sediments. The Arizona Geological Survey captured these videos using an RPAS. The frames of the video were downloaded and extracted using a simple Matlab code. Then, we sub-sampled the frames and processed them using the software Agisoft Metashape Professional. Finally, we got metric data from Google Earth and generated a 3-D model. The quality of the 3-D model strongly depends on the quality of the photos and the GCP. However, this study shows the potential of this technique, instrumentation and data available on Internet for the development of 3-D point clouds and 3-D models for the detailed analysis of earth fissures.

1 Introduction

When Earth processes apply tensions to the soil surface, earth fissures may appear as tension cracks that open the terrain. On valley floors, this phenomenon usually occurs because of an extensive water withdrawal that leads to the land subsidence. This phenomenon is common in Arizona (Slaff, 1993), and is highly interesting for the scientific community and planners, since they play a key role in the development of urban areas, industrial settlements, agricultural and other economic activities.

https://www.proc-iahs.net/382/677/2020/piahs-382-677-2020-f01

Figure 1Location of the fissure. Source: © Google Earth.

https://www.proc-iahs.net/382/677/2020/piahs-382-677-2020-f02

Figure 2Evolution of the earth fissure since 2016 to 2018. Source: © Google Earth.

The earth fissures characterisation partially comprises field inventory. The operators usually map the fissure geometry (e.g. width, depth, morphology and vertical displacements) and collect soil samples. However, the new available techniques enable the remote acquisition of new data which is of high interest to the scientists.

https://www.proc-iahs.net/382/677/2020/piahs-382-677-2020-f03

Figure 3Snapshot of the Agisoft Photoscan software after processing the data.

https://www.proc-iahs.net/382/677/2020/piahs-382-677-2020-f04

Figure 4Snapshot of the Agisoft Photoscan software illustrating the insertion of three GCP and their distances.

Light Detection and Ranging (LiDAR) instruments are precise tools for the scanning of millions of points in a few minutes. However, the ground-based sensors may not be capable of capturing the inner part of the earth fissure because it may not be accessible. Nevertheless, the development of remotely piloted aircraft systems (RPAS), the weight reduction of the instruments and the development of automatic registration processes (Engel et al., 2018) enable the scanning of earth fissures. Nevertheless, the cost of this instruments may still be a barrier to its access to part of the scientific community.

https://www.proc-iahs.net/382/677/2020/piahs-382-677-2020-f05

Figure 5(a) view of the 3-D point cloud, coloured with the photos; (b) transects every 5 m overlayed on the 3-D point cloud; (c) transects isolated. Source: CloudCompare.

https://www.proc-iahs.net/382/677/2020/piahs-382-677-2020-f06

Figure 6Example of a transect and the extraction of distances using the software CloudCompare.

However, the recent advances in remote sensing techniques, the accessibility to RPAS and the evolution of onboard digital cameras enable the capture of digital photos and videos. Using digital photos along with the Structure from Motion (SfM) technique and following certain strategies, it is possible to reconstruct 3-D models of earth fissures.

In this contribution, we applied the SfM technique to reconstruct the geometry of a recent earth fissure near the Tator Hills in Arizona (USA; Cook, 2017a) (Fig. 1). The study are lies in the Picacho Basin which is almost 3000 m deep in places (Richard et al., 2007). The fissures have formed in areas with more shallow bedrock (∼300 m or less) and there are bedrock inselbergs (Tator Hills) about 3.5 km to the west (Richard et al., 2007). The near-surface sediment is predominantly Quaternary fine-grained sands, silts, with some gravel interbeds (Arizona Bureau of Mines and University of Arizona, 1959). Overall the area is not well incised and sheetflow is common following heavy rains. Since the fissure has formed many drainages have been captured and have contributed to erosion and infilling along the fissure. The fissures formed closely aligned to measured subsidence patterns measured by InSAR (Arizona Department of Water Resources, 2019). It is likely many fissures in AZ formed in response to land subsidence linked with pumping from decades prior.

The fissure was divided into two equal lengths tracks. The northern track firstly appeared on Google Earth in December 2014, and the southern track in 2016. The southern track had sharp vertical walls and a v-shaped geometry of 9 m depth. Since this fissure was discovered it has been growing as it is shown in Fig. 2. In January 2019 it was inspected again showing a rapid degradation of the sidewalls and in filling in the fissure. The deposits reduced the depth to 3 m forming a broad, flat-bottomed channel of sand and sediments captured from drainages (Fergason, 2019).

In addition to the aforementioned studies, the authors generated a 3-D model using the photos captured during the flight (Gootee, 2016). Besides, the video recorded using a RPAS that shows a mile-long earth fissure was uploaded to YouTube (Arizona Geological Survey, 2017b). This video was downloaded from YouTube and using several metric information obtained from Google Earth a 3-D model was generated enabling the study of the geometry of the fissure without accessing inside it.

2 Materials and methods

The SfM technique uses digital photos to reconstruct the 3-D geometry of a surface. However, when a digital video is available their frames can be extracted, and the same procedure can be performed. Besides, the extraction of frames from a video assures a key condition for the SfM technique: the overlap between photos.

Firstly, two videos recorded using a RPAS of the fissure was downloaded from Youtube (Arizona Geological Survey, 2017b, a). From this file a Matlab code was used to extract 204 and 173 frames respectively, which size was 3840×2160 px. The first video captures the fissure from its top, while the second video captures the inner part of the fissure. Figure 3 shows a screenshot of the Photoscan software. Blue rectangles are the location and orientation of the extracted frames and describe the fly path of the RPAS. The right panel of this figure shows the loaded frames.

3 Results and discussion

The alignment process estimated the location and orientation of each camera. Figure 3 presents the RPAS flight, where each blue rectangle is a photo. To scale the model, three points were identified in the photos and in the Google Earth software (Fig. 4). The distance between each pair of objects was measured in Google Earth. After placing the points in the photos, the distances were inserted. This process enabled scaling the model. The errors of the distances after optimizing the cameras were 10 and 13 mm, respectively, and the overall error was 12 mm.

A 3-D point cloud and a textured mesh were generated. Figure 5a presents an orthographic view of the point cloud. As the distance of the GCPs was introduced in the process, the scale is 1:1 and measurements can be directly extracted. Every 5 m a transect was extracted from the point cloud (Fig. 5b) using the software CloudCompare (Girardeau-Montaut, 2019). Extraction of distances is possible, as shown in Fig. 6. These transects aid to understand the geometry of the fissure even from its inside.

The result of this process presents the geometry of an earth v-shaped 2 m wide and 4 m depth fissure with solely using a video downloaded from YouTube and measurements extracted from Google Earth. This process is fair enough to reconstruct the shape and size of the fissure. Distances, transects of the inside of the fissure, volumes and other features can be obtained using open-source tools.

Further analysis may be of interest to the scientists, such as the evolution of the fissure along time. The procedure presented in this contribution could be of interest if the position of fixed elements (i.e. the coordinates of a point), that act as a reference, is available when capturing the photos.

If the references are captured at every stage and their coordinates are inserted into the SfM workflow, the resulting 3-D point clouds will be automatically registered. Comparison of the models is possible by applying available methods, such as M3C2 distances computation (Cook, 2017b; Midgley and Tonkin, 2017). Therefore, the evolution of the earth fissure can be quantified not only from the outside but also from the inside when the RPAS has accessed in it (e.g. walls earth falls, erosion processes, earth fissure opening, etc.) can be quantified.

4 Conclusions

The use of SfM technique to the study of earth fissures offers a cost-effective technique to other more expensive instruments, such as LiDAR. This technique allows the inspection of the inner part of earth fissures and to reconstruct their geometry with high accuracy. Additionally, the derived 3-D point clouds at different moments can be compared in order to quantified geomorphological changes of the earth fissure. Therefore, this methodology is a complementary tool for the study of earth fissure that provides a valuable information for its geomorphological characterization.

Data availability

The video used in this work is available in next link: https://www.youtube.com/watch?v=9xdAnftBKvY&feature=youtu.be (last access: 20 February 2020; Arizona Geological Survey, 2017b). The frames extracted from the video and the generated 3D point cloud are available upon request by contacting the correspondence author.

Author contributions

BG and PC performed the images acquisition by UAV. AR and RT designed the experiment. AR processed the images and built the 3D point clouds. AR, RT, JLP and MC analysed the results. AR and RT wrote the manuscript. All revised the manuscript.

Competing interests

The authors declare that they have no conflict of interest.

Special issue statement

This article is part of the special issue “TISOLS: the Tenth International Symposium On Land Subsidence – living with subsidence”. It is a result of the Tenth International Symposium on Land Subsidence, Delft, the Netherlands, 17–21 May 2021.

Financial support

This research has been supported by the Spanish Ministry of Economy and Competitiveness (MINECO) and the European Funds for Regional Development (FEDER) (grant no. TEC2017-85244-C2-1-P), the UNESCO (grant no. ICGP641 project), the Universidad de Alicante (grant no. GRE17-11), the Universidad de Alicante (grant no. GRE18-15), and the Universidad de Alicante (grant no. vigrob-157).

References

Arizona Bureau of Mines and University of Arizona: Geological Map of Pinal County, Arizona, Tucson, Arizona, available at: http://repository.azgs.az.gov/uri_gin/azgs/dlio/1626 (last access: 20 February 2020), 1959. 

Arizona Department of Water Resources: Land Subsidence in Arizona, available at: https://new.azwater.gov/hydrology/field-services/land-subsidence-arizona, last access: 26 November 2019. 

Arizona Geological Survey: Drone video of a fresh earth fissure in Tator Hills, Pinal County, Arizona – YouTube, Youtube, available at: https://www.youtube.com/watch?v=Rbd1sWPTxyk (last access: 19 August 2019), 2017a. 

Arizona Geological Survey: Using Drone Technology to Examine an Earth Fissure – YouTube, YouTube, available at: https://www.youtube.com/watch?v=9xdAnftBKvY (last access: 19 August 2019), 2017b. 

Cook, J. P.: Discovery of a large earth fissure in the southern Picacho Basin, Pinal County, Arizona, available at: http://repository.azgs.az.gov/uri_gin/azgs/dlio/1708 (last access: 20 February 2020), 2017a. 

Cook, K. L.: An evaluation of the effectiveness of low-cost UAVs and structure from motion for geomorphic change detection, Geomorphology, 278, 195–208, https://doi.org/10.1016/j.geomorph.2016.11.009, 2017b. 

Engel, J., Koltun, V., and Cremers, D.: Direct Sparse Odometry, IEEE Trans. Pattern Anal. Mach. Intell., 40, 611–625, https://doi.org/10.1109/TPAMI.2017.2658577, 2018. 

Fergason, K.: Rapid infilling of a fresh earth fissure in southern Pinal County, Arizona, Arizona Geol. e-Magazine, available at: https://blog.azgs.arizona.edu/blog/2019-01/rapid-infilling-fresh-earth-fissure-southern-pinal-county-arizona-w-comment-ken, last access: 20 November 2019. 

Girardeau-Montaut, D.: CloudCompare (version 2.10) [GPL software], OpenSource Proj., available at: http://www.cloudcompare.org/ (last access: 20 February 2020), 2019. 

Gootee, B. F.: Tator Hills earth fissure – 3-D model by bgootee (@bgootee) – Sketchfab, Sketchfab, available at: https://sketchfab.com/3d-models/tator-hills-earth-fissure-beb58ca902f9417b93ae74ce29fbe267 (last access: 19 August 2019), 2016. 

Midgley, N. G. and Tonkin, T. N.: Reconstruction of former glacier surface topography from archive oblique aerial images, Geomorphology, 282, 18–26, https://doi.org/10.1016/j.geomorph.2017.01.008, 2017. 

Richard, S. M., Shipman, T. C., Greene, L. C., and Harris, R. C.: Estimated depth to bedrock in Arizona: Arizona Geological Survey, Digit. Geol. Map DGM-52, layout scale, 1 (100 000), 2007. 

Slaff, S.: Land subsidence and earth fissures in Arizona, Arizona, available at: http://repository.azgs.az.gov/uri_gin/azgs/dlio/1713 (last access: 20 February 2020), 1993.