the Creative Commons Attribution 4.0 License.
the Creative Commons Attribution 4.0 License.
 | 22 Apr 2020
Coastal Lowlands' Inundation Risk Assessment with High-resolution TanDEM-X DEM in Qingdao Coastal Plains, China
Miao Li
Houjie Wang
Global warming plays a principal role on the continuous increasing sea-level rise, which exposes coastal regions worldwide to flooding threat. However, the challenge is that the regional impact of SLR flooding can be variable, especially when considering multiple effects of land subsidence, long-term general sea-level rise and extreme weather conditions like storm surge. In this paper, we build module with high-resolution InSAR-derived precision DEMs with resolution of 4 m, long-term SLR trend and episodic signals of climate change to calculate the relative sea level in AD 2100 on various scenarios over the Jiaozhou Bay, one typical region of the biggest peninsula in China and an important economic centre adjoining to the Yellow Sea. The potential of TanDEM-X DEM for coastal vulnerability mapping in the Qingdao coastal area were evaluated in order to investigate the effect of the accuracy and resolution of coastal topography on the reliability and usefulness of elevation-based sea-level rise assessments. The results reveal that coastal lowland areas over the JiaozhouBay are extremely vulnerable in the following years within 21st century with use of high-accuracy TanDEM-X DEM data, which would be an advantage for further elevation-based dynamic assessments of coastal inundation events considering storm surges, abnormal high tides, and extreme precipitation events. which would be vital for locally coastal protection and decision-making.
- Article
(4294 KB) - Full-text XML
- BibTeX
- EndNote


Global sea-level rise projections for 2100 between 530 and 970 mm (RCP8.5) and up to about 500–1400 mm, which will threaten many coastal cities, low-lying islands and coastal plains on a global scale, even in absence of land subsidence (Pachauri et al., 2014; Hinkel et al., 2015; Cazenave et al., 2014; Cazenave and Cozannet, 2014). The alteration and adaptability of coastal land-cover types to a range of sea-level-rise scenarios should be geospatially resolved.
Use of high-accuracy and high-resolution elevation data is an advantage for elevation-based assessments of coastal inundation events (e.g. storm surges, abnormal high tides, or extreme precipitation events). Researchers investigating global changes (e.g. sea level rise, coastline erosions, earthquake hazards, and land use change) have an increasing demand for high spatial resolution globally topographic data (Gesch, 1994).
As the first bistatic SAR Mission, TanDEM-X (TerraSAR-X add-on for Digital Elevation Measurements) Mission has been designed to generate three-dimensional images of the Earth with homogeneous quality and unprecedented accuracy (Zink et al., 2014). Since the quality of DEMs varies spatially in a regional level, TanDEM-X DEM should be assessed quantitatively and used carefully (Wessel et al., 2018; Rizzoli et al., 2017; Avtar et al., 2015). In this study, we focus on the evaluation of TanDEM-X DEMs and evaluate the potential of TanDEM-X DEM for coastal vulnerability mapping in the Qingdao coastal area, East China, in order to investigate the effect of the accuracy and resolution of coastal topography on the reliability and usefulness of elevation-based sea-level rise assessments.
Firstly, high-resolution TanDEM-X bistatic InSAR-derived DEMs with pixel spacing of 4 m in Jiaozhou Bay are collected and generated from Coregistered Single look Slant range Complex (CoSSC) data. After raw data mosaicing, filling, clipping, datum conversion and projection, eight-neighbor water connectivity algorithm are used to simulate flooding event and extract flooded area in the end of 21st century. The sea level is calculated through adding the storm surge and sea level rise to the present water level. Then, we discuss the influence on different administrative division and land cover over the Jiaozhou Bay.
The study area Qingdao is located in the southern part of Shandong Peninsula (119∘30′–121∘00′ E and 35∘35′–37∘09′ N) adjacent to the Yellow Sea in the east and south as depicted in Fig. 1. As an important coastal economic development area in Shandong Province and even China, the study of sea level change in Qingdao is of great significance. Qingdao is a coastal hilly city with an area of 11 293 km2, where the terrain is high in the east and low in the west, the north and south sides are raised and the middle is low concave. Among them, the mountain, hills, plains and depression respectively accounted for 15.5 %, 2.1 %, 37.7 % and 21.7 % of the city's total area. The entire Qingdao coastline is 730.6 km among which 162.2 km is protected by sea wall and only 31 % (50.7 km) is up to the standard of design storm surge prevention. The coastal economy vigorously develops around the bay and the shape of the bay-type city is formed. At present, five districts of Huangdao City, Jiaozhou City, Chengyang District, Licang District and Shibei District and Shinan District are located along the Jiaozhou Bay.
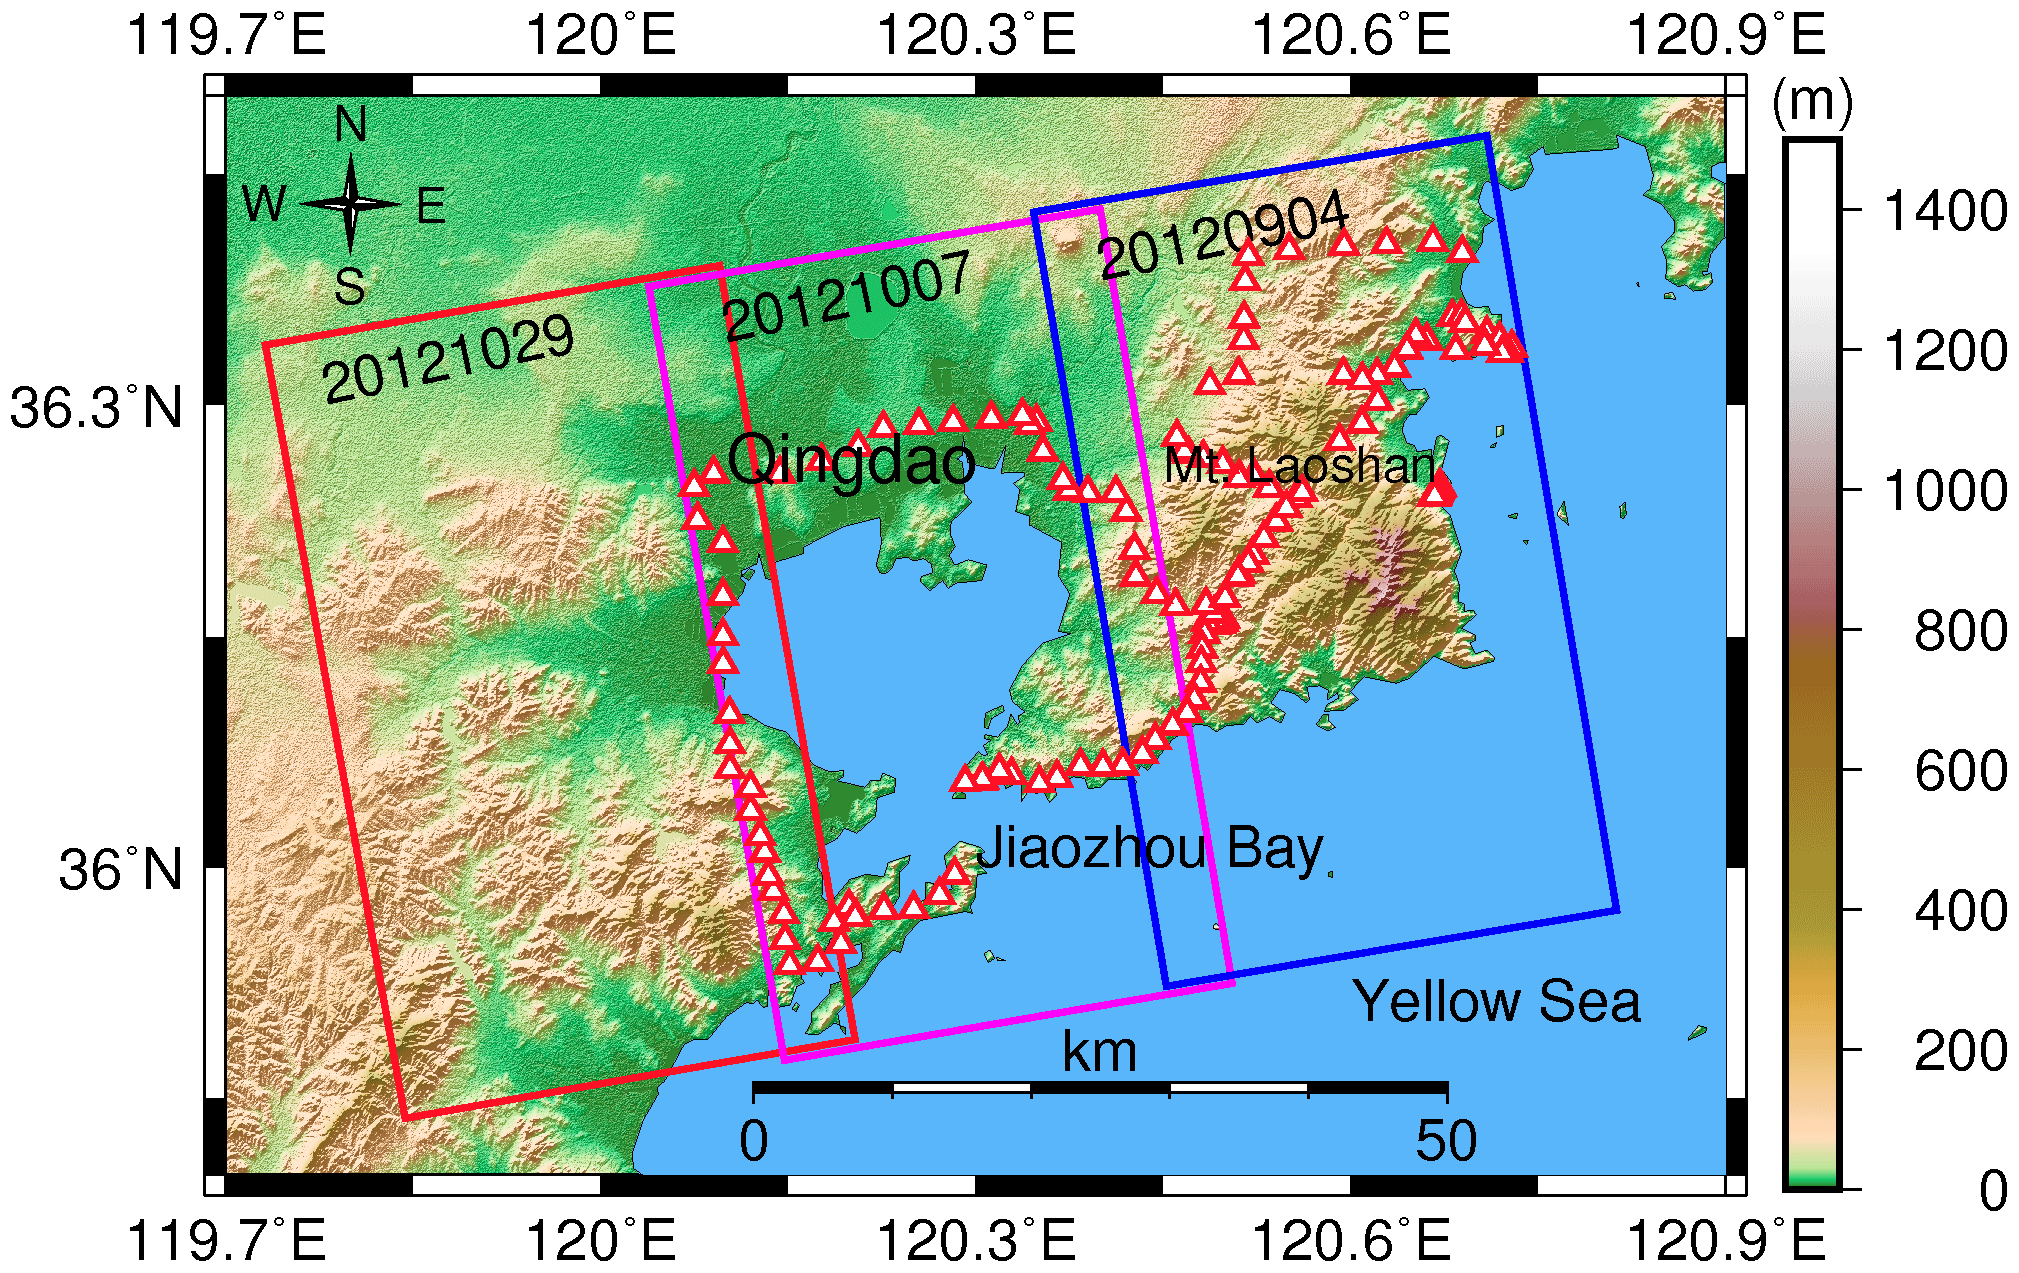
Figure 1Location of study site with the coverage of TanDEM-X DEM (three rectangles) and GPS observations (red triangles).
As a regular half-day tide port, there are two climaxes and two low tides on each lunar day (24 h and 48 min) in the Qingdao port. The average annual astronomic tidal range is about 2.8 m. The sea level in August is 0.5 m higher than that in January. The average tidal level observed by the Dagang tide station in Qingdao is regarded as the “average sea surface of the Yellow Sea”. In 1987, the average sea surface of the Yellow Sea measured by the Qingdao tide station from 1 January 1952 to 31 December 1979 was taken as starting face of the national elevation. It is also presumed that the national elevation of Qingdao Guanxiang Mountain of is 72.260 m. The elevation system established based on the elevation starting plane is called the 1985 National Elevation Reference.
As one of the northern area in China that is under the threaten of typhoon and extratropical cyclone, there exists storm surge of varying levels every year. According to China Sea Level Bulletin (2018), July to September is the seasonal high tidal level period for southern Shandong Province. When the tropical cyclones moving northward, it is likely to result in the disastrous high sea level during the superposition of seasonal high sea level, astronomical high sea level and storm surge. According to statistics from 1949 to 2013, typhoons affecting the coastal areas of Qingdao are gradually decreasing with the dividing line of the early 1980s. However, the trend of typhoon storm surge in Qingdao coastal area is increasing year by year. Since the 1980s, typhoon storm surge disasters in this area have occurred less than four years on average, whilst serious or particularly serious cases occur less than eight years on average and the frequency of disasters at the same level has increased significantly. During the transit of Typhoon No. 9216, the highest tidal level of storm surge measured at wharf 5 was 548 cm and the maximum water increase was 113 cm, which was a severe storm surge disaster.

3.1 Elevation datasets
3.1.1 AW3D30
The AW3D30 (ALOS World 3D-30m) data set is a global digital surface model (DSM) with horizontal resolution of approximately 30 m (1 arcsec) by the Panchromatic Remote-sensing Instrument for Stereo Mapping (PRISM) on board the Advanced Land Observing Satellite “ALOS” (Takaku and Tadono, 2017).
3.1.2 SRTMGL1
The Land Processes Distributed Active Archive Center (LP DAAC) released seamless 1 arcsec resolution DEMs as the NASA SRTM v3 collection (also known colloquially as SRTM Plus, hereafter named SRTM3) on 20 November 2013 (NASA, 2013).
3.1.3 TDX4
TanDEM-X (TerraSAR-X add-on for Digital Elevation Measurements) is an Earth observation radar mission that consists of a SAR interferometer built by two almost identical satellites flying in close formation (Zink et al., 2014). In this study, we generate 4 m TanDEM-X DEMs (TDX4) with reference to the WGS84 ellipsoid processed from four CoSSC (Coregistered Single look Slant range Complex) scenes in StripMap mode. Since the CoSSC data are already coregistered, the main steps for DEM generation are the following: interferogram generation, phase removal, phase unwrapping, absolute phase calibration and geocoding.
3.2 Datum conversion
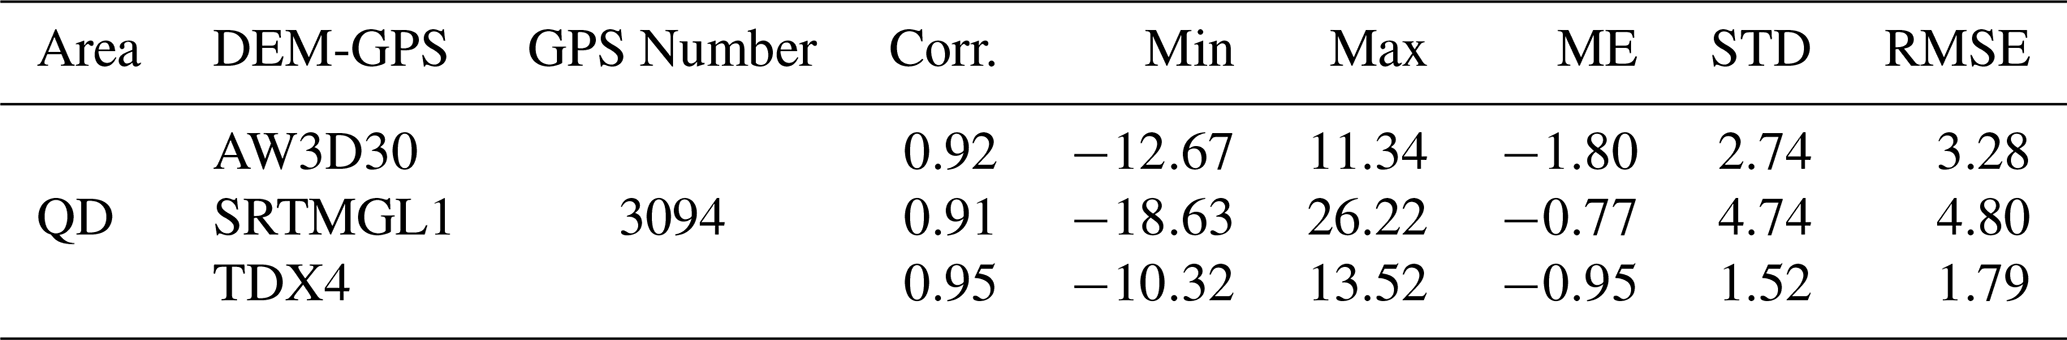
AW3D30, SRTMGL1 and TDX4 DEMs were used to delineate coastal areas of the Jiaozhou Bay as depicted in Table 1. In order to make a consistent comparison, all DEMs must refer to the same horizontal coordinate system and vertical datum (Li et al., 2016, 2013). We assessed the absolute vertical accuracy with a RMS difference of 1.7 m and mean error of −0.9 m by comparing with 3094 ground control points (GCPs) from high-accuracy GPS observation that is shown in Table 2.
3.3 Inundation model
A static linear addition by expansion method with Python Version 3.5 was employed as the future inundation model. The algorithm performs iterative cell-by-cell analysis of DEMs to select all cells with elevation values less than or equal to a particular value, and with locations adjacent or connected by cells of equal or lesser value to the sea (Ciro Aucelli et al., 2017). We note that surface subsidence published can be neglected in Qingdao area due to geological structure in Qingdao area covered with stable granite batholith.
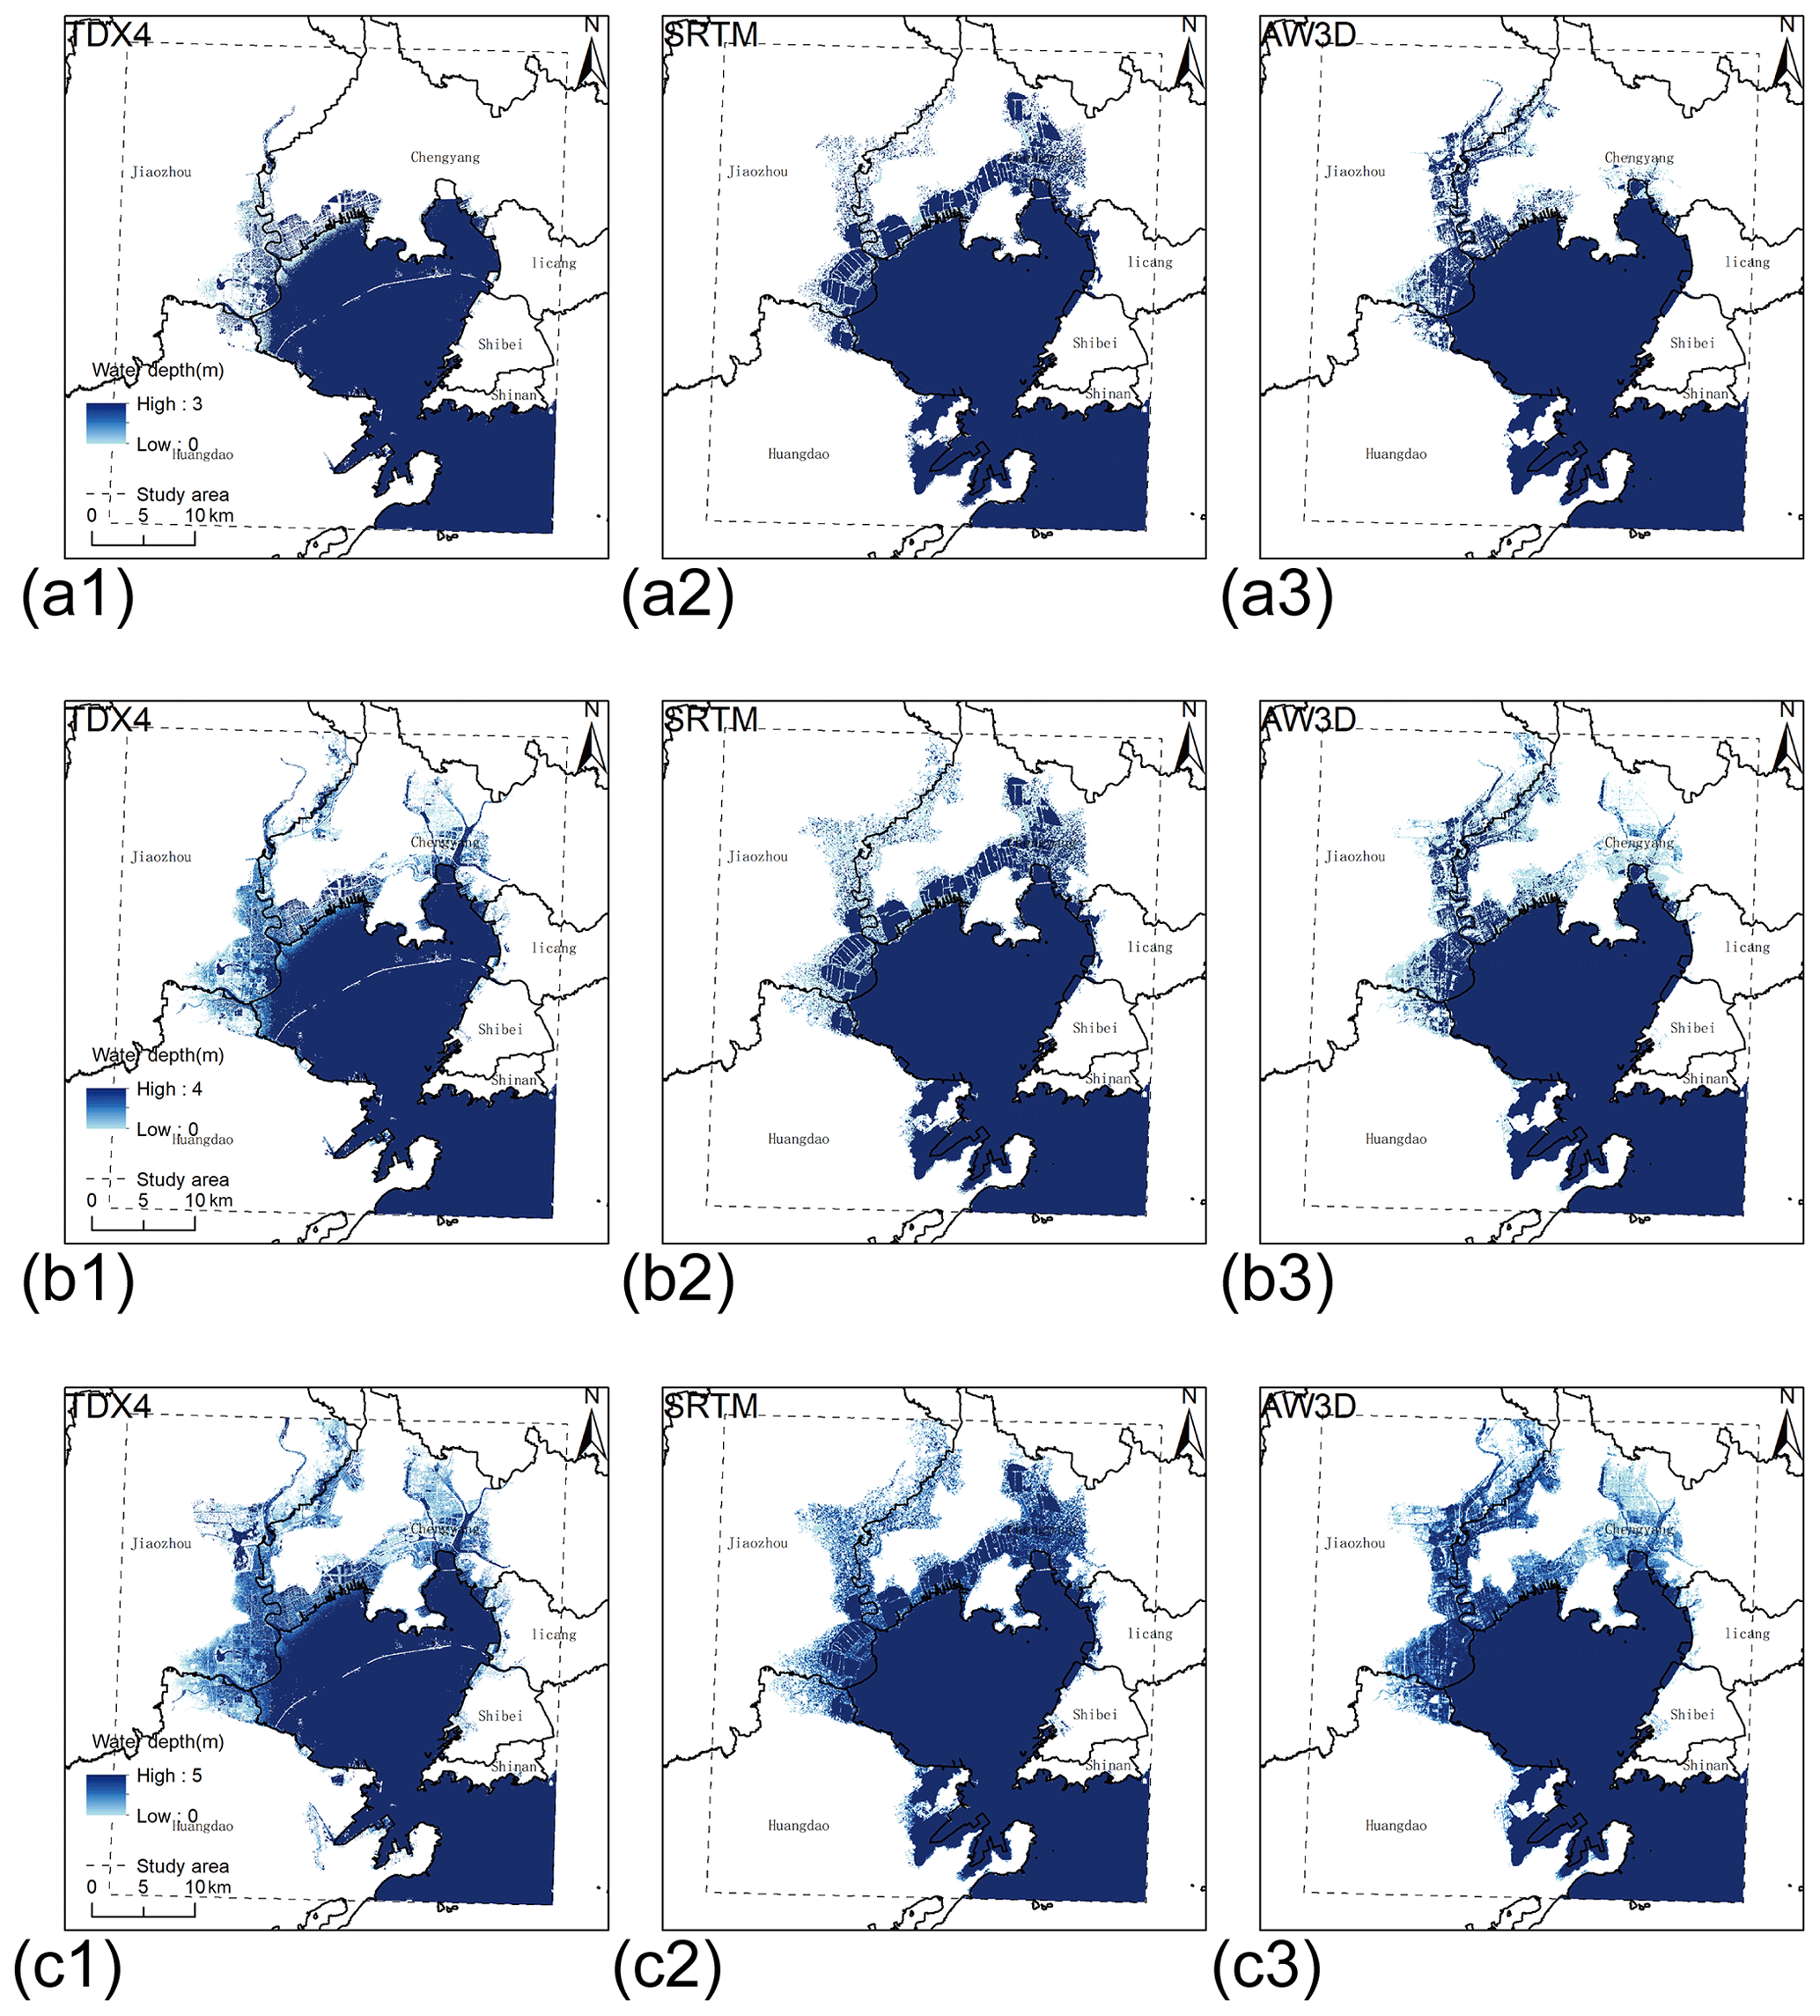
Figure 2Inundation map with scenario (a) 2.7 m, (b) 3.7 m, (c) 4.7 m a.m.s.l. and three different DEMs.
3.4 Sea level rise scenarios
According to previous study, there is a systematic error of 35 cm between EGM96 and the National Vertical Datum 1985 in the Dagang Tidal Gauge station, which was added in the formula of elevated sea level in the end of 21st century. Storm surge value of 326 cm was determined from the “Shandong Provincial Coastal Warning Tide Level Verification” issued in 2018, while the annual extreme water level sequence was firstly established from the Xiaomai Island gauge station and the 5th Wharf gauge station. Then according to the type I extreme value distribution. According to the Climate Change Risk Assessment-Developing Indicators of Climate Risk (Pachauri et al., 2014), the potential long-term flood height at the end of the 21st century caused by the worst sea level rise scenario was estimated to be about 109 cm. Therefore, an extreme projected sea level of 470 cm can be calculated from the above. We use an interval of 50 cm to represent other different scenarios in the end of 21st century.
3.5 Risk map generation
The mean sea level (m.s.l.) computed in Sect. 2.4 and DEMs were used as inputs to a python-based eight-connectivity algorithm. A random selected seed was selected in the Jiaozhou Bay and pointed the projected sea level value. Value of pixels lower than projected sea level with connections to the Jiaozhou Bay directly or indirectly would be flooded. Then outputs were transformed to raster overlapping with Shandong municipal boundaries from national geospatial information service platform MAPWORLD. The municipal boundary shapefiles that delineate the extent of legally defined boundaries of governmental units used in censuses and survey program are used to calculate the flooded area in each administrative division in GIS environment. The results are depicted in Figs. 2 and 3.
4.1 Comparison between different DEMs
The TDX4 DEM delineates a more detailed inundation map and smaller flooded areas compared with other DEMs in all scenarios. With elevated sea level of 2.7 m above the present m.s.l., it is obvious that a bridge cutting off the connectivity in the high resolution TDX4 leads to underestimates of the inundation area.
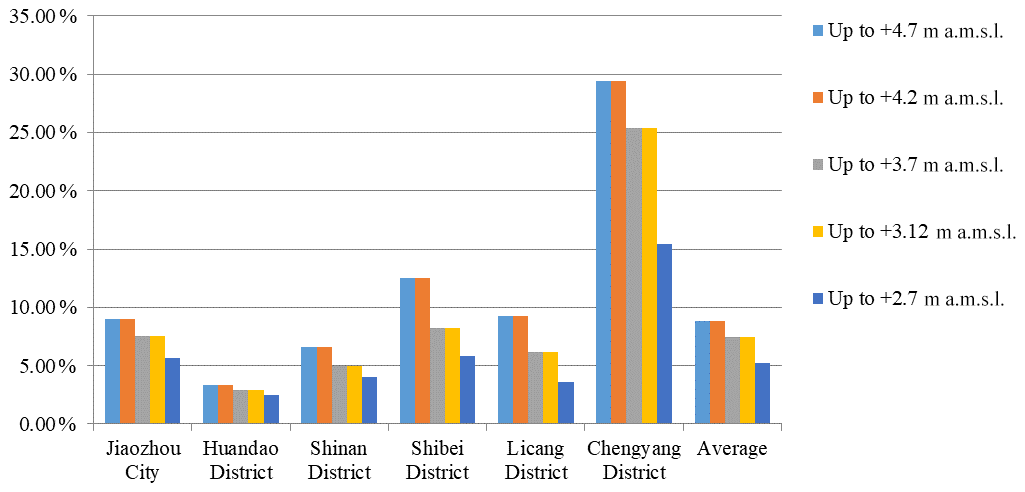
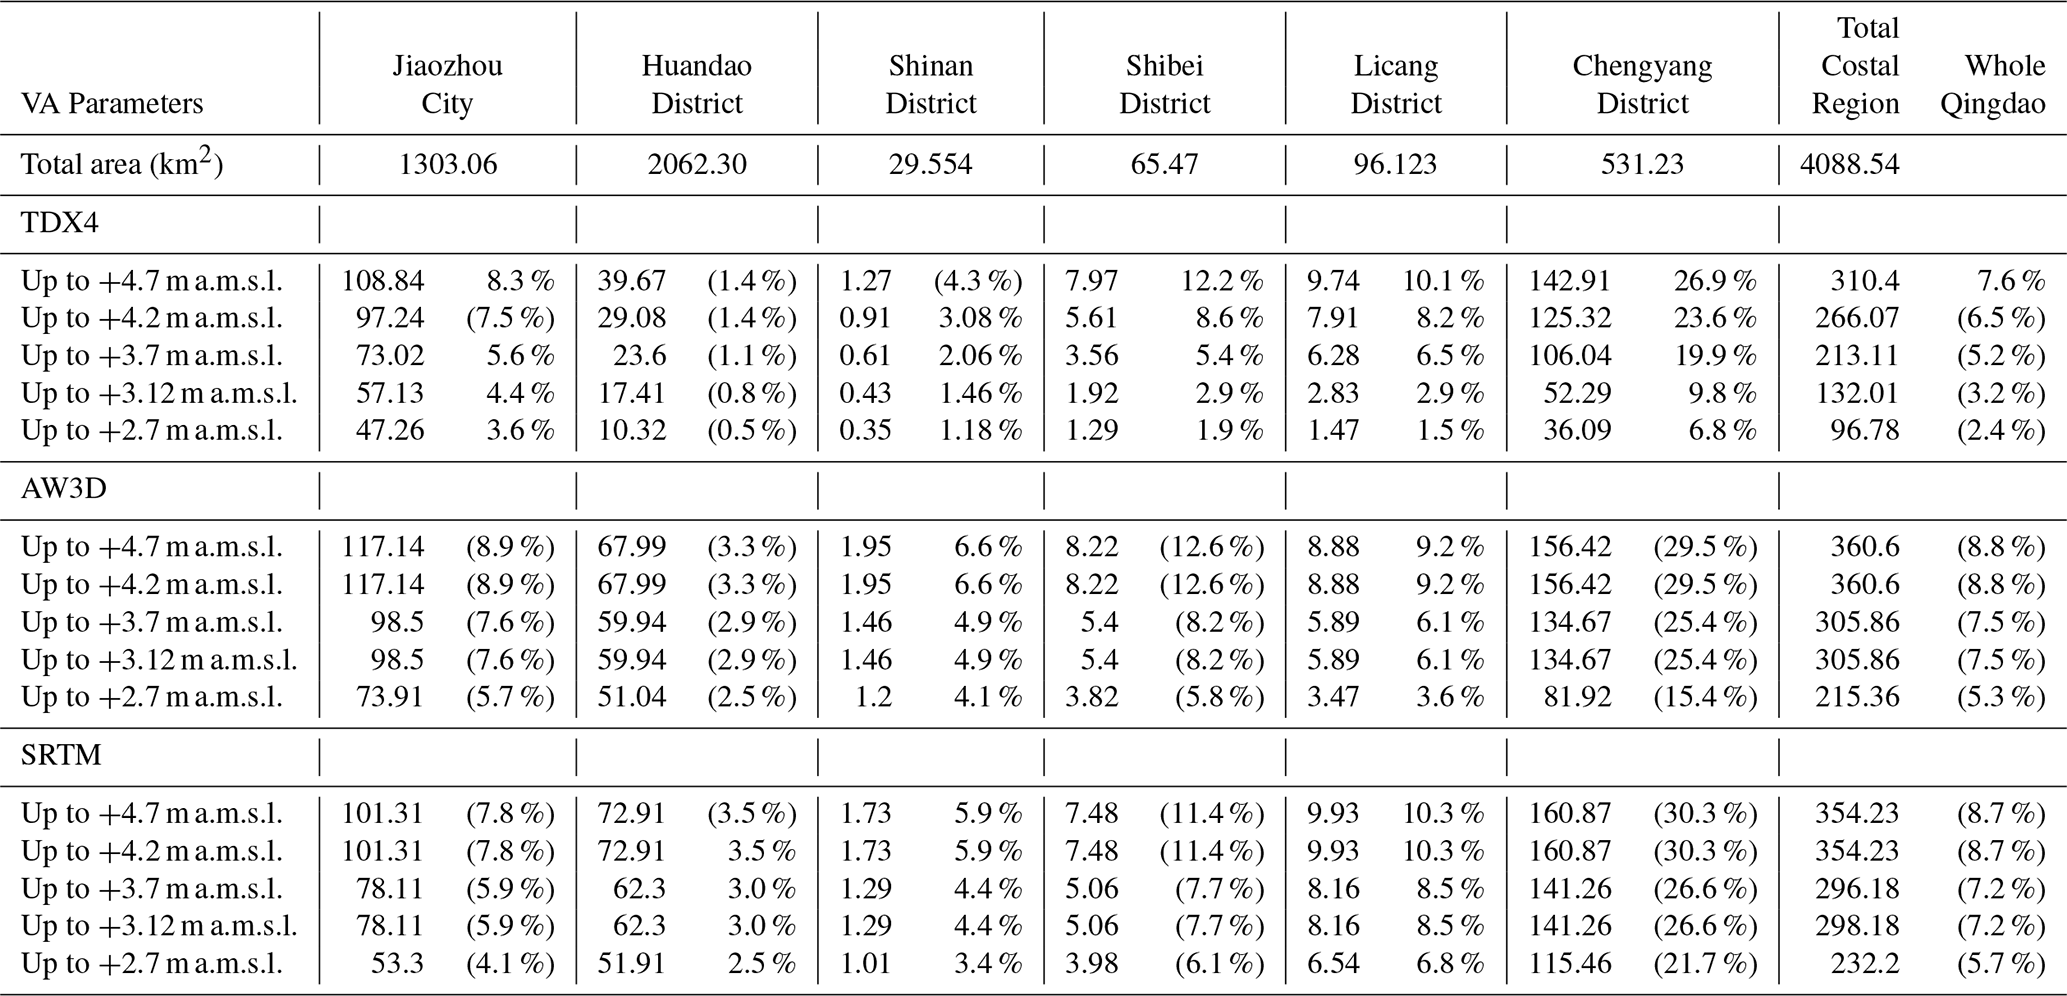
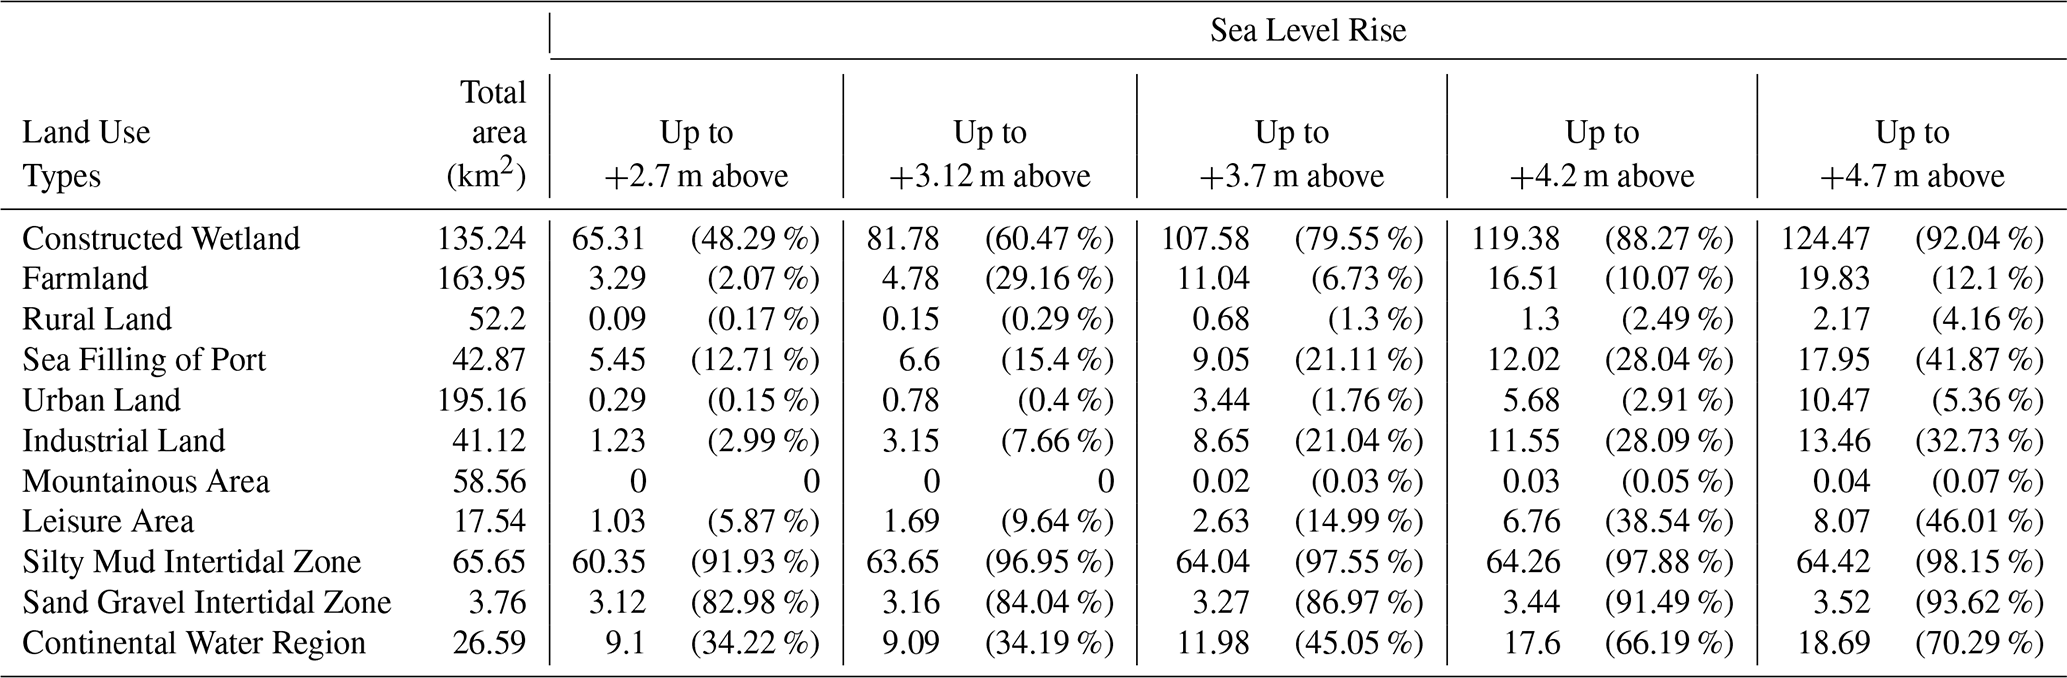
4.2 Comparison between different administrative divisions and landcover
The inundated percentage under different scenarios are presented in Fig. 3, Tables 3 and 4. The statistics clearly reveals that both Chengyang district and Jiaozhou city with majority of silty mud and sand gravel intertidal zone as well as constructed wetlands are extremely vulnerable owning to the flat banks along the Dagu River and the Moshui River, whilst Shinan and Shibei districts are less affected due to artificial ports and rocky coasts. However, tourism in all the above highly populated regions depend on the coastal beach. Therefore, the government should pay more attention to avoid severe economic loss.
The potential of TanDEM-X DEM for coastal vulnerability mapping in the Qingdao coastal area were evaluated in order to investigate the effect of the accuracy and resolution of coastal topography on the reliability and usefulness of elevation-based sea-level rise assessments. The results reveal that coastal lowland areas over the JiaozhouBay, Qingdao, are extremely vulnerable in the following years within 21st century with use of high-accuracy TanDEM-X DEM data, which would be an advantage for further elevation-based dynamic assessments of coastal inundation events considering storm surges, abnormal high tides, and extreme precipitation events.
The AW3D30 data are provided by Japan Aerospace Exploration Agency (JAXA) and accessed from Earth Observation Research Center (EORC). The SRTMGL1 data are provided by Land Processes Distributed Active Archive Center (LP DAAC) and available for download via Earthdata Search, the LP DAAC Data Pool and the Global Data Explorer (GDEx). The TanDEM-X CoSSC data are provided by German Aerospace Center (DLR) and accessed from EOWEB GeoPortal.
PL and ML mainly wrote the manuscript and were responsible for the research design, data preparation and analysis. ZL and HW proposed the research idea and assisted in methodology development and research design. All authors contributed to the discussion of the results.
The authors declare that they have no conflict of interest.
This article is part of the special issue “TISOLS: the Tenth International Symposium On Land Subsidence – living with subsidence”. It is a result of the Tenth International Symposium on Land Subsidence, Delft, the Netherlands, 17–21 May 2021.
The work was jointly supported by the Natural Science Foundation of China (No. 41806108), National Key Research and Development Program of China (No. 2017YFE0133500; No. 2016YFA0600903), Qingdao Indigenous Innovation Program (No. 16-5-1-25-jch). All the TanDEM-X SAR data were provided under DLR TanDEM-X AO Project (DEM_CALVAL1423) and TerraSAR-X AO Project (IDEM_CALVAL0059). Authors are grateful to JAXA and NASA for providing the free AW3D30 and SRTM DEM.
This research has been supported by the Natural Science Foundation of China (grant no. 41806108), National Key Research and Development Program of China (grant nos. 2017YFE0133500 and 2016YFA0600903) and Qingdao Indigenous Innovation Program (grant no. 16-5-1-25-jch).
Avtar, R., Yunus, A. P., Kraines, S., and Yamamuro, M.: Evaluation of DEM generation based on Interferometric SAR using TanDEM-X data in Tokyo, Phys. Chem. Earth, Parts A/B/C, 83–84, 166–177, https://doi.org/10.1016/j.pce.2015.07.007, 2015.
Cazenave, A. and Cozannet, G. L.: Sea Level Rise and Its Coastal Impacts, Earth's Future, 2, 15–34, https://doi.org/10.1002/2013EF000188, 2014.
Cazenave, A., Dieng, H.-B., Meyssignac, B., von Schuckmann, K., Decharme, B., and Berthier, E.: The rate of sea-level rise, Nat. Clim. Change, 4, 358–361, https://doi.org/10.1038/nclimate2159, 2014.
Ciro Aucelli, P. P., Di Paola, G., Incontri, P., Rizzo, A., Vilardo, G., Benassai, G., Buonocore, B., and Pappone, G.: Coastal Inundation Risk Assessment Due to Subsidence and Sea Level Rise in A Mediterranean Alluvial Plain (Volturno Coastal Plain – Southern Italy), Est. Coast. Shelf Sci., 198, 597–609, https://doi.org/10.1016/j.ecss.2016.06.017, 2017.
Gesch, D. B.: Topographic data requirements for EOS global change research, Open-File Report 94-626, U.S. Department of the Interior, U.S. Geological Survey, National Mapping Division, 26, 1994.
Hinkel, J., Jaeger, C., Nicholls, R. J., Lowe, J., Renn, O., and Peijun, S.: Sea-Level Rise Scenarios and Coastal Risk Management, Nature Clim. Change, 5, 188–190, https://doi.org/10.1038/nclimate2505, 2015.
Li, P., Shi, C., Li, Z., Muller, J.-P., Drummond, J., Li, X., Li, T., Li, Y., and Liu, J.: Evaluation of ASTER GDEM Using GPS Benchmarks and SRTM in China, Int. J. Remote Sens., 34, 1744–1771, https://doi.org/10.1080/01431161.2012.726752, 2013.
Li, P., Li, Z., Muller, J.-P., Shi, C., and Liu, J.: A New Quality Validation of Global Digital Elevation Models Freely Available in China, Survey Review, 48, 409–420, https://doi.org/10.1179/1752270615Y.0000000039, 2016.
NASA: SRTM Topography Update: Includes NASA Version 3.0 (SRTM Plus), available at: https://cmr.earthdata.nasa.gov/search/concepts/C1000000240-LPDAAC_ECS.html (last access: 20 January 2019), 2013.
Pachauri, R. K., Allen, M. R., Barros, V. R., Broome, J., Cramer, W., Christ, R., Church, J. A., Clarke, L., Dahe, Q., Dasgupta, P., Dubash, N. K., Edenhofer, O., Elgizouli, I., Field, C. B., Forster, P., Friedlingstein, P., Fuglestvedt, J., Gomez-Echeverri, L., Hallegatte, S., Hegerl, G., Howden, M., Jiang, K., Jimenez Cisneroz, B., Kattsov, V., Lee, H., Mach, K. J., Marotzke, J., Mastrandrea, M. D., Meyer, L., Minx, J., Mulugetta, Y., O'Brien, K., Oppenheimer, M., Pereira, J. J., Pichs-Madruga, R., Plattner, G.-K., Pörtner, H.-O., Power, S. B., Preston, B., Ravindranath, N. H., Reisinger, A., Riahi, K., Rusticucci, M., Scholes, R., Seyboth, K., Sokona, Y., Stavins, R., Stocker, T. F., Tschakert, P., van Vuuren, D., and van Ypserle, J.-P.: Climate Change 2014: Synthesis Report. Contribution of Working Groups I, II and III to the Fifth Assessment Report of the Intergovernmental Panel on Climate Change, edited by: Pachauri, R. K. and Meyer, L., IPCC, Geneva, Switzerland, 151 pp., 2014.
Rizzoli, P., Martone, M., Gonzalez, C., Wecklich, C., Borla Tridon, D., Bräutigam, B., Bachmann, M., Schulze, D., Fritz, T., Huber, M., Wessel, B., Krieger, G., Zink, M., and Moreira, A.: Generation and performance assessment of the global TanDEM-X digital elevation model, ISPRS J. Photogramm., 132, 119–139, https://doi.org/10.1016/j.isprsjprs.2017.08.008, 2017.
Takaku, J. and Tadono, T.: Quality updates of AW3D global DSM generated from ALOS PRISM, 2017 IEEE Int. Geosci. Remote Sens. Symposium (IGARSS), 5666–5669, 2017.
Wessel, B., Huber, M., Wohlfart, C., Marschalk, U., Kosmann, D., and Roth, A.: Accuracy Assessment of The Global TanDEM-X Digital Elevation Model with GPS Data, ISPRS J. Photogramm., 139, 171–182, https://doi.org/10.1016/j.isprsjprs.2018.02.017, 2018.
Zink, M., Bachmann, M., Brautigam, B., Fritz, T., Hajnsek, I., Moreira, A., Wessel, B., and Krieger, G.: TanDEM-X: The New Global DEM Takes Shape, IEEE Geosci. Remote Sens. Mag., 2, 8–23, https://doi.org/10.1109/MGRS.2014.2318895, 2014.