Articles | Volume 382
https://doi.org/10.5194/piahs-382-583-2020
Pre-conference publication
 | 
22 Apr 2020
Pre-conference publication |  | 22 Apr 2020

Land Subsidence risk maps and InSAR based angular distortion structural vulnerability assessment: an example in Mexico City

Enrique Fernández-Torres, Enrique Cabral-Cano, Dario Solano-Rojas, Emre Havazli, and Luis Salazar-Tlaczani
Abstract

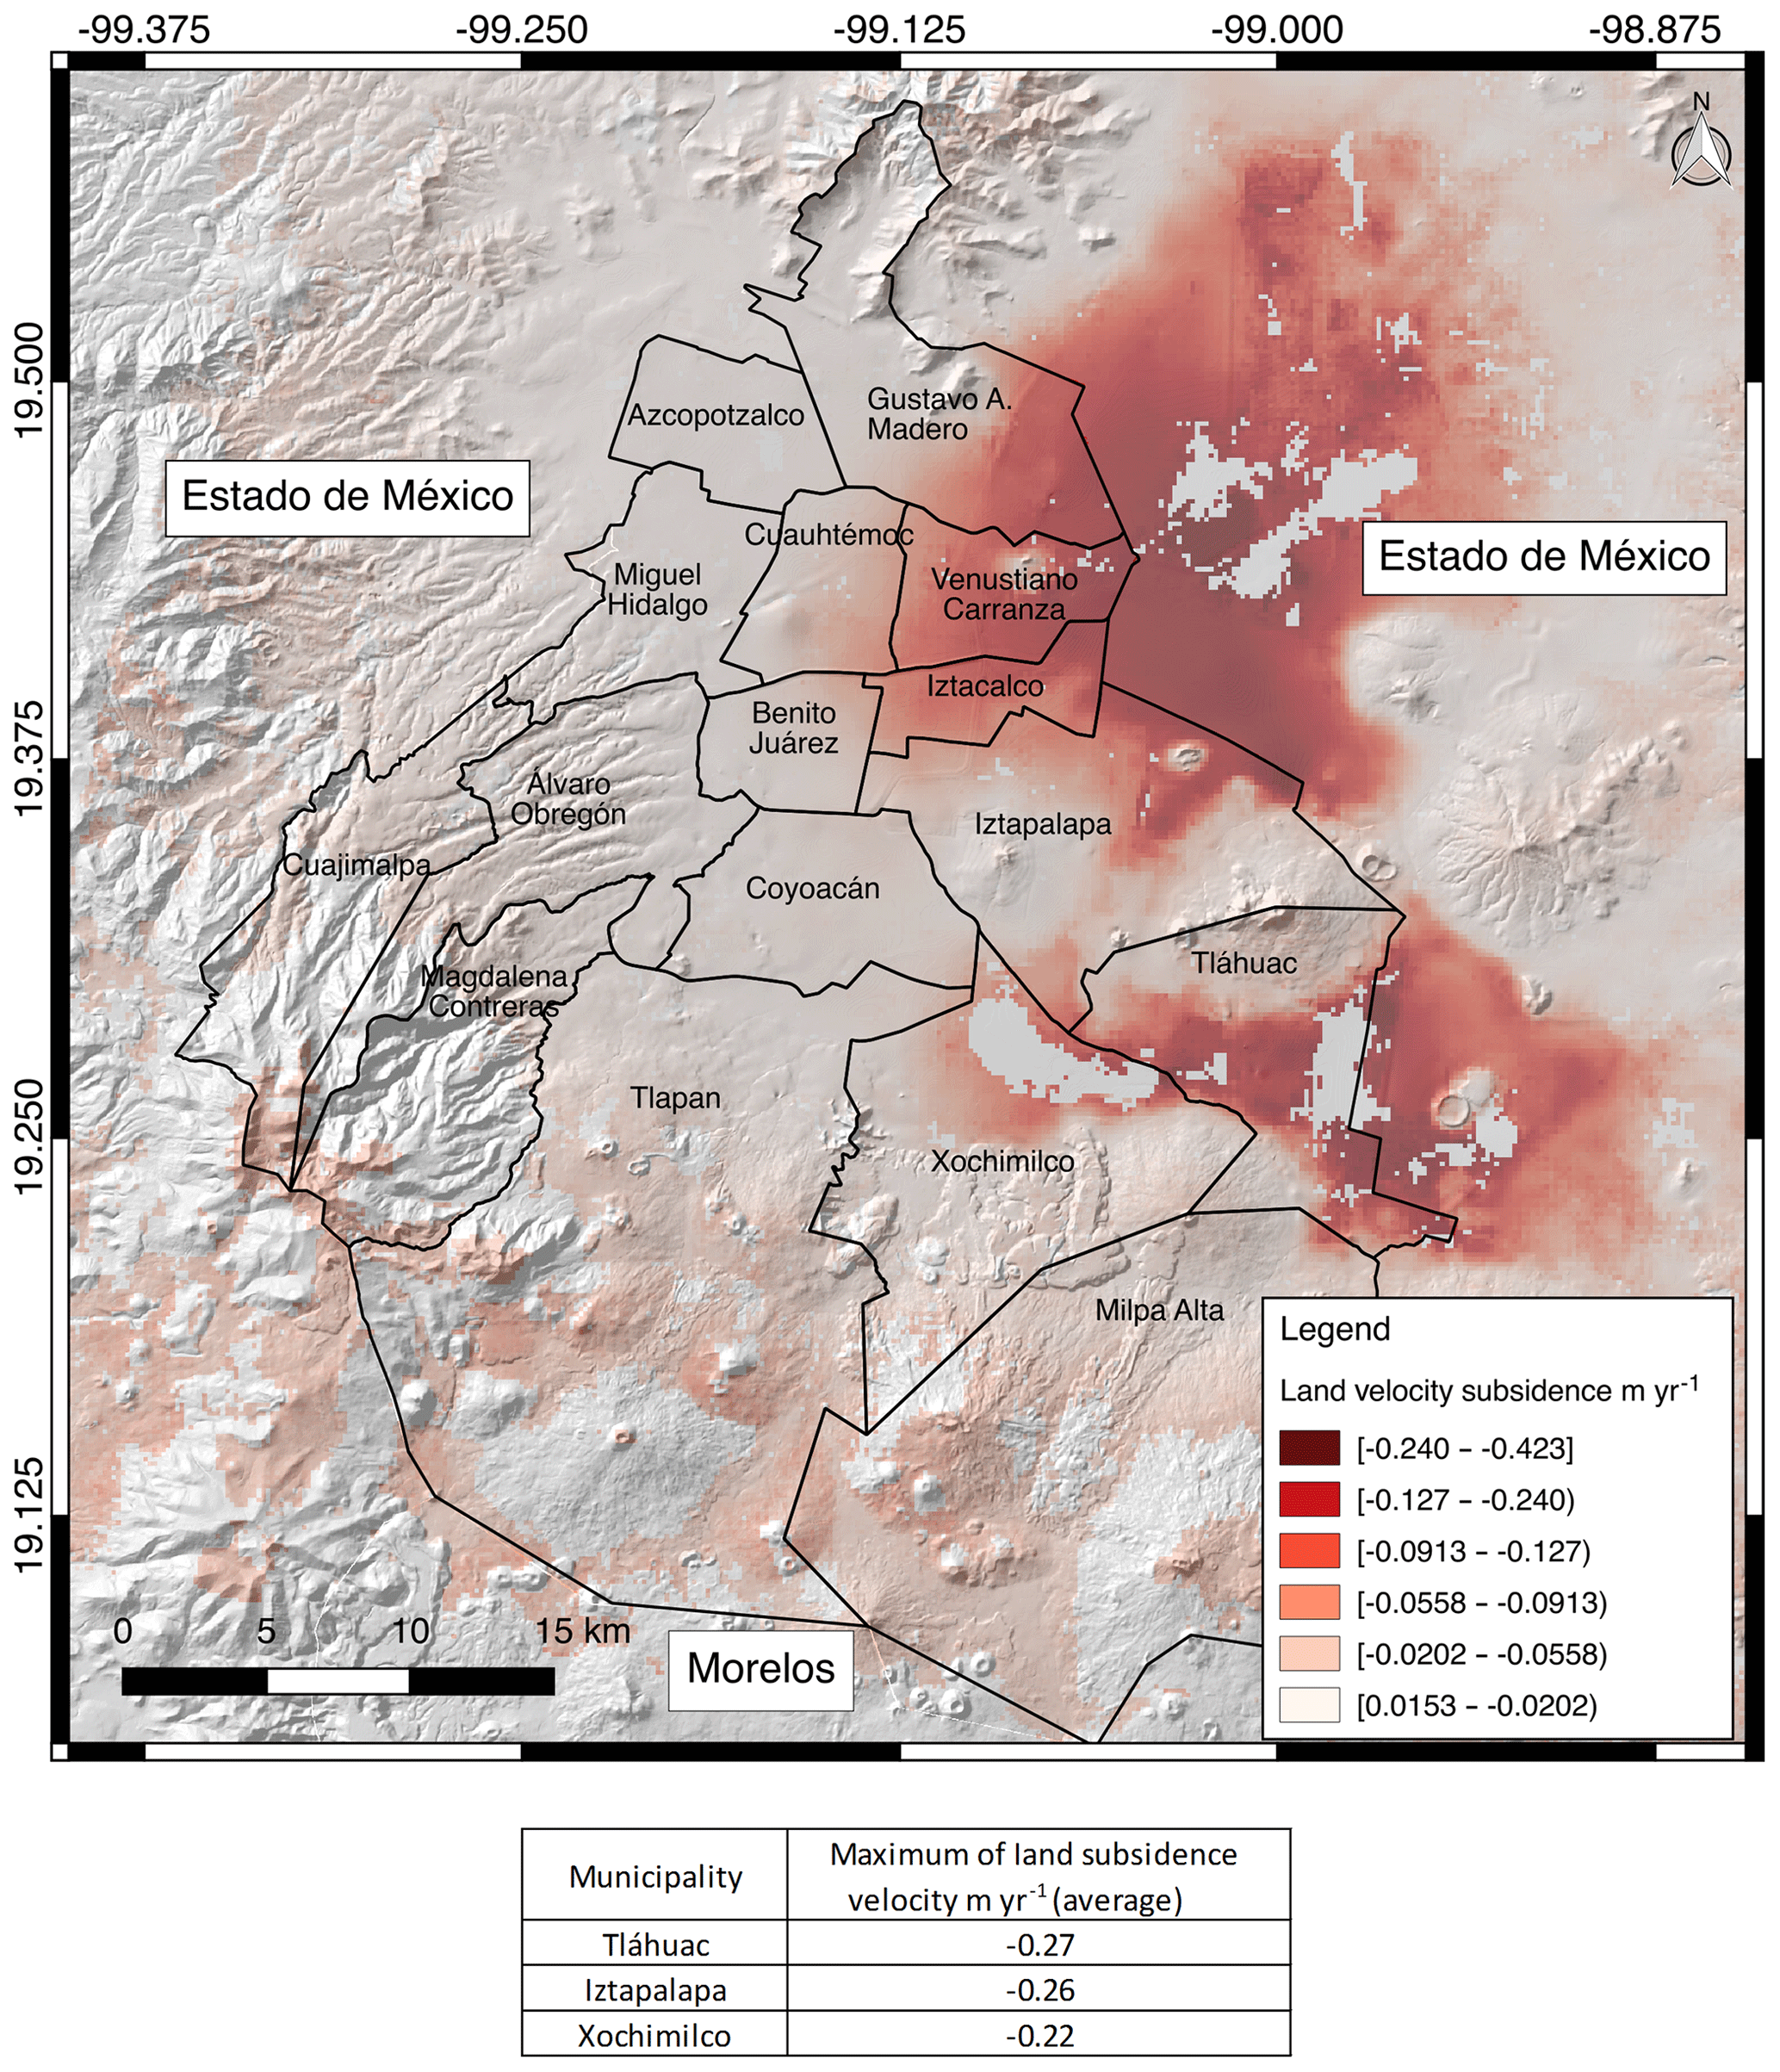
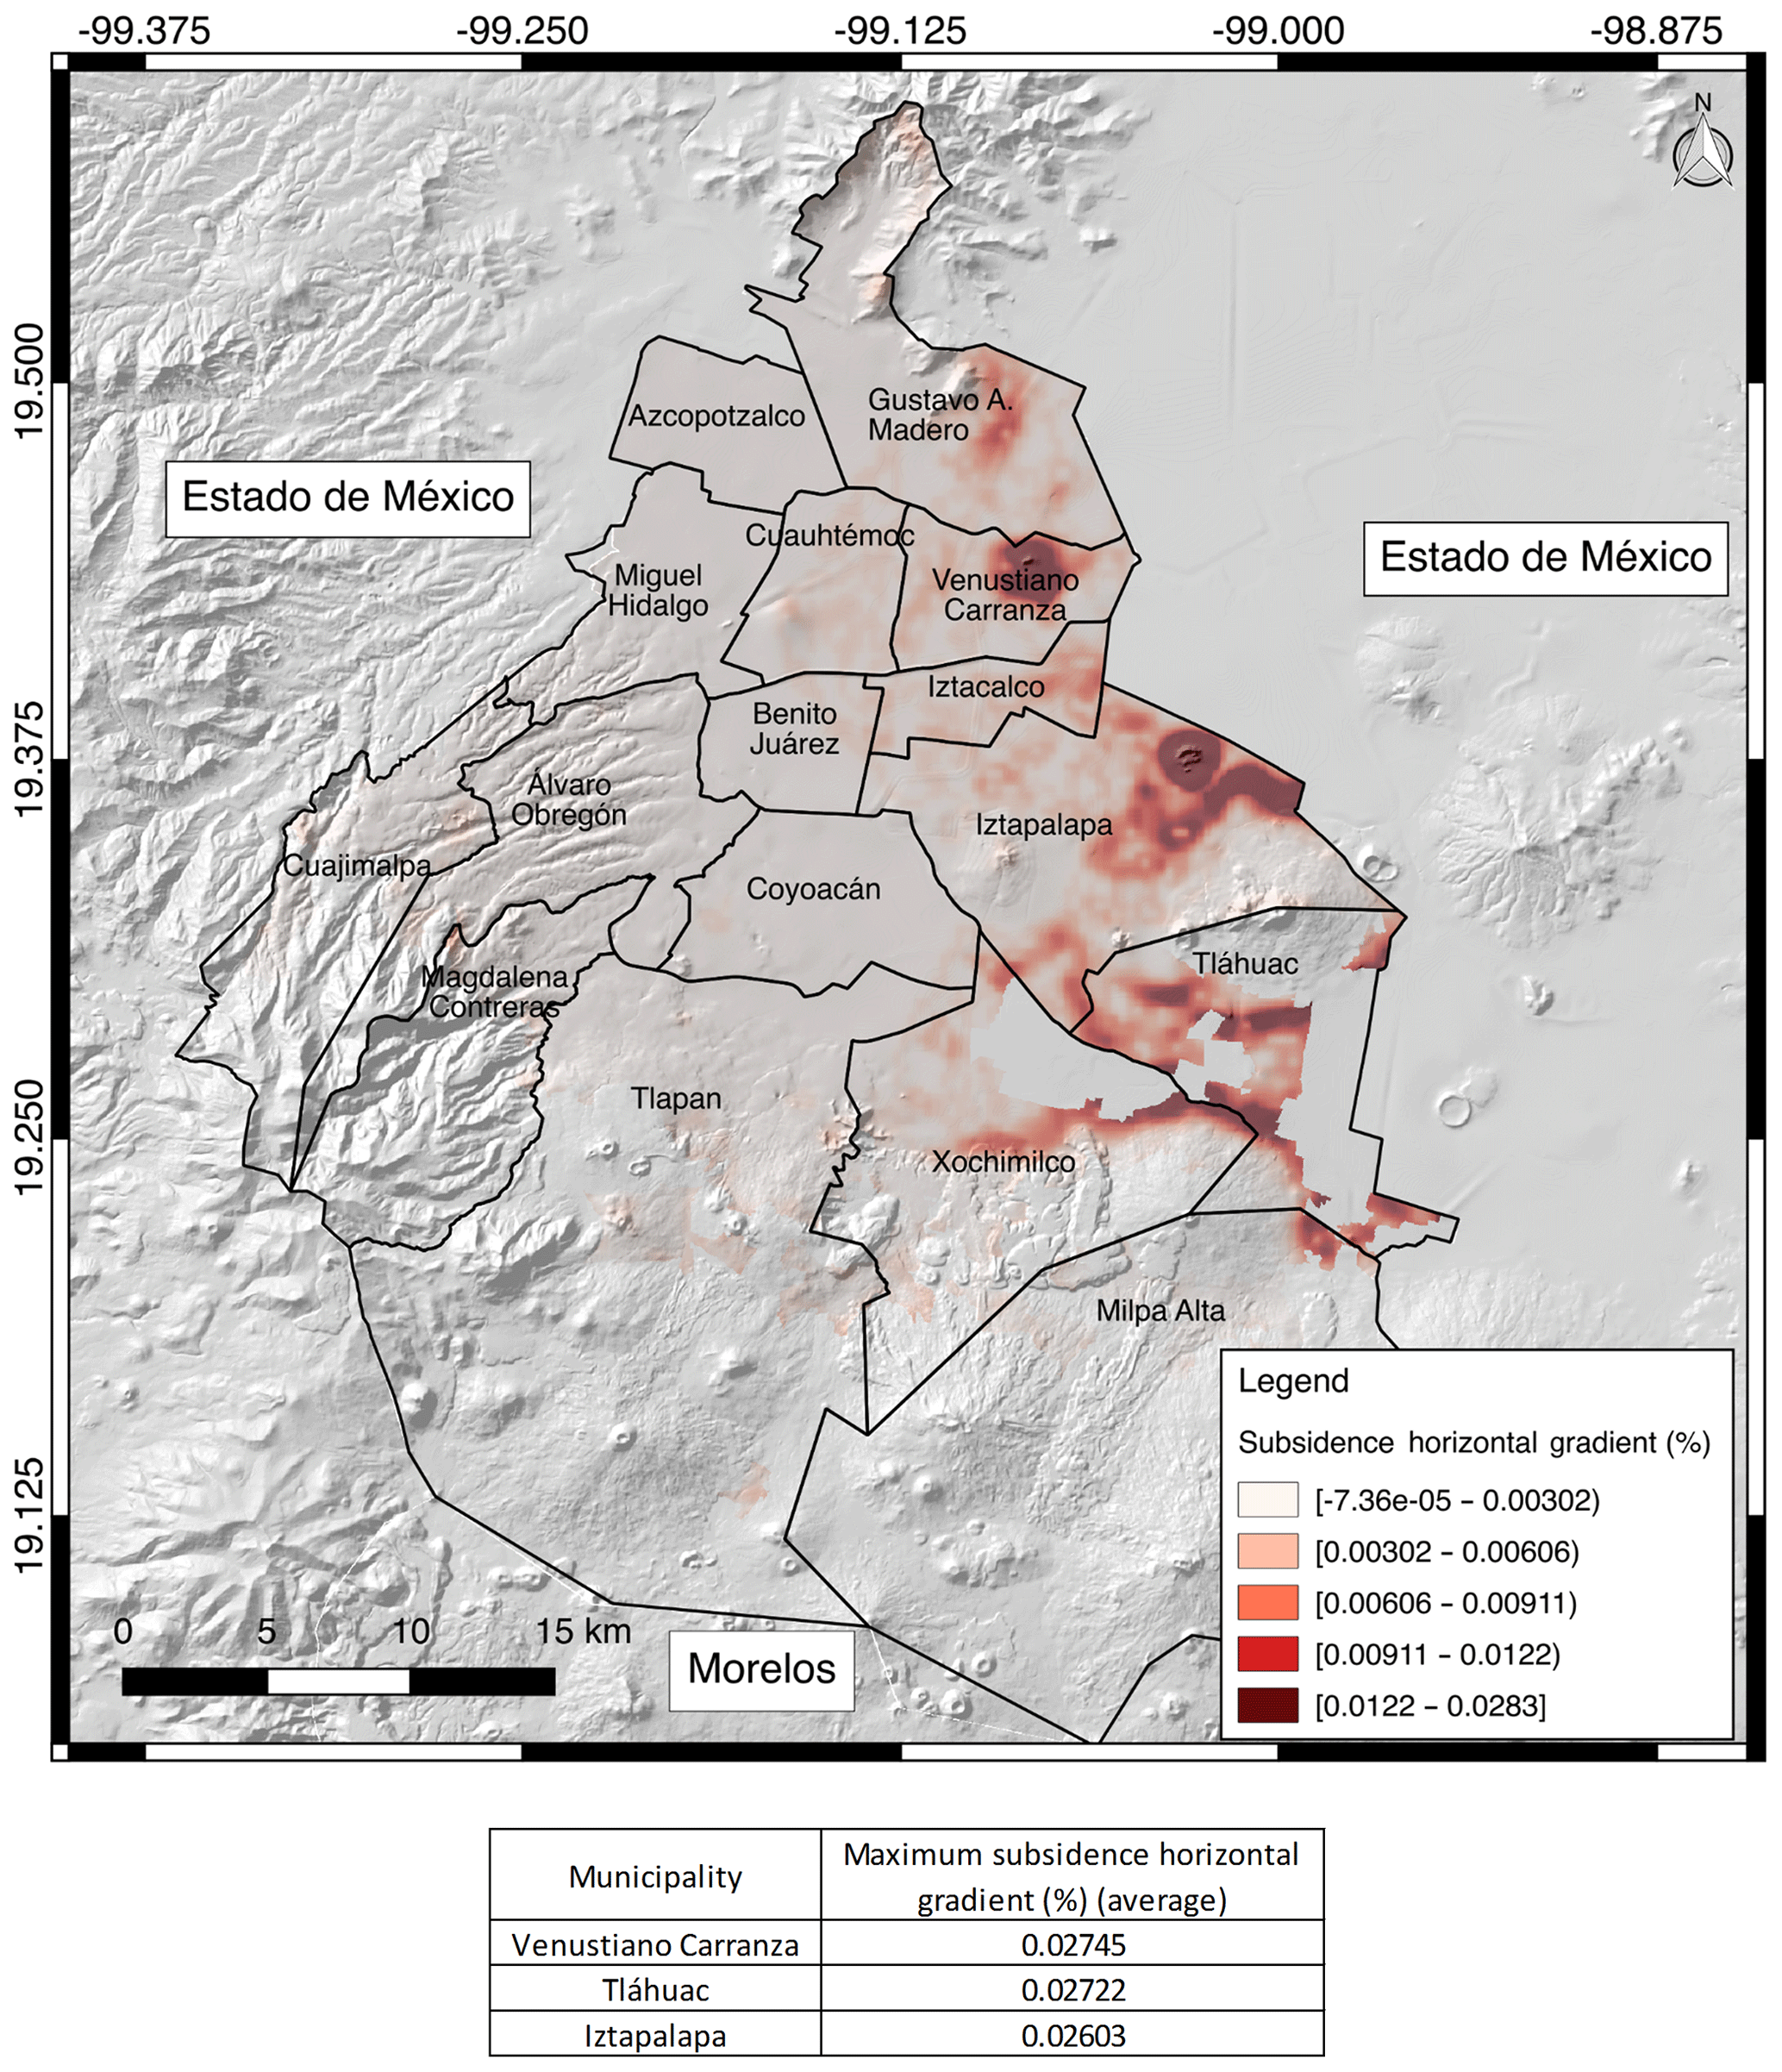
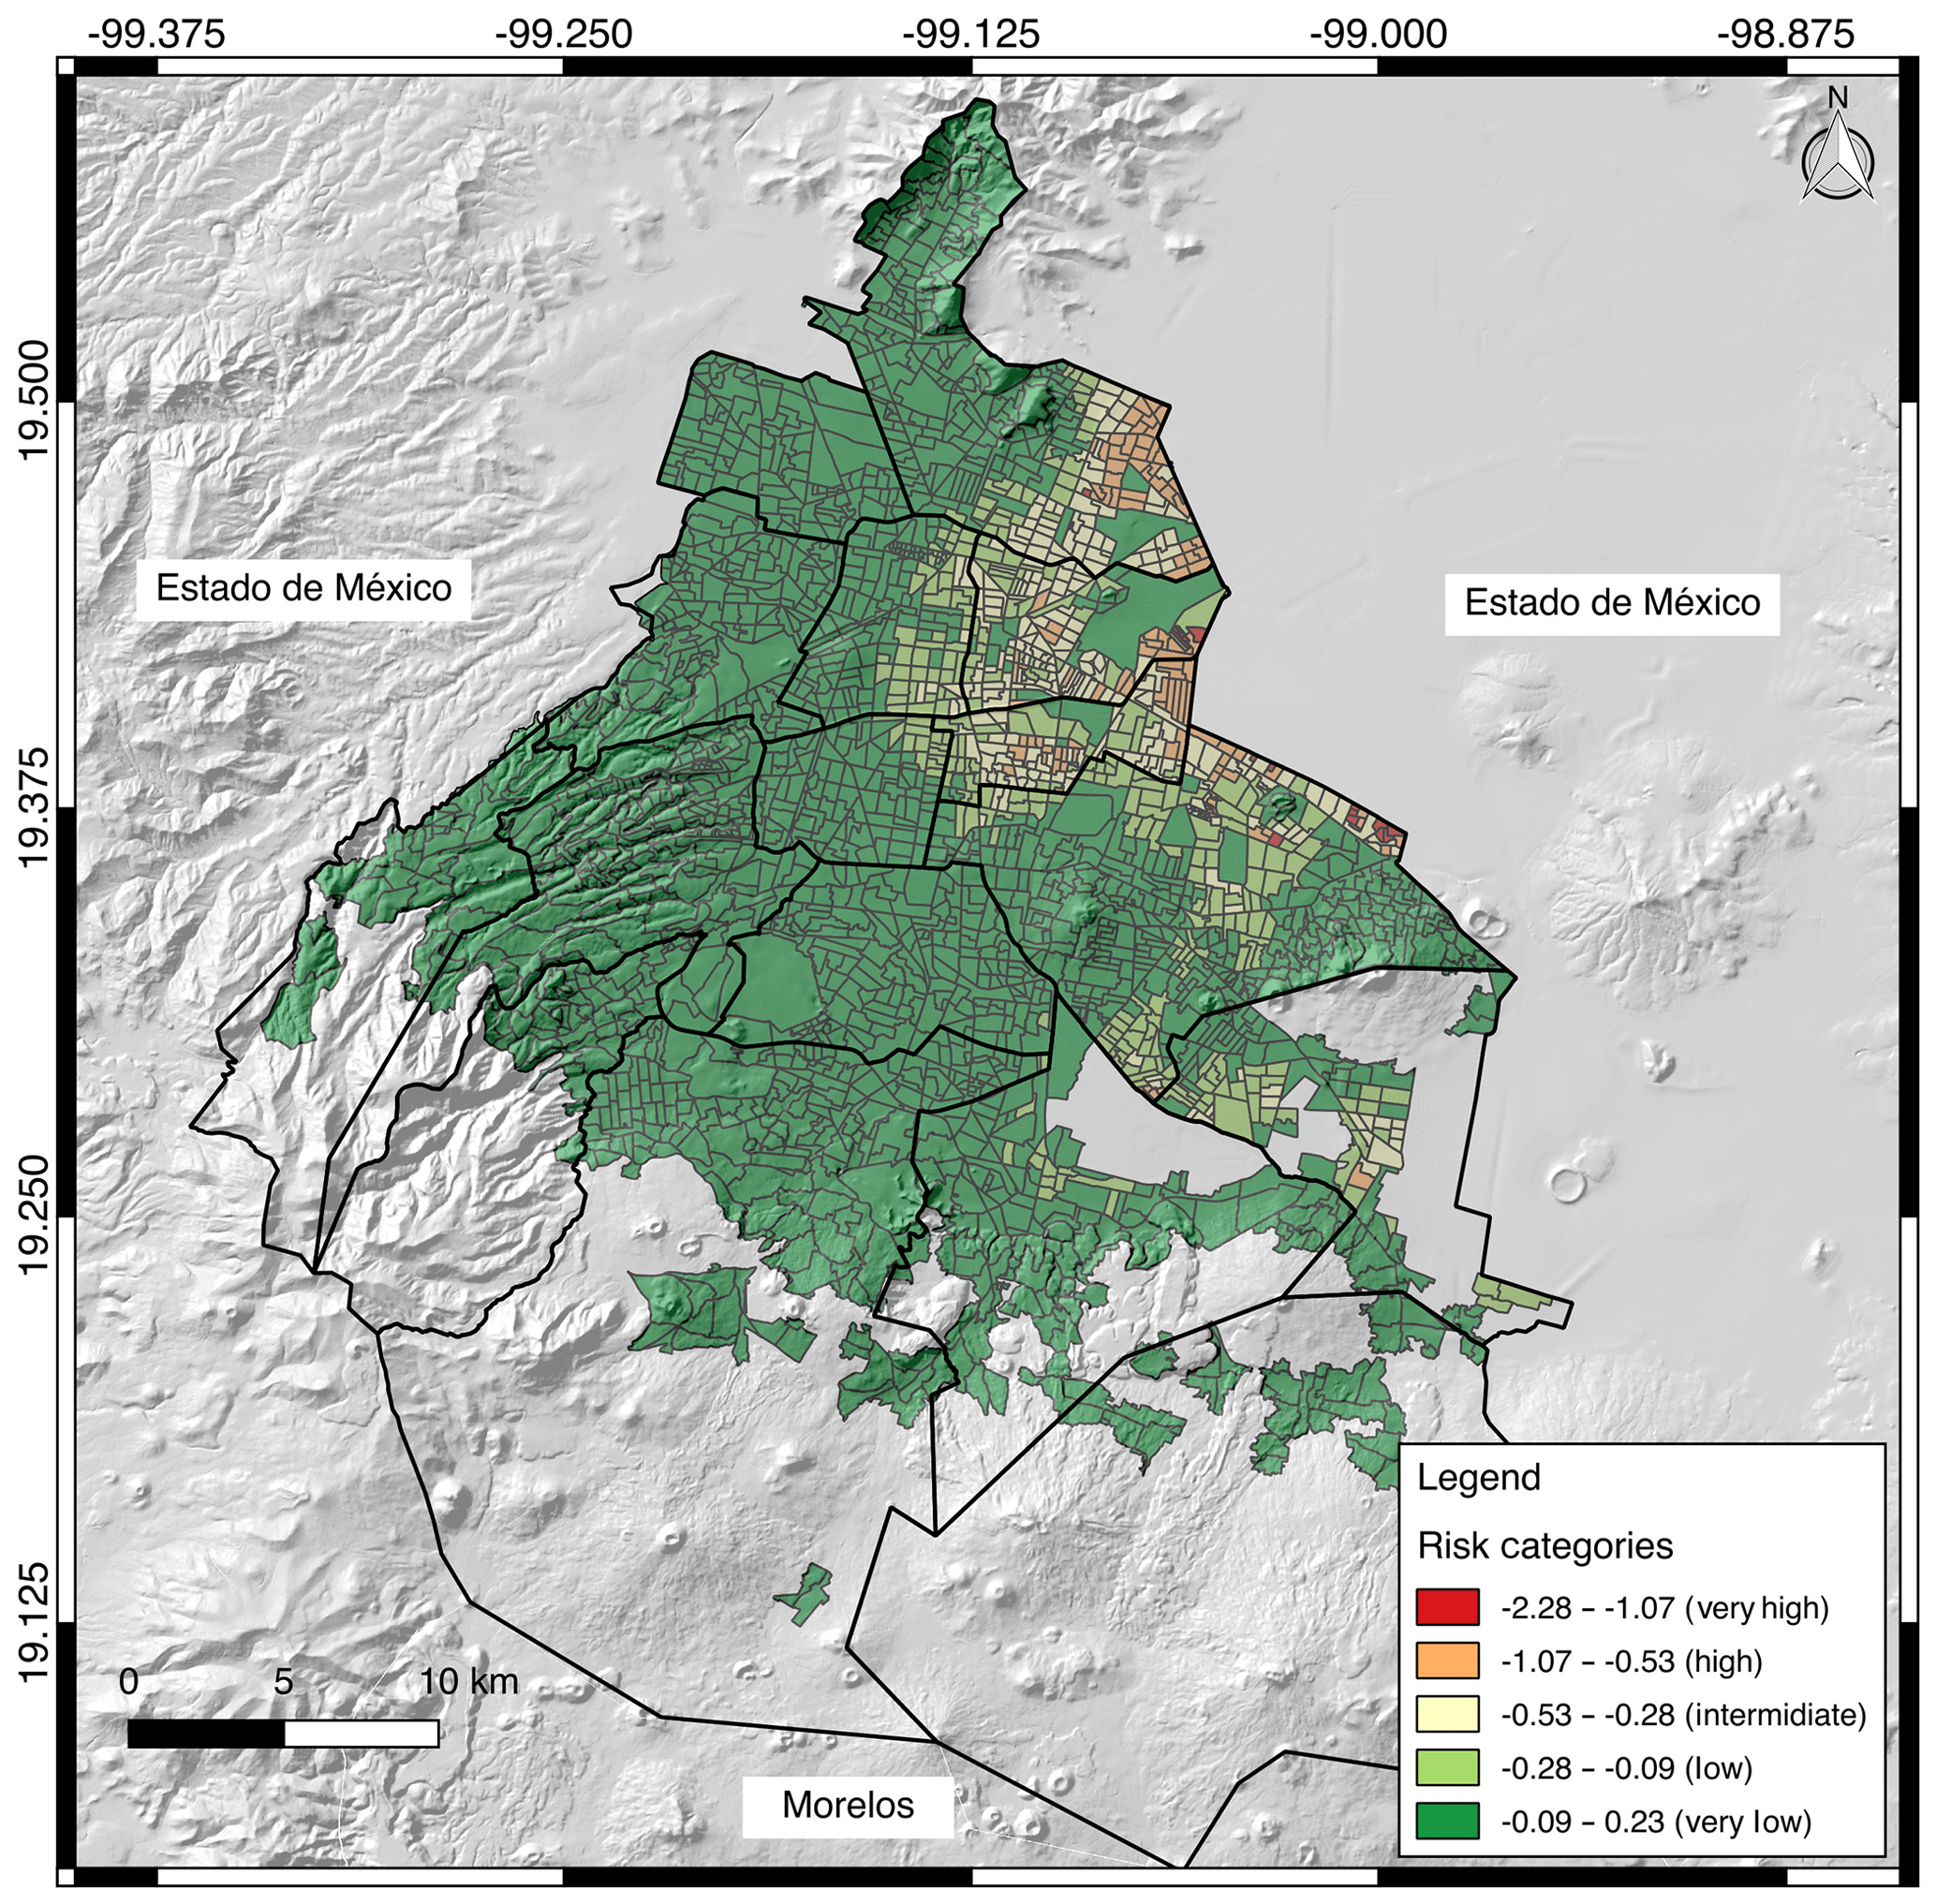
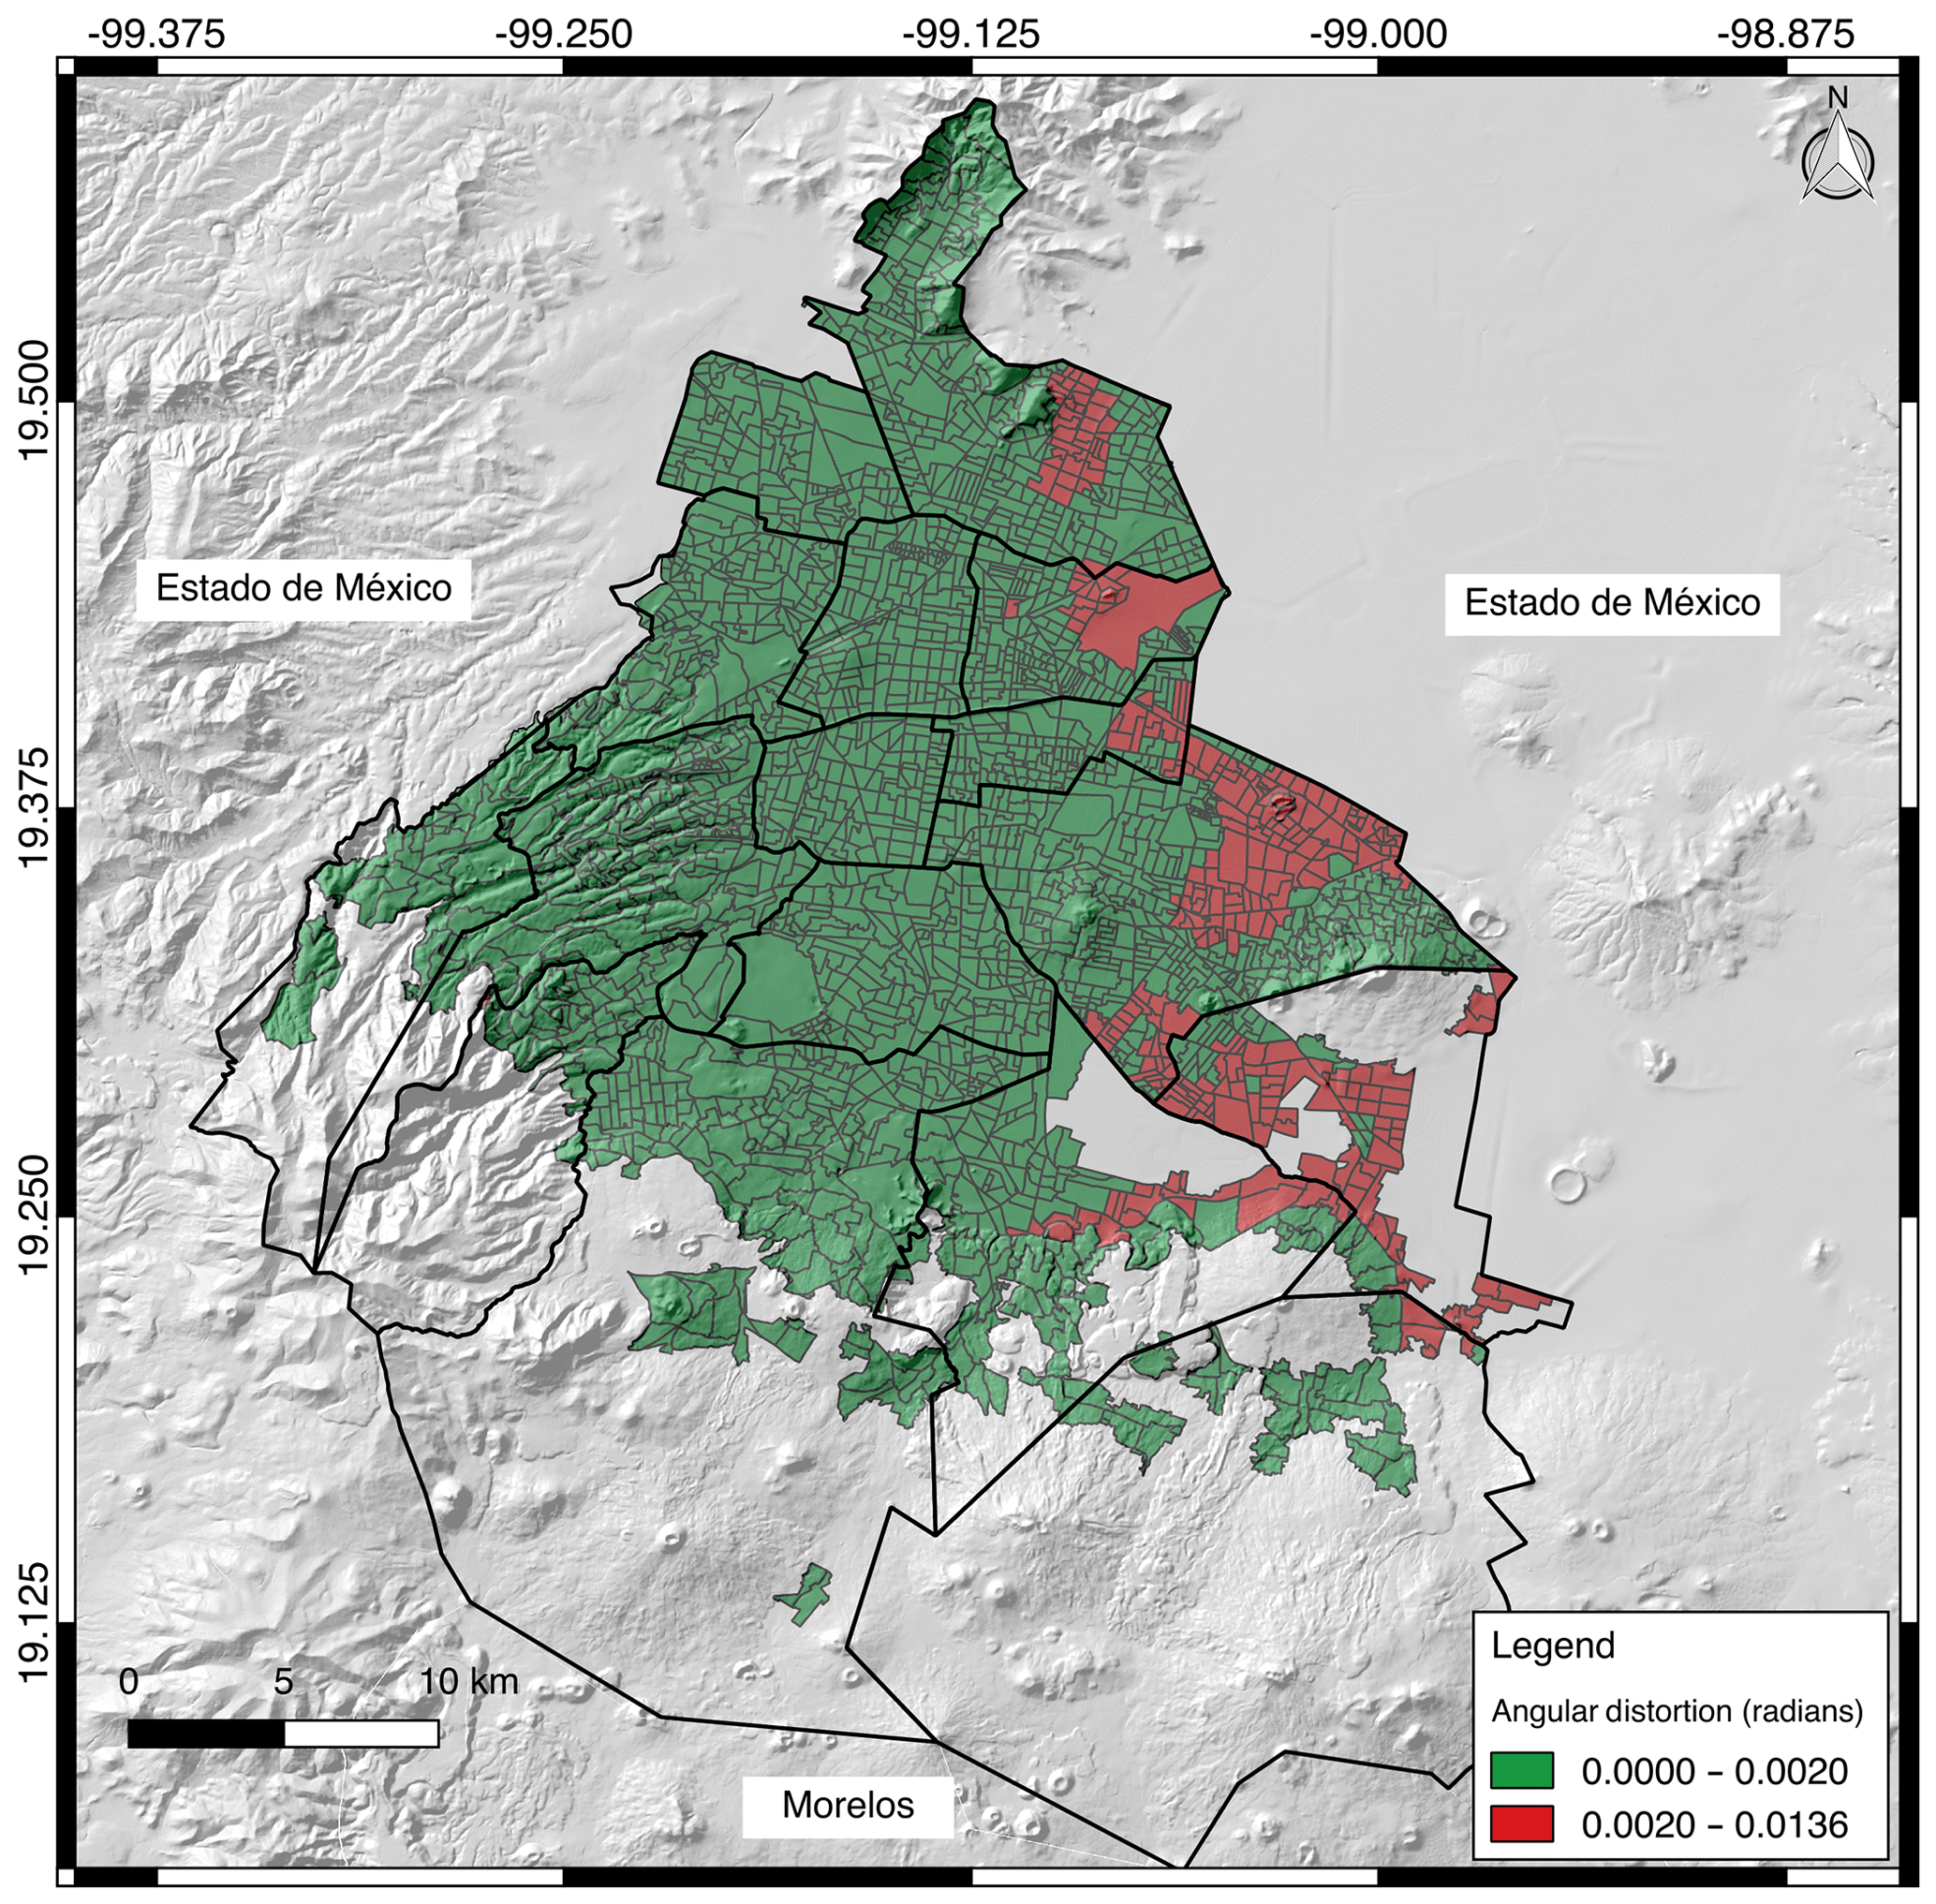
Land subsidence is a phenomenon present in several cities in central Mexico, and results from a combination of groundwater resources' overexploitation and the local stratigraphic nature. Furthermore, subsidence occurs inhomogeneously in space, producing differential vertical displacements, which affect both the natural media, as well as human-built structures. Subsidence associated structural-vulnerability assessments usually rely on direct field measurements to determine parameters such as angular distortion. However, the large areas in which land subsidence occurs (city-scale) in Mexico City hinders a direct quantification of differential displacements for all buildings and structures present in it. A Sentinel-1 based subsidence analysis shows that the highest velocities are located on the eastern sector of the city. This velocity map was used as the basis for a population density weighted land subsidence correlation analysis. Our Land Subsidence Risk assessment indicates that 15.43 % of the population of Mexico City live in intermediate, high and very-high risk zones which corresponds to 1 358 873 inhabitants. Therefore, a significant percentage of Mexico City's population is vulnerable to suffering damage in their housing structures due to land subsidence. Furthermore, the lower income inhabitants share a proportionally greater economic cost due to land subsidence and associated shallow faulting. The structural vulnerability analysis of the civil structures in the city was performed using angular distortion maps derived from the subsidence velocity gradient between October 2014–October 2017 period. These maps indicate that within this time window, ∼12 % of the total urbanized area in Mexico City had already exceeded a 0.002 radian angular distortion threshold; above which damage in civil structures is more likely to occur. In fact, more than 1 million people have already suffered damages in their houses due to the differential ground subsidence and the resulting structural angular distortion. With these results, we can evaluate correspondence between angular distortion map and critical infrastructure of the city, as a result, we found that between 0 % and 12.84 % of these buildings have undergone over 0.002 radian angular distortion.

1 Introduction

Mexico's central region has the higher population density of all the country (INEGI, 2011) therefore this condition creates an accelerated demand of public services among them potable water. In the case of Mexico City, more than 70 % of this water come from the aggressive exploitation of the underground aquifer of the basin (Santoyo-Villa et al., 2005). The intense underground extraction produces piezometric reduction and an increase of the effective stresses within the subsoil that generates compaction and causes land subsidence velocities of outstanding magnitude (e.g. Carrillo, 1948; Cabral-Cano et al., 2008, 2011).

Ground subsidence risk maps are a valuable decision element to help local authorities design better risk management, land use and mitigation strategies for cities under intense subsidence. In Mexico City, methodology to create risk an hazard maps have been refined for the past years (Cabral-Cano et al., 2011, 2015; Solano-Rojas, 2013) to help create an adequate characterization of subsidence velocity and its associated surface faulting as well as the spatial relationship between those process and the population density (e.g. Solano-Rojas, 2013).

Continuous ground subsidence results in severe damage to urban infrastructure and civil infrastructure. Angular distortion is a valid alternative to evaluate damages of civil infrastructure caused by land subsidence. This parameter measures the difference of subsidence of two adjacent supports relative to the distance between them (Skempton and MacDonald, 1956), and threshold limits of angular distortion beyond which it is expected that there will be damage to civil structures. This analysis can be useful as a criterion for evaluation of the impact of differential subsidence over the civil structures in Mexico City.

This work is aimed toward the use of InSAR-derived products to obtain ground subsidence velocity map and subsidence horizontal gradient map combined with population density to generate a land subsidence hazard map. Furthermore, these products were also used for a, structural vulnerability analysis of the civil structures in the city using an angular distortion estimation derived from the subsidence horizontal gradient map, this methodology allowed the evaluation of critical infrastructure due to angular distortion.

2 Methodology

2.1 Land subsidence velocity and subsidence horizontal gradient maps

Ground subsidence velocity and subsidence horizontal gradient maps are based on space-based Synthetic Aperture Radar (SAR) acquisitions processed using Interferometric SAR (InSAR) techniques. Other InSAR products include time series and velocity maps, obtained from an SBAS analysis.

For this job, InSAR processing from Sentinel 1a and b data was used to obtain an SBAS derived subsidence velocity map (Fig. 1). Subsidence horizontal gradient was calculated (Cabral-Cano et al., 2011), using a slope algorithm, available in QGIS v 2.18 (Fig. 2).

https://www.proc-iahs.net/382/583/2020/piahs-382-583-2020-f01

Figure 1Velocity of Land Subsidence (LOS) of Mexico City (October 2014–October 2017). The shaded topographic base layer is taken from Continuo de Elevaciones Mexicano 3.0. © Instituto Nacional de Estadística Geografía e Informática (INEGI).

https://www.proc-iahs.net/382/583/2020/piahs-382-583-2020-f02

Figure 2Subsidence Horizontal Gradient of Mexico City. The shaded topographic base layer is taken from Continuo de Elevaciones Mexicano 3.0. © Instituto Nacional de Estadística Geografía e Informática (INEGI).

Both maps land subsidence velocity and subsidence gradient were divided into five categories using the algorithm Natural Break (Jenks, 2007) as the criterion of classification in order to better discriminate among classes.

2.2 Land Subsidence Risk assessment

A Risk map was computed using algebra maps by multiplying the sum of land subsidence velocity and subsidence horizontal gradient with the population density (INEGI, 2011, 2012). To better estimate the distribution of the city regions where most people are affected by these processes. To define of relative weight of the previously mentioned variables that defined hazard due to land subsidence and associated faulting we considered the relative importance of each parameter as shown on Eq. (1). We assigned three times more weight to subsidence horizontal gradient than land subsidence because subsidence gradient represents differential ground displacement of civil structures and as a result, the higher subsidence gradient, the higher shear stress and the consequent development of faults and damage to structures (Cabral-Cano et al., 2015). On the other hand, if the magnitude of land subsidence velocity is spatially homogeneous on an area, the probability of damage in urban infrastructure is reasonably lower. The equation that define the risk due to land subsidence and associated faulting is the following:

(1) Risk = 3 × SHG + V sub × Pop den

Where SHG is the subsidence horizontal gradient, Vsub is the land subsidence velocity and Popden is the population density of Mexico City.

Finally, we divided risk map (Fig. 3) into five categories by using the Natural Break algorithm (Jenks, 2007) and counting the population inside each category.

https://www.proc-iahs.net/382/583/2020/piahs-382-583-2020-f03

Figure 3Hazard zonation for surface faulting associated to ground subsidence in the Mexico City. The shaded topographic base layer is taken from Continuo de Elevaciones Mexicano 3.0. © Instituto Nacional de Estadística Geografía e Informática (INEGI).

2.3 Structural vulnerability analysis of the civil due to angular distortion and exposition of critical infrastructure of the city

To compute the angular distortion map we used the raster calculator available in QGIS v2.18 to transform the subsidence horizontal gradient from percentage into radians. This map expressed in radians let us to evaluate the places of the city that are above the 0.002 radian threshold that is the recommended value to avoid damage in urban infrastructure (Skempton and MacDonald, 1956; Bjerrum, 1963; Zhang and Ng, 2007). The next stage was the evaluation of structural vulnerability by counting the area and population which are affected their infrastructure due to angular distortion for this propose the information of the 2010 Mexico's population census was used (INEGI, 2011, 2012).

To evaluate the structural vulnerability of critical infrastructure of the Mexico we mapped these discrete points over the angular distortion layer and recorded the of angular distortion value for each point or polyline by using the add raster value to feature tool available in QGIS 2.18.

3 Results

The eastern sector of Mexico City is undergoing rapid subsidence due to overexploitation of ground water resources and the consequent compaction of clay-rich lacustrine sediment (Osmanoğlu et al., 2011). According to our land subsidence velocity map (Fig. 1) the municipalities with higher land subsidence velocities are Tláhuac (−0.27 m yr−1), Iztapalapa (−0.26 m yr−1), and Xochimilco (−0.22 m yr−1). These areas show the highest values of land subsidence because of combination of lacustrine deposits with high ground water extraction rates.

The subsidence horizontal gradient map show that municipalities with highest values are Venustiano Carranza (0.02745 %), Tláhuac (0.02722 %), and Iztapalapa (0.02603 %) (see Fig. 2). Moreover, as the highest values of subsidence gradient represents potential areas of surface, the horizontal gradient is an excellent proxy for assessing potential structural damage to civil structures and other hydraulic infrastructure. The development of higher values of subsidence gradient (Fig. 2) is controlled by the sharp transition between highly compressible lacustrine deposits and volcanic structures (Auvinet, et al., 2017).

The hazard map due to land subsidence and associated faulting combines risk elements represented by the velocity of land subsidence and subsidence gradient. On the other hand, local density population represents the vulnerability indicator. After applying map algebra using Eq. (1) we found that municipalities with higher area and population that fall under intermediate, high and very high risks categories are Gustavo A. Madero (18.25 km2, 369 387 inhabitants), Venustiano Carranza (18.25 km2, 329 338 inhabitants), Iztacalco (13.21 km2, 292 241 inhabitants.), and Iztapalapa (11.49 km2, 262 892 inhabitants) (Fig. 3). This underscores the presence of high land subsidence velocities and differential subsidence rates with higher density of population. The land subsidence hazard map is a valuable decision element to help local authorities design the best hazard mitigation and management strategies for cities under intense subsidence.

The angular distortion map shows that the eastern portion of the city is where civil structures have exceeded 0.002 radian which is the recommended threshold to avoid damage in urban infrastructure (Skempton and MacDonald, 1956; Bjerrum, 1963; Zhang and Ng, 2007). According to our angular distortion map (Fig. 4), more than 12  % of the area and 13  % of the population of Mexico City which corresponds to an area of 97.47 km2 and a population of 1 110 790 inhabitants which are affected.

https://www.proc-iahs.net/382/583/2020/piahs-382-583-2020-f04

Figure 4Angular distortion map of Mexico City. The shaded topographic base layer is taken from Continuo de Elevaciones Mexicano 3.0. © Instituto Nacional de Estadística Geografía e Informática (INEGI).

Our assessment of Mexico City's critical infrastructure of between 0 % and 12.84 % of these buildings overcome 0.002 radians of angular distortion (Fig. 5). This analysis is of further importance in case of occurrence of other phenomena such as earthquakes.

https://www.proc-iahs.net/382/583/2020/piahs-382-583-2020-f05

Figure 5Mexico City's critical infrastructure assessment.

Download

4 Conclusions

Our land subsidence risk analysis in Mexico City shows that this process affects the eastern portion of the city. The angular distortion product is a valuable tool to assess the structural vulnerability and allowed us to estimate areas with the highest structural damage. The angular distortion map may is an excellent proxy to help local authorities design the best risk mitigation and management strategies.

Data availability

Sentinel 1a and b SAR data used on this work was provided by the European Space Agency (ESA) through the Alaska Satellite Facility SAR Data Center (ASF SDC) at https://www.asf.alaska.edu/ (Alaska Satellite Facility SAR Data Center, 2020).

Author contributions

EFT provided formal analysis, investigation, methodology and writing of original draft. ECC provided conceptualization of the project, investigation, resources and writing of original draft and supervision, DSR provided formal analysis and review and editing of draft, EH provided formal analysis and methodology, LST provided investigation and validation.

Competing interests

The authors declare that they have no conflict of interest.

Special issue statement

This article is part of the special issue “TISOLS: the Tenth International Symposium On Land Subsidence – living with subsidence”. It is a result of the Tenth International Symposium on Land Subsidence, Delft, the Netherlands, 17–21 May 2021.

Acknowledgements

Enrique Fernández-Torres acknowledges support from CONACyT during his MS dissertation. Dario Solano-Rojas acknowledges support from CONACyT and Fulbright-García Robles. SAR data was kindly provided by the European Space Agency (ESA). Part of the InSAR processing was done on UNAM-DGTIC’s Miztli supercomputing facility with processing time granted by LANCAD and CONACyT.

Financial support

This research has been supported by the Universidad Nacional Autónoma de México, Dirección General de Asuntos del Personal Académico, DGAPA-PAPIIT projects IV100215 and IN104818-3 and Consejo Nacional de Ciencia y Tecnología (CONACyT) projects 256012 and 005955 to Enrique Cabral-Cano.

References

Alaska Satellite Facility SAR Data Center: Sentinel-1 Interferometric Wide swath Track 143, Frame 3203, descending mode, acquired between 3/10/2014 and 29/10/2017, available at: https://www.asf.alaska.edu, last access: 14 April 2020. 

Auvinet, G., Méndez, E., and Juárez, M.: El Subsuelo de la Ciudad de México, Instituto de Ingeniería, UNAM, Vol. III, 2017, México CDMX, México, 2017. 

Bjerrum, L.: Discussion, Proc. European Conference on Soil Mechanic and Foundation Engineering, Wiesbaden, Germany, vol. III, p. 135, 1963. 

Cabral-Cano, E., Dixon, T. H., Miralles-Wilhelm, F., Saìnchez- Zamora, O., Díaz-Molina, O., and Carande, R. E.: Space Geodetic Imaging of Rapid Ground Subsidence in México City, B. Am. Geol. Soc., 120, 1556–1566, https://doi.org/10.1130/B26001.1, 2008. 

Cabral-Cano, E., Diaz Molina, O., and Delgado-Granados, H.: Subsidencia y Mapas de Peligro por Fallamiento Superficial: Un Ejemplo en el área Nororiental de la Zona Metropolitana de la Ciudad de México, Bol. Soc. Geol. Mex., 63, 53–60, 2011.  

Cabral-Cano, E., Solano-Rojas, D., Oliver-Cabrera, T., Wdowinski, S., Chaussard, E., Salazar-Tlaczani, L., Cigna, F., DeMets, C., and Pacheco-Martínez, J.: Satellite geodesy tools for ground subsidence and associated shallow faulting hazard assessment in central Mexico, Proc. IAHS, 372, 255–260, https://doi.org/10.5194/piahs-372-255-2015, 2015. 

Carrillo, N.: Influence of Artesian Wells on the Sinking of Mexico City, Proceedings, Second International Conference on Soil Mechanics and Foundation Engineering, 21–30 June 1948, Rotterdam, the Netherlands, vol. 2, 156–159, 1948. 

INEGI: Conteos de población y vivienda 2010: INEGI, available at: https://www.inegi.org.mx/programas/ccpv/2010/ (last access: 14 April 2020), 2011. 

INEGI: Vectorial de localidades amanzandas y números exteriores, Urbanas. Cierre de planeación del Censo de Población y Vivienda, available at: https://www.inegi.org.mx/app/mapas/default.html (last access: 14 April 2020), 2012. 

Jenks, G. F.: Natural Breaks, Release 9.2, Last modified August 15, 2007. ESRI, ArcGIS 9.2 Desktop Help, available at: http://webhelp.esri.com/arcgisdesktop/9.2/index.cfm?topicname=natural_breaks_(jenks) (last access: 14 April 2020), 2007. 

Osmanoğlu, B., Dixon, T. H., Wdowinski, S., Cabral-Cano, E., and Jiang, Y.: Mexico City Subsidence Observed with Persistent Scatterer InSAR, Int. J. Appl. Earth Obs., 13, 1–12, https://doi.org/10.1016/j.jag.2010.05.009, 2011. 

Santoyo-Villa, E., Ovando, E., Mooser, E., and León, E.: Síntesis Geotécnica de la Cuenca del Valle de México, Publicaciones TGC, México, CDMX, México, 2005. 

Skempton, A. W. and MacDonald, D. H.: Allowable settlement of buildings, Proc. Inst. Civ. Engrs., Part III, 5, 727–768, 1956. 

Solano-Rojas, D. E.: Evaluaciones de Riesgo por Fallamiento Asociado a Subsidencia de INSAR, (Tesis de licenciatura), Universidad Nacional Autónoma de México, Ciudad de México, México, 2013. 

Zhang, L. M. and Ng, A. M. Y.: Limiting Tolerable Settlement and Angular Distortion for Building Foundations, Geo-Denver 2007, 18–21 February 2007, Denver, Colorado, USA, American Society of Civil Engineers, 1–11, https://doi.org/10.1061/40914(233)18, 2007. 

Download
Short summary
Land subsidence in Mexico City results from a combination of groundwater resources' overexploitation and the local stratigraphic nature. A Sentinel-1 based subsidence analysis velocity map was used as the basis for a population density weighted land subsidence correlation analysis. Our Land Subsidence Risk assessment indicates that 15.43 % of the population of Mexico City live in intermediate, high and very-high risk zones which corresponds to 1 358 873 inhabitants.