the Creative Commons Attribution 4.0 License.
the Creative Commons Attribution 4.0 License.
 | 22 Apr 2020
Mapping the autonomous subsidence for the rural and urban areas in Woerden, the Netherlands
Erik van der Putte
Autonomous subsidence plays a major role in the landscape of the western parts of the Netherlands. For a lot of municipalities and waterboards this autonomous subsidence brings immense maintenance costs and discussions about sustainable land use. For the municipality of Woerden the autonomous subsidence is assessed for both rural and urban areas. For the rural areas the oxidation of peat and the consolidation due to gradually lowering of the water table are the main contributors. Using the modified “Phoenix” model the autonomous subsidence is predicted to be approximately 5 to 6 mm yr−1. In the urban areas the water table is stable and therefore the ageing of clay and creep are the driving forces for the autonomous subsidence. Using satellite data the autonomous subsidence is determined to range from 0 to 4 mm yr−1 for most parts of the city.
- Article
(7850 KB) - Full-text XML
- BibTeX
- EndNote


The subsoil of the western and northern parts of the Netherlands consists mainly of weak Holocene peats and clays. These soils are very susceptible for settlements and subsidence. The larger settlements are caused by embankments for raising the surface level for infrastructure, for example. In the recent years autonomous subsidence continues to play a bigger role in the maintenance costs for the municipalities, as it causes damage, but also the uncertainty of the extent of this subsidence is substantial. Autonomous subsidence is described as the subsidence of the surface which occurs naturally. It is becoming increasingly important to know more about this phenomenon and to predict the subsidence velocity. This paper provides some insights. The municipality of Woerden has asked Sweco to investigate and predict the rate of autonomous subsidence for the next 100 years.
The processes of autonomous subsidence and the predictions will be analysed for both the rural and urban areas, as the processes in the two areas differ greatly.
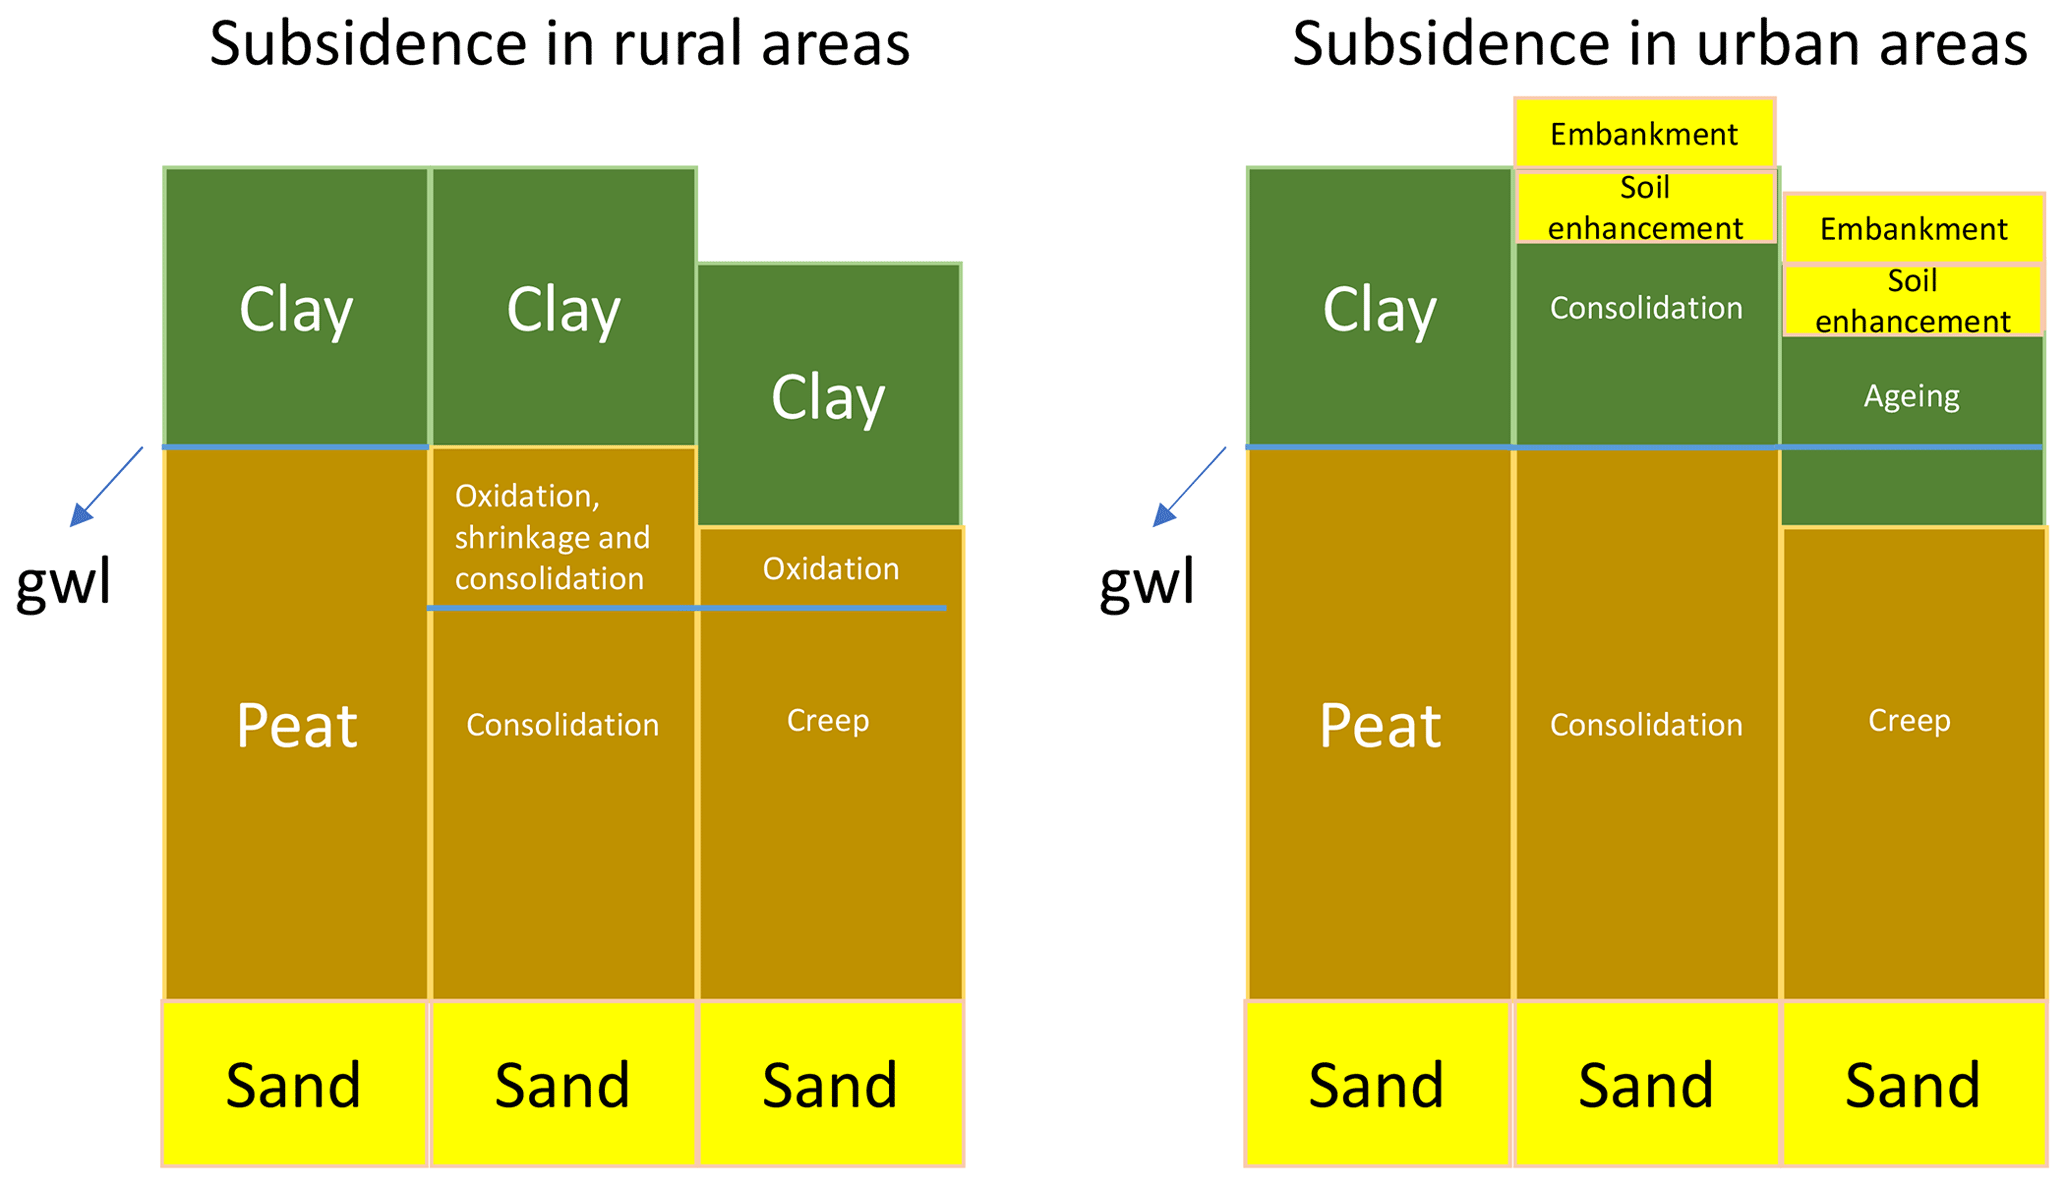
Figure 1Visualisation of the processes of autonomous subsidence in rural and urban areas with clay cover.
In the case described in this paper the subsidence caused by maintaining the water level in the polders is, despite being managed by man, also to be investigated as being a autonomous subsidence. In the next subsections the different mechanisms that cause subsidence will be described and labelled as a contribution to autonomous subsidence or not.
2.1 Consolidation
The most common known mechanism of settlements is consolidation. Consolidation is caused by an increase of total stress on low permeable soils and the following dissipation of the excess pore pressures. The draining of the pore water causes an increase in effective stress and, consequently, a volume change of the layers. This volume change manifests mainly in a change in thickness of the layers which causes settlements of the surface.
Most of the time this consolidation is caused by a recently realized embankment for infrastructure or site preparation for the realization of a new building project. Consolidation settlements are commonly known as primary settlements or primary consolidation. A change in the water table can also be the cause of the change of effective stresses in the subsoil. The water table normally has a fixed offset compared to surface level to sustain the current function of the meadows. The consolidation caused by the lowering of the water table is taken into account when the autonomous subsidence is calculated.
2.2 Creep
The definition of creep is the deformation of soil which occurs without a change of effective stresses. This is observed when the primary settlements and consolidation have taken place. The embankments keep settling although the excess pore pressures have dissipated. Creep is more commonly known as secondary settlement and is considered to contribute to autonomous subsidence.
2.3 Oxidation and shrinkage of peat
Peat mainly consists of organic material. In this material the shrinkage and oxidation go hand in hand.
As the peat dries due to lowering of the water table, during dry periods or because of the withdrawal of water by vegetation, the structure changes. Because of the loss of water the peat is subjected to volume decrease which results in subsidence.
The drying of the peat also makes a path for air into the peat. When this material comes into contact with oxygen, oxidation will occur. The chemical reaction of oxidation decomposes the organic matter into CH4 and CO2. The loss of organic matter results in a loss of volume. These mechanisms are also taken into account when calculating the autonomous subsidence.
2.4 Ageing
The ageing of clay is thought to be the rearrangement of clay particles, which will make the material more dense and increase it's strength. This mechanism can be responsible for quite a large part of the subsidence in areas where young clay layers can be found (in polder areas for example). The ageing is only a process in relatively young clay layers and becomes a less prominent mechanism as the age of the clay layer increases. For this mechanism all Holocene clay layers (< 10 000 years old) are taken into account.
2.5 Tectonics and isostasy
Tectonics and isostasy also play a role in the subsidence or elevation of the surface. The geological processes in the deeper subsoil (plate tectonics etc.) in the Netherlands causes additional subsidence but is small compared to the other mechanisms. This mechanism differentiates itself from the other mechanisms in the fact that also sand layers are subjected to it. Therefore tectonics and isostacy do not introduce differential settlements between constructions with pile foundations and the surface. Because of this these mechanisms are not taken into account for the autonomous subsidence in this paper. According to Van Asselen et al. (2018) the tectonic subsidence and isostasy is 0.3 mm yr−1 in the area of Woerden.
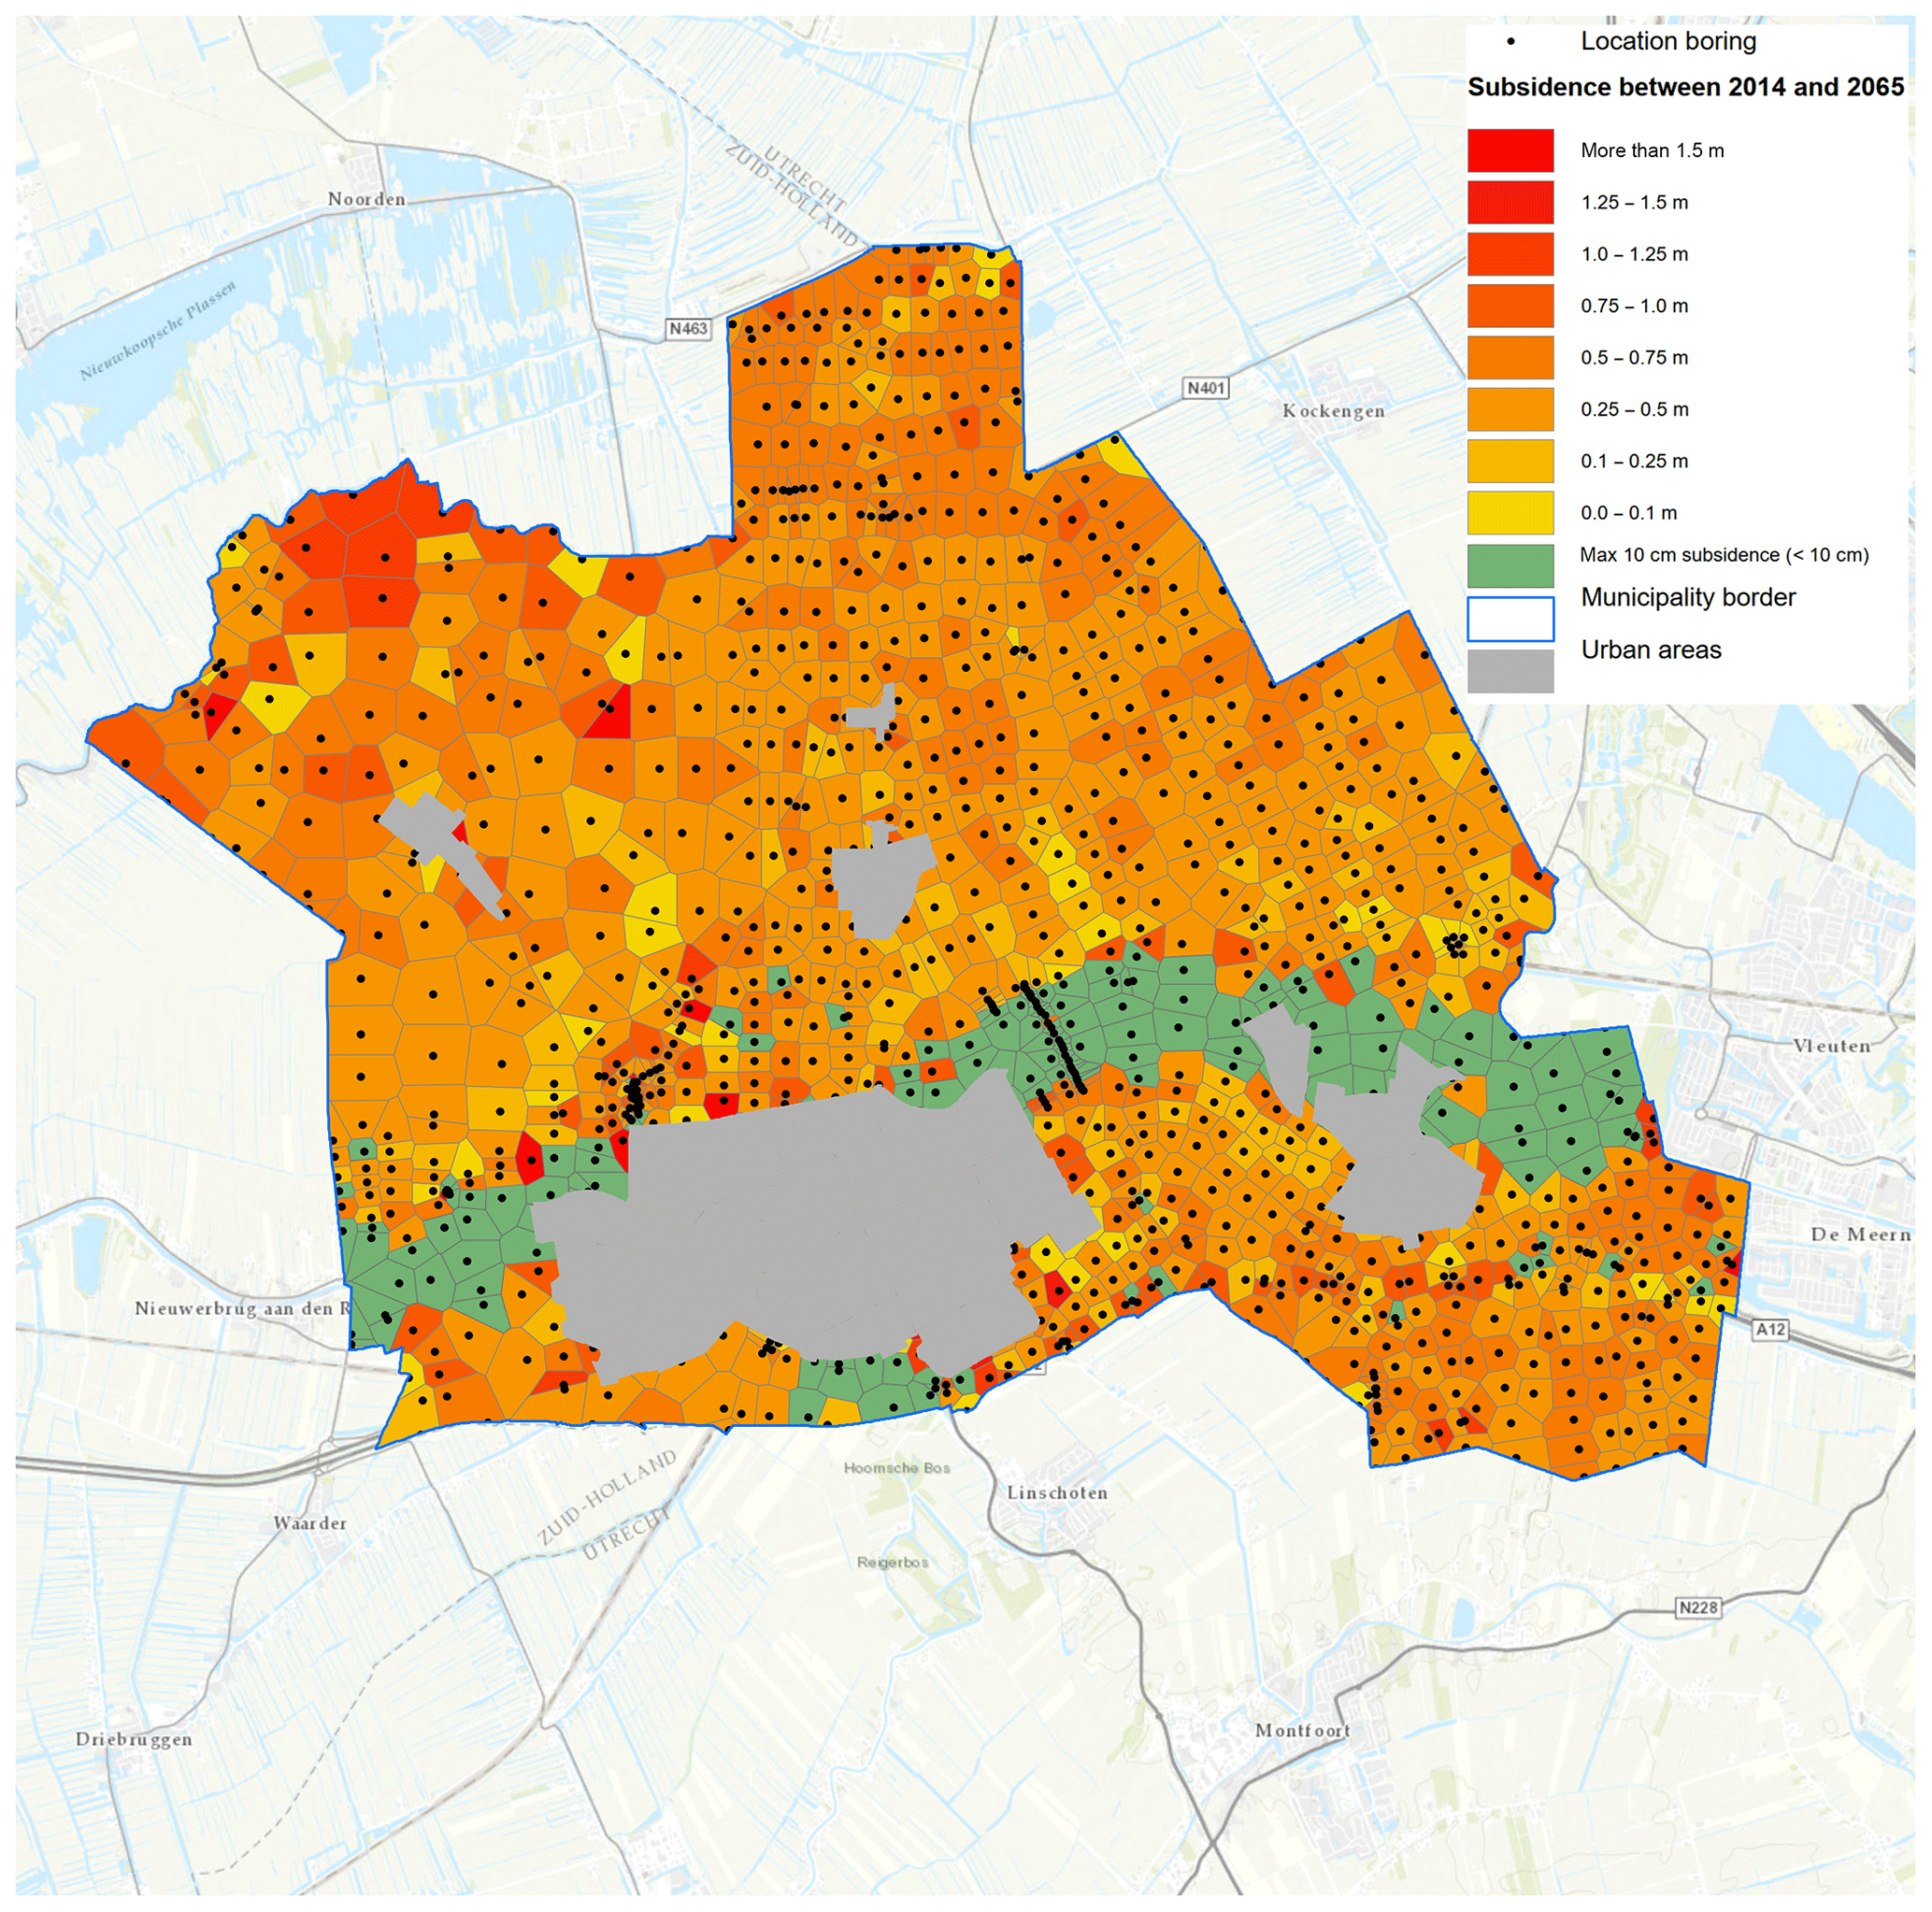
Figure 2Visualisation of the calculation results using all available borings and the modified Phoenix model. Background: Esri Nederland & community maps contributors©.
2.6 Summary
The autonomous subsidence is caused by creep, oxidation and shrinkage of peat, ageing of clay and the tectonics and isostasy. The consolidation processes which are also caused by the lowering of the water table are included in the analysis of the autonomous subsidence in this paper.
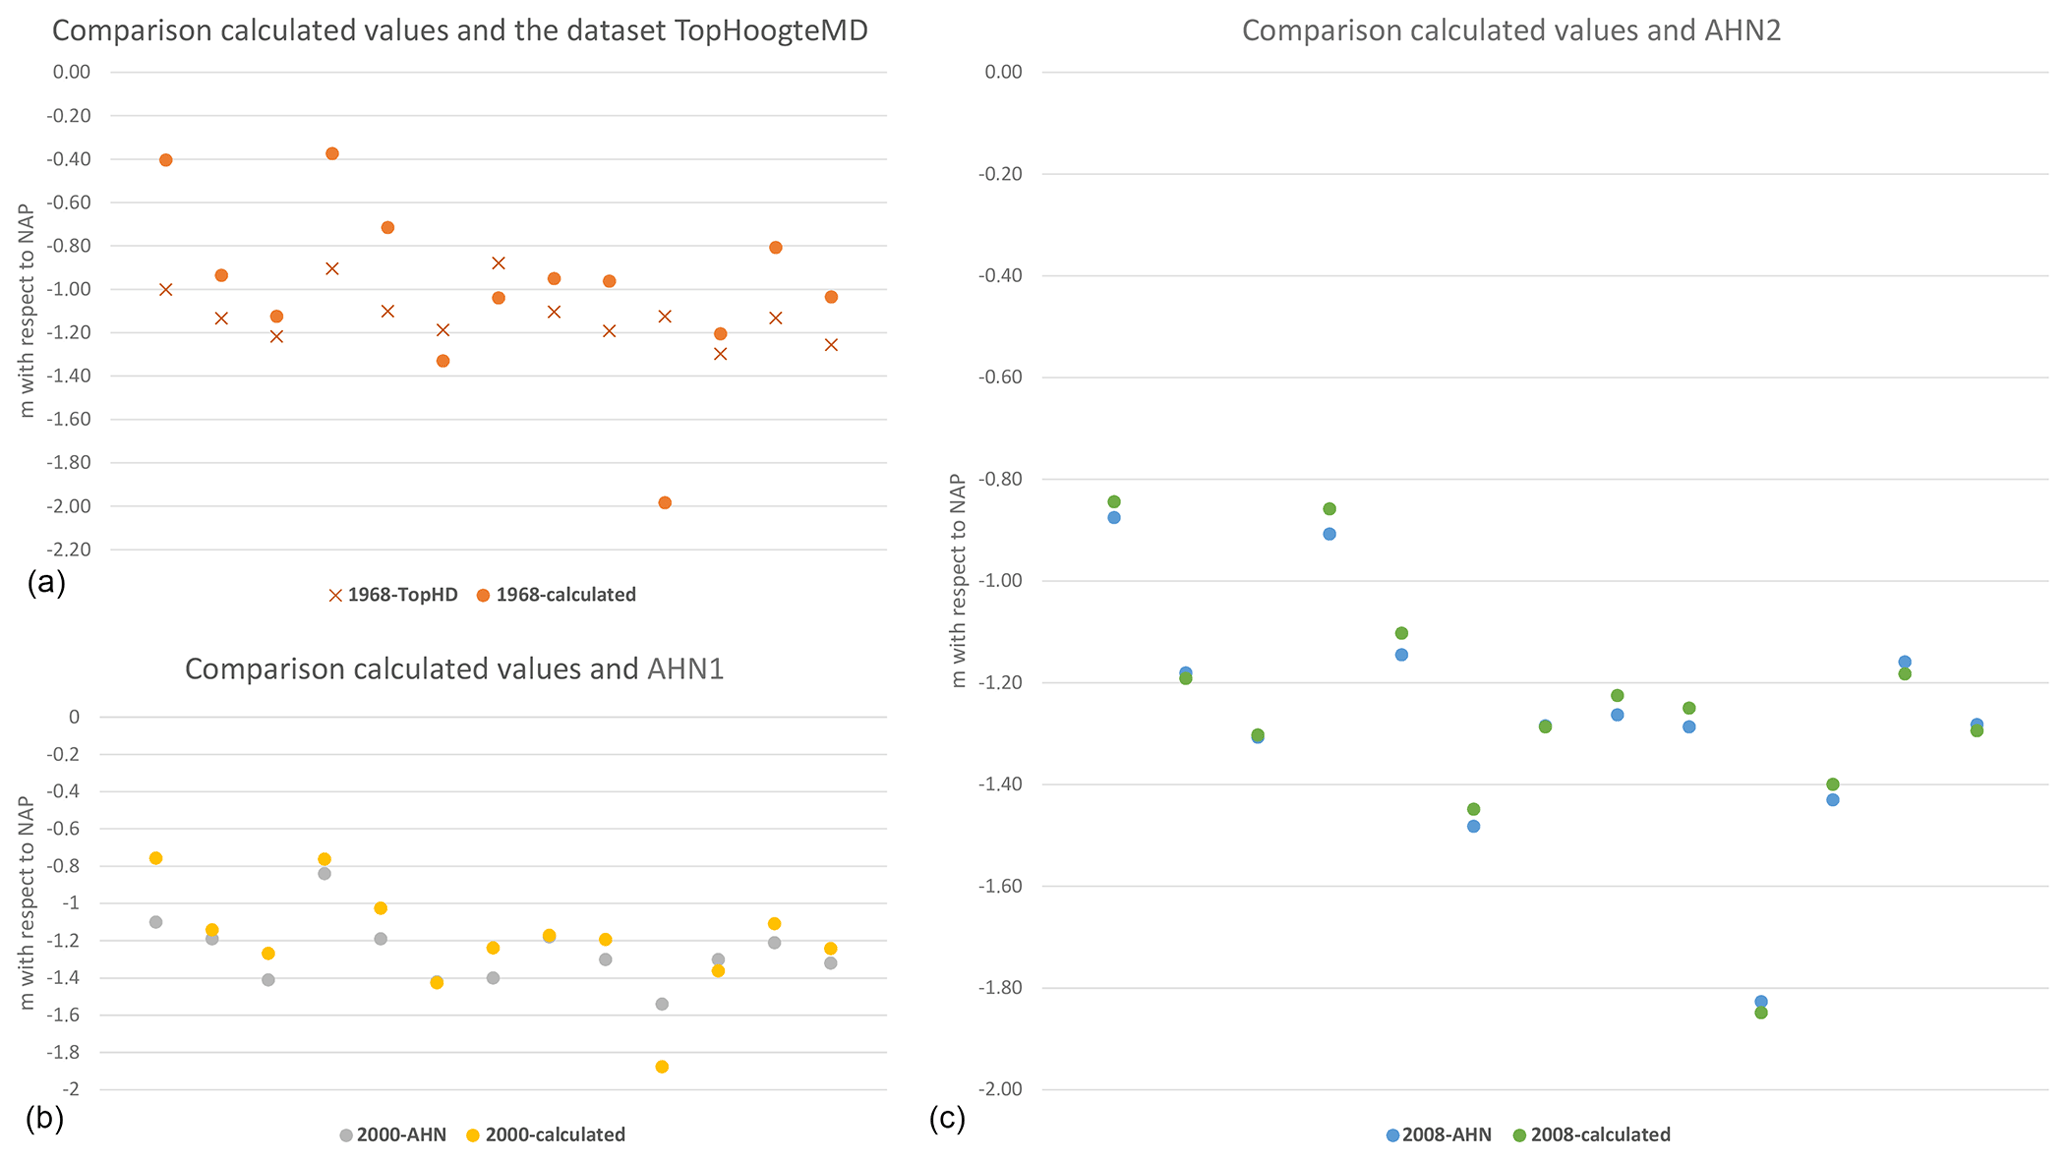
Figure 3Deviation of the model from measured surface levels with Tophoogte (a), AHN1 (b) and AHN 2 (c).
3.1 General
Different mechanisms of subsidence play a dominating role in the rural areas. In the rural areas in the municipality of Woerden the oxidation of organic material and the primary consolidation (due to lowering of the water table) are the main driving forces of the autonomous subsidence. In the following paragraphs the different mechanisms for the rural areas will be discussed.
3.2 Shrinkage, oxidation, creep and consolidation
Shrinkage is mainly a seasonal process. During the winter the peat will be completely saturated due to a surplus of precipitation compared to the evaporation of water. During this saturation a part of the volume decrease due to shrinkage will be reversed (like elastic behaviour). Unfortunately a part of the deformations of the peat are plastic and are therefore irreversible.
Oxidation is logically also a seasonal process as in summer the peat is much dryer and more subjected to air. According to Stouthamer et al. (2008) and Van Asselen et al. (2018) the contribution to autonomous subsidence of oxidation of organic matter is up to approximately 60 %.
The contribution of shrinkage to the subsidence is unfortunately difficult to separate from other processes like creep (Van Essen et al., 2011). According to Stouthamer et al. (2008) the contribution of shrinkage and creep to the subsidence in The Netherlands is on average between 15 % to 20 %. At the moment there are no numerical formulas available for the assessment of shrinkage.
To assess the amount of consolidation some calculations were made using the historic levels of the water table and the historic surface levels. These calculations showed that up to 27 % of the subsidence is caused by consolidation. These values of contributions can be expected in the western parts of the Netherlands (Van Asselen et al., 2018).
3.3 Ageing of clay
In the rural areas of Woerden thicker clay layers can be found at some locations but in a large extent the subsoil mainly consists of peat. As the contribution of the processes in the peat layers is by far greater than the contributions of the processes in the clay layers, the contribution of the ageing of clay is negligible and therefore not taken into account for the rural areas.

Figure 4Visualisation of measurement points and trends. Includes material ©2019 SkyGeo Netherlands BV. All rights reserved.
3.4 The model
For the rural areas the subsidence will be calculated using empirical formulas. An empirical formula (Eq. 1) is called “Phoenix” and is based on Van den Akker et al. (2007) using test locations in Zegveld, a village in the municipality of Woerden. At this location both the subsidence and the changes in the water table are recorded. This means that in this empirical formula all different mechanisms discussed in Sect. 3.2 are lumped into one. This formula can be applied on any boring that are found in rural areas.
where ΔM is the subsidence in m yr−1, MLG being the mean low groundwater level in m relative to surface level, K being the thickness in m of the clay cover over the peat layer and a, b and c being constants.
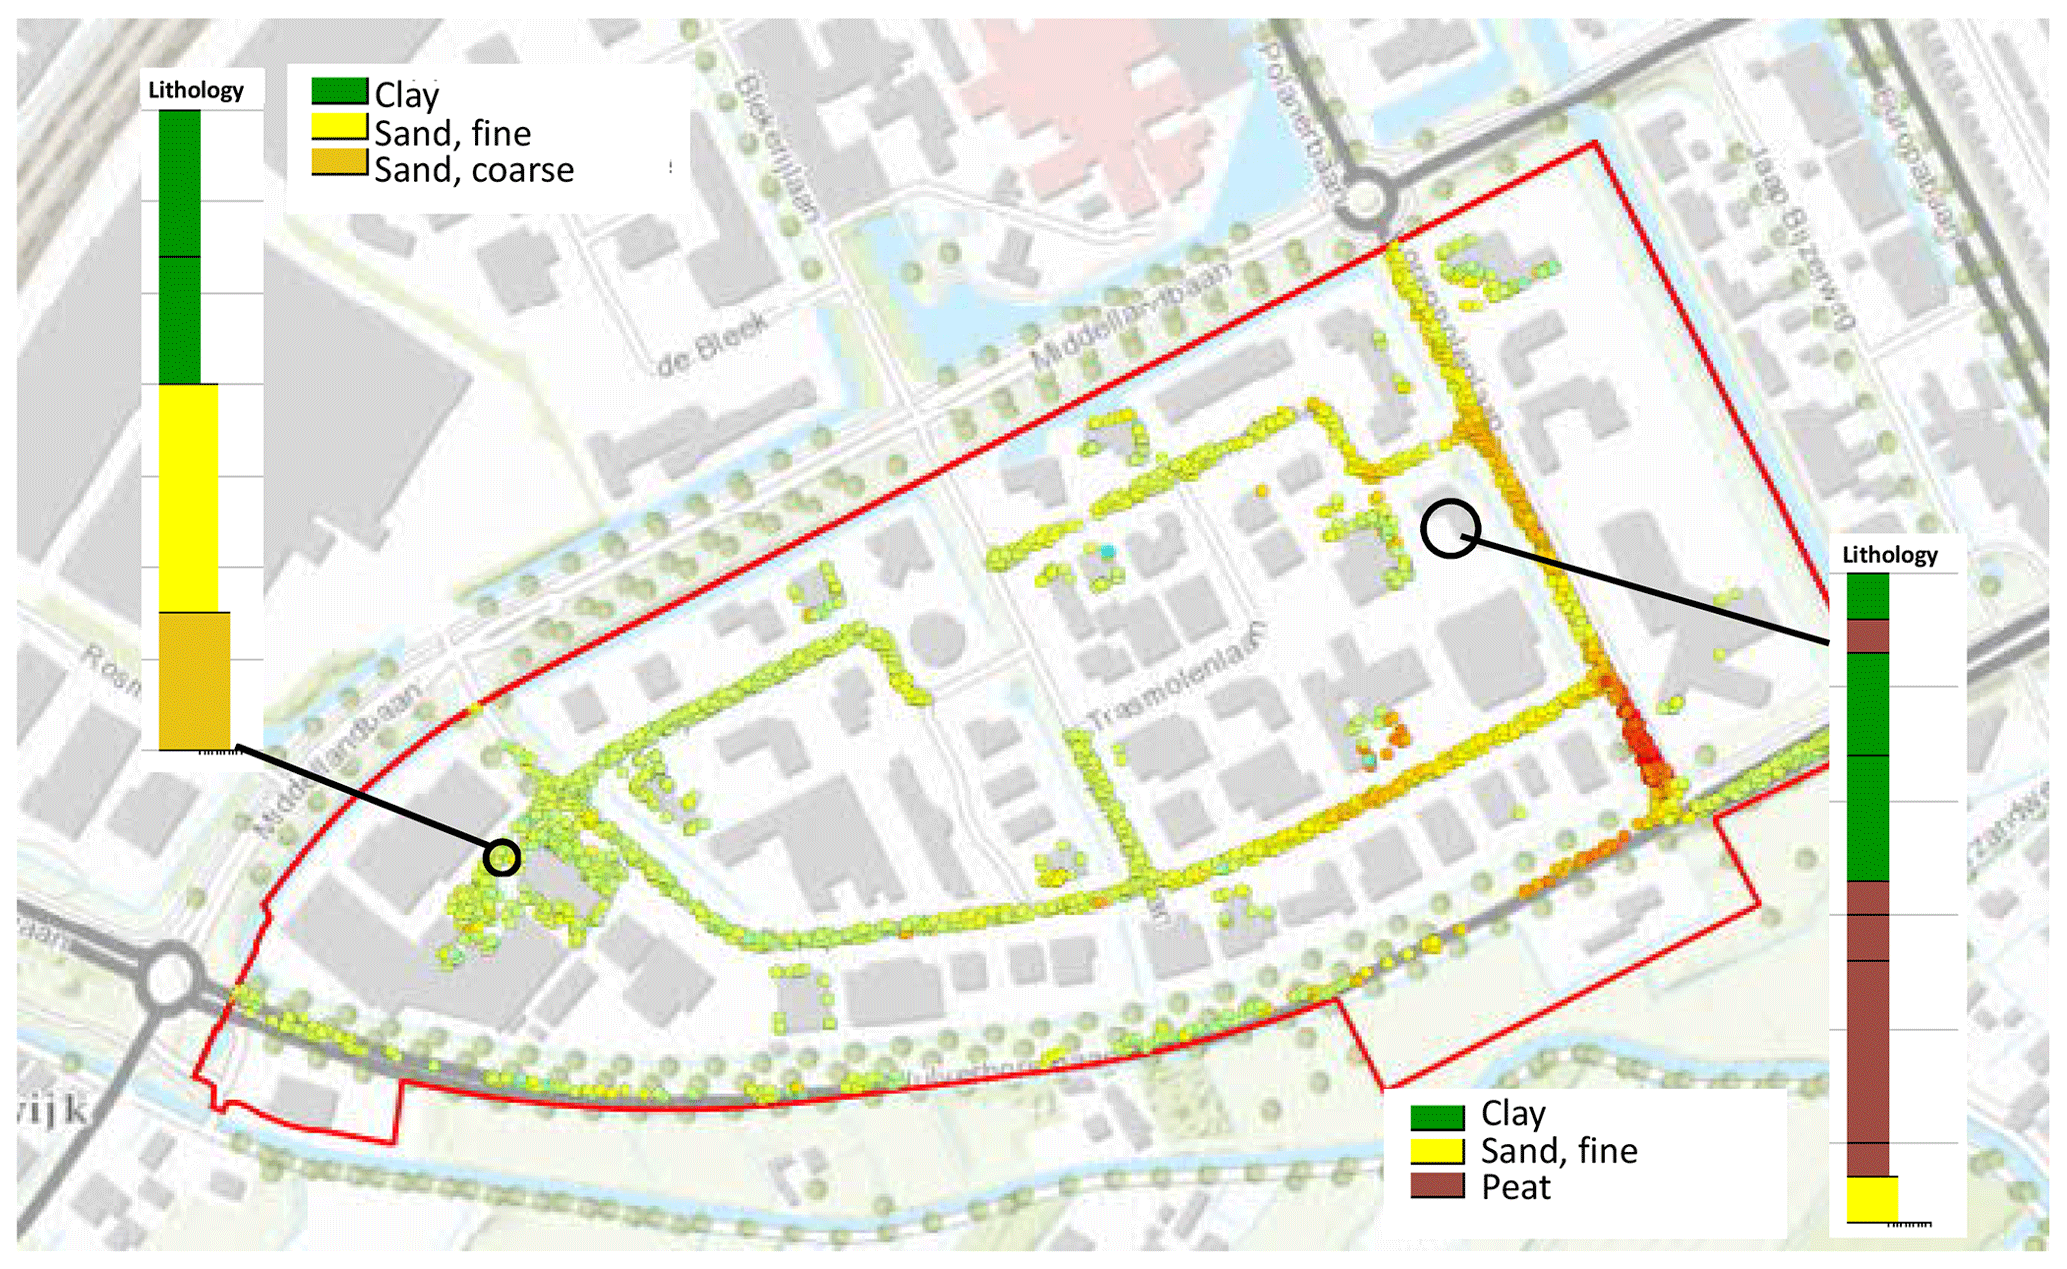
Figure 5Difference of autonomous subsidence due to the different soil stratigraphy. For the meaning of the colours of the pixels see Fig. 4. Includes material ©2019 SkyGeo Netherlands BV. All rights reserved.
Other research shows that the change of the groundwater level between the canals is less than the change of water level in the canals of the polder (Wind, 1986). The change of the groundwater level is taken into account using Eq. (2). In this equation the adjustment of the water level over time depends on the subsidence.
where ΔM−ΔP is the change in the depth of the water table relative to the surface level and W being a factor which is 1 when the groundwater level follows the subsidence. When W is lower than one, the groundwater will rise over time. In this case W=75 % as the municipality wants to reduce the rate of autonomous subsidence. A consequence of this decision is that the meadows will become wetter and therefore the use of the meadows will need to change.
In Geisler (2015) a recommendation has been done to enhance the Phoenix-model, as can be seen in Eq. (3).
where S is the surface level in m.
3.5 Results
By using the Phoenix model and GIS it is possible to create a map which shows the amount of autonomous subsidence for each boring. This map is shown in Fig. 2.
The results of the model are verified by calculating the surface levels back to the 1960s. As surface levels were recorded in the past (Tophoogte, AHN1, 2 and 3) it is possible to compare the surface levels from the model to the height of the surface in 1967 (Tophoogte), 2000 (AHN1), 2008 (AHN2) and 2014 (AHN3). The comparison is shown in Fig. 3.
As the figure shows, the deviation of the model from the measured values of the surface level is never greater than the measurement errors of the measured values. The results of the model are therefore reliable for this area.
4.1 General
In the urban areas of the city of Woerden the processes of autonomous subsidence are quite different from the rural areas. The water levels in the canals in the municipality are kept constant and therefore the groundwater table is also maintained at a constant level (within a certain bandwidth). This results in no increase in effective stresses in the urban areas.
Only locations where no maintenance of the road has taken place in the last 15 years were taken into consideration for this project. This amount of time has been chosen to make sure that primary consolidation does not contaminates the calculations as the goal of the analysis is to assess the autonomous subsidence.
4.2 Ageing of clay and creep
Due to the fact that peat, if present, is always fully saturated, both oxidation or shrinkage does not take place in the urban areas. Therefore the only mechanisms taken into account for the weak layers are the ageing of clay, as they are Holocene, and creep.
Unfortunately there are no scientific or empirical formulas which describes the ageing of clay. There are formulas to calculate the amount of creep but as the parameters and stress-histories of the clays are not well known and due to natural variation in the layers, the results of the analysis will not give a good match with reality.
4.3 Methodology
To assess the autonomous subsidence in the urban areas satellite data was used. The data consists of change in height for certain points in the period November 2013 to June 2017 obtained by the TerraSAR-X satellite. In Fig. 4 the measurement data from some points are shown. These points are generated by using both descending as ascending measurements. The blue points in the graphs represent the measured data, the black lines give an average over the year, which clearly shows the seasonal fluctuation, and the red line shows the trend through the years.
As the satellite data requires reflection points and constant surfaces, the satellite data has a poor quality in rural areas and high quality in urban areas.
As can be seen in Fig. 4. there are many measurement points on houses due to high reflection and low amount of noise. The data from these points is filtered out because the buildings have a pile foundation and therefore the data cannot be used for the determination of the mechanisms of autonomous subsidence in the shallow clay layers.
Garden design and layout are subjected to change over time so gardens were also filtered out. As stated earlier also roads maintained in the last 15 years were filtered out of the data. Therefore, only roads that were not maintained in the last 15 years are used to assess the autonomous subsidence.
4.4 Results
The satellite data shows a variation in autonomous subsidence between 0 and ±10 mm yr−1. The largest part of Woerden has shallow clay layers with a maximum of 3 m thickness. In these areas the autonomous subsidence has been determined to range between 0 to 4 mm yr−1. The amount of autonomous subsidence does not only depend on the thickness of the clay layer but also on the stress-history, composition of the clay layer and the time of urbanization.
Figure 5 shows the increase of the deformations, and therefore the autonomous subsidence, from left to right. The available lithological investigations show that the clay layer in the left of the figure is 3 m thick while on the right of the figure clay and peat layers were found up to a thickness of 5.5 m. The autonomous subsidence ranges, from left to right in Fig. 5, from approximately 2 to 10 mm yr−1.
The present contribution shows that the dominant mechanisms in the rural and urban areas of Woerden are very different.
In the rural areas the oxidation of peat and consolidation due to the lowering of the water table are the main contributors to the autonomous subsidence. The modified “Phoenix” model shows that the most polders subside at 5 to 6 mm yr−1.
For the urban areas especially the ageing of clay and creep are responsible for the autonomous subsidence. Because there are no calculation models available for the assessment of these mechanisms, PSI data was used to assess the rate of autonomous subsidence. In the larger part of the city the clay/peat layers are up to 3 m thick. The expected autonomous subsidence for the largest part of Woerden ranges from 0 to 4 mm yr−1 with some exceptions which are subsiding up to 10 mm yr−1.
The data used in this paper are available upon request by SkyGeo B.V.
The author declares that there is no conflict of interest.
This article is part of the special issue “TISOLS: the Tenth International Symposium On Land Subsidence – living with subsidence”. It is a result of the Tenth International Symposium on Land Subsidence, Delft, the Netherlands, 17–21 May 2021.
I would like to thank the City of Woerden and SkyGeo B.V. for providing the case and data needed. I also thank Jaap de Wit and Marc Everaars for their support and comments on the paper.
Geisler, L.: Improving the land subsidence model Phoenix, MSc thesis, University of Utrecht, Hoogheemraadschap De Stichtse Rijnlanden, the Netherlands, 19–25, 2015.
Stouthamer, E., Berendsen, H. J. A., Peeters, J., and Bouman, M. T. I. J.: Toelichting bodemkaart veengebieden provincie Utrecht, De Provincie Utrecht, the Netherlands, 53–56, 2008.
Van Asselen, S., Erkens, G., Stouthamer, E., Woolderink, H. A. G., Geeraert, R. E. E., and Hefting, M. M.: The relative contribution of peat compaction and oxidation to subsidence in built-up areas in the Rhine-Meuse delta, The Netherlands, Sci. Total Environ., 636, 177–191, 2018.
Van Essen, E. A., van Berkum, J., and Roelandse, A.: Evaluatie effecten proeven met hogere zomerpeilen, Aequator groen & ruimte B.V., Dronten, the Netherlands, 18–19, 2011.
Wind, G. P.: Slootpeilverlaging en grondwaterstanden in het veenweidegebied, Cultuurtechnisch tijdschrift 25, the Netherlands, 321–330, 1986.