the Creative Commons Attribution 4.0 License.
the Creative Commons Attribution 4.0 License.
 | 22 Apr 2020
Modeling of land subsidence caused by groundwater withdrawal in Konya Closed Basin, Turkey
Ahmed Wedam Ahmed
Ekrem Kalkan
Artur Guzy
Mine Alacali
Land subsidence is a threat that occurs worldwide as a result of the withdrawal of fluid and also underground mining. The subsidence is mainly due to excessive groundwater withdrawal from certain types of rocks, such as fine-grained sediments. Mitigating the effects of land subsidence generally requires careful observations of the temporal change in groundwater level and ideally modeling of groundwater flow and subsidence. In Turkey, land subsidence is a crucial issue in the Konya Closed Basin. When simulating the effect of long-term groundwater withdrawal on the spatial variation of subsidence rates, various coupled numerical groundwater-flow and subsidence models have been used. Also, GPS, InSAR and ENVISAT SAR images have been used for verification of the models' parameters. In the work reported here, a novel numerical solution based on consolidation theory was developed in MATLAB to predict the land subsidence of the Konya Closed Basin. In order to adjust the model to the local conditions, historical data from the study area for the years 2011–2014 were used. The presented solution allowed for subsidence model development which can support the prediction of the ground movement for the Konya Closed Basin in Turkey.
- Article
(1789 KB) - Full-text XML
- BibTeX
- EndNote


Land subsidence occurs when groundwater has been withdrawn from certain types of rocks such as fine-grained sediments. The rock compacts due to the pressure decrease in the aquifer strata. Eliminating the adverse effects of land subsidence requires observations of the temporal change in elevation coupled with groundwater flow modeling (Özyurt et al., 2018). In the areas where excessive groundwater is withdrawn from susceptible aquifer systems, land subsidence induced by aquifer-system compaction is typically observed, resulting in severe socio-economic damage for the affected communities. Generally, it is the lowered groundwater levels caused by groundwater pumping that cause land subsidence in compressible aquifer systems. Such systems typically are made up of basin-fill and unconsolidated alluvial layers that include both aquifers and aquitards (Galloway and Burbey, 2011). Either slow or sudden, the motion of the ground due to subsidence is a hazard that threatens civil and environmental resources. Present and potential future hazards have been assessed by models that are based on basic relations between groundwater levels or aquifer hydraulic head, effective or intergranular stress, the compressibility of groundwater and the aquifer skeleton, and groundwater flow (Özyurt et al., 2018). These models use two different approaches: the first is based on groundwater flow theory (Jacob, 1940) and, secondly, the theory of linear poroelasticity (Biot, 1941). Various models implementing, e.g., the De Glee method and software programs like IMOD have been used to simulate land subsidence (Guzy et al., 2018). Land subsidence is a consequence of the over-exploitation of groundwater resources from susceptible aquifer systems. According to an assessment, measured subsidence rates in different locations in the world range from 6 mm yr−1 in Kolkata, India, between 1992 and 1998 to 300 mm yr−1 in Mexico City, Mexico, between 2004 and 2006 (Osmanoğlu et al., 2011). And among 18 selected sites distributed globally the mean and median subsidence rate is 100 and 55 mm yr−1, respectively (Özyurt et al., 2018).
In Turkey, land subsidence is prominent in the Konya Plain. The MODFLOW numerical groundwater flow model coupled with the subsidence (SUB) package (Hoffman et al., 2003) has been used to simulate the effect of long-term groundwater abstraction on the spatial variation of subsidence rates (Özyurt et al., 2018). Also, Caló et al. (2017) used the Small BAseline Subset DInSAR technique to process two datasets of ENVISAT SAR images spanning from the 2002–2010 period. The produced ground deformation maps and associated time series allowed the detection of widespread land subsidence extending for about 1200 km2 and measured vertical displacements of as much as 10 cm in the observed time interval. This area, which is under strong anthropogenic pressures and is confronted with serious water-related problems, is widely affected by land subsidence (Caló et al., 2017). For that reason, approaches have been taken to investigate this fragile environment of the Konya Plain, located in central Turkey to help understand and predict the occurrence of land subsidence in order to quickly remediate it (Özyurt et al., 2018). Groundwater levels in the Konya Closed Basin have been declining at a rate of about 1 m yr−1 since the early 1980s. Recent GPS observations reveal subsidence rates of 22 mm yr−1 over the southern part of the Konya Closed Basin (KCB). The MODFLOW numerical groundwater flow model coupled with the SUB package was used to simulate the effect of long-term groundwater abstraction on the spatial variation of subsidence rates (Özyurt et al., 2018). This research reported here seeks to use MATLAB software to model and predict the land subsidence of the KCB. MATLAB predictive analytics uses historical data to predict future events. Typically, historical data are used to build a mathematical model that captures important trends. That predictive model is then used on current data to predict what will happen next or to suggest actions to take for optimal outcomes. Predictive analytics has received a lot of attention in recent years due to advances in supporting technology, particularly in the areas of big data and machine learning.
KCB is located in the central part of Turkey between 36∘51′ N and 39∘29′ N and 31∘36′ E and 34∘52′ E. It is recognized for its agricultural and industrial productivity as well as its geomorphological and hydrogeological characteristics (Üstün et al., 2013). The KCB, which encompasses a 55 000 km2 area of the Anatolian peninsula, is the biggest closed basin of Turkey involving Konya, Karaman, Nigde and Aksaray provinces (Canaslan Comut et al., 2015). The Taurus Mountains enclose the basin from the south and southwest (Üstün et al., 2015). Because the mountains around the KCB prevent water from reaching the Mediterranean Sea from the basin, it is a closed basin with unique characteristics (Üstün et al., 2014). The elevations vary from 850 to 1000 m over the flat plains and rise to 3900 m on the Taurus Mountains. From a morphological point of view, the KCB is an orogenic plateau located to the north of the Taurus Mountains Belt extending along the eastern Mediterranean Sea. The plains of the southern and northern subbasins are located roughly at 1100 and 950 m, respectively. The elevation along the water divide between the two subbasins declines from about 2200 m in the Taurus Mountains to about 1100 m in the most northern part (Özyurt et al., 2018). The amount of water used for agricultural irrigation can be as much as 70 % of the water use for the whole country. The basin has a significant groundwater-resource potential, but because of small amounts of annual rainfall in normal years, susceptibility to drought, and overuse of the groundwater resource, groundwater levels are decreasing (Canaslan Comut et al., 2015). According to the records of the Turkish State Meteorological Service, the average annual rainfall in the KCB is 287 mm (Yavuz, 2010). Due to the overuse of groundwater, subsidence occurs in the area surrounding the city of Konya (a current problem) and also in the southwestern part of the basin (Canaslan Comut et al., 2015). A simplified scheme of the hydrogeological system includes a confined Neogene aquifer and the low-permeability Plio-Quaternary lake sediments on top. The Neogene aquifer includes lacustrine carbonates in which extreme secondary porosity and permeability develop due to karstification and low-permeability interbeds rich in clay and silt. Groundwater obtained from the Neogene aquifer is the principal source of water in the Konya subbasin, where extensive agricultural production has been carried out since the 1970s. Because annual groundwater abstraction is about 2 times the annual natural recharge, regional groundwater levels have declined at a rate of about 1 m yr−1 since the 1980s. The land subsidence accompanying groundwater over-exploitation is mostly subtle, but sudden collapses have also occurred with an increasing annual frequency during the last decade(s). The meter/decameter-sized collapse structures threaten life and property (Fig. 1) (Canaslan Comut et al., 2015).

The research methodology consisted of eight stages (Fig. 2).
The aim of the first three stages was to calculate land subsidence for years 2011, 2012, 2013 and 2014 at particular test sites. For that purpose, Terzaghi's law of soil consolidation was used as shown in Eq. (1) (Terzaghi et al., 1967):
where S is land subsidence; Δe is change in initial void ratio; ei is initial void ratio; and D is thickness of the aquifer.
The changes in void ratio and initial void ratio, Δe and ei, respectively, were determined during laboratory tests for 42 wells distributed in the study area and obtained from Ali Ferat Bayram of Konya Technical University, Faculty of Engineering and Natural Sciences. However, due to the lack of full recognition of geological conditions in the research area, it was assumed that the entire aquifer is compressed. Therefore, D was assumed to be 650 m (Özyurt et al., 2018).
In the fourth stage of the research, previously calculated values of land subsidence for the years 2011–2014 were used in predicting its future occurrence. Therefore, a model for the known period under review was developed using Eq. (2) (Koopejan, 1948):
where Cp and Cs are consolidation constants; t is time; pi is initial pressure; and Δpi is change in pore pressure.
Because values for Δe and ei were available in the data acquired for the study area, a relationship between pi and Δpi (Eq. 2) and ei and Δe was used to formulate Eq. (3):
where Cc is the compression index.

Having developed the equation for subsidence as a function of time in the fifth stage of the research, the minimum and maximum subsidence values calculated for 42 wells for the period 2011–2014 were used in developing two simultaneous equations. This was done to determine Cp and Cs. However, Cc could be determined using Eq. (4) or (5) (Habibbeygi et al., 2017):
For this research purpose, ei values of the corresponding minimum and maximum subsidence values were used in both Eqs. (4) and (5). Therefore, four values of Cc were computed. After Cc was determined, Cp and Cs were then determined based on Eq. (3). These calculations were carried out using sets of equations with geotechnical properties associated with minimum subsidence for one equation and those properties associated with maximum subsidence for the other equation as determined based on Eqs. (4) and (5). Finally, with t expressed in days, a subsidence prediction for a period of 30 years was carried out based on Eq. (3). In the prediction, values obtained for the forecasted land subsidence were not realistic. For that reason, further research highlighted calculations on consolidation constants. In research by De Glopper and Ritzema (2006), the direct effect stands for the subsidence that occurs the first day after the load increase and is based on the assumption that Cp and Cs are independent of the size of the load, but where Cp depends on the selected time period (1 d). The secular effect stands for that part of the subsidence that occurs as the excess water is drained out of the aquifer-system material. This is a very slow process, especially in clays, because of their low hydraulic conductivity. The secular effect will cause the subsidence to continue indefinitely. Therefore, using Cp =1 and applying both equations of Cc (Eqs. 4 and 5), as well as in the simultaneous equations of minimum and maximum subsidence as a function of time, Cs =0.292 and Cs =0.471 were computed based on the minimum subsidence obtained for both equations of Cc. Also, Cs =0.3347 and Cs =0.5301 were computed based on the maximum subsidence obtained for both equations of Cc. After all parameters in the subsidence as a function of the time equation were known, subsidence values were then predicted using the individual geotechnical parameters over a period of 30 years with reference to the years under review.
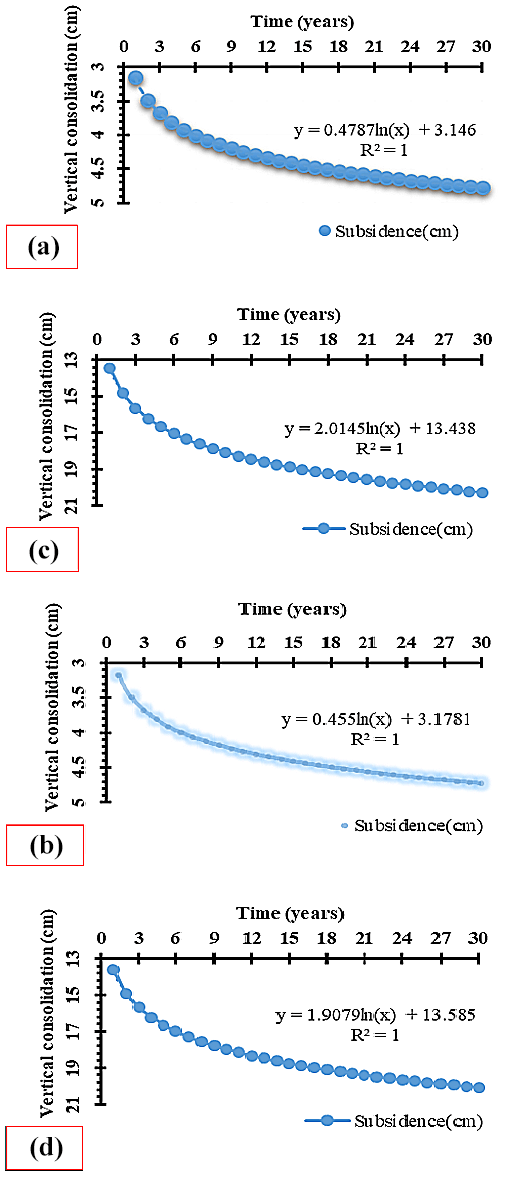
From the MATLAB model for estimating the vertical consolidation which is the predicted subsidence, both Eqs. (4) and (5) for the compression index Cc were applied, and the results obtained from both equations as shown in Fig. 3 had no significant difference between the two compression indexes used. This was confirmed from the dependent t-test on the minimum and maximum subsidences using both equations of Cc. The p values of the minimum and maximum subsidences in all cases were 0.4 (> 0.05) and as such indicated no significant difference between the two equations of Cc used. The minimum and maximum subsidences to be observed were plotted and a general regression analysis was done. Linear regression, exponential regression, logarithmic regression, polynomial regression, and power regression were used. Logarithmic regressions resulted in R2 values of 1 in both cases of Cc for minimum and maximum subsidences, whereas the other regression analyses had R2 values less than 1. Therefore, in calculating the minimum level of subsidence, the model generated for a logarithmic regression was either Eq. (6) using Eq. (4) as shown in Fig. 3a or Eq. (7) using Eq. (5) as shown in Fig. 3b.
In calculating the maximum level of subsidence, the model generated for a logarithmic regression was either Eq. (8) using Eq. (4) as shown in Fig. 3c or Eq. (9) using Eq. (5) as shown in Fig. 3d.
The subsidence results obtained were compared with related land subsidence from previous research (Üstün et al., 2013, 2015) for the period 2011–2014. In that regard, land subsidence results were in the range of 0.2–4.0 cm yr−1 using GPS and 1.0–4.0 cm yr−1 using InSAR data analysis. Thus, the maximum subsidence can be assumed to be the maximum range for the 4 years (2011–2014), which is 16.0 cm. Moreover, data from ENVISAT ASAR images with ENVISAT ASAR data between 2003 and 2010 above the city center, compared with GPS measurements, estimated the deformation rate of KCKY GPS station to be approximately 2.0 cm yr−1 (Canaslan Comut et al., 2015). Also, considering the 8-year period of that study gives a maximum vertical deformation or consolidation of 16.0 cm. The above values are confirmed in this research with the use of Terzaghi's 1D consolidation equation and the aid of the MATLAB model which predict land subsidence ranging from 3.8 to 16.2 cm. This was analyzed for the same period of 4 years, which results in a subsidence rate in the range of 1.0 to 4.1 cm yr−1 approximately in conformity with past research of 1.0 to 4.0 cm yr−1.
The research focused on Terzaghi soil consolidation theory and subsidence as a function of time with MATLAB analysis. With the subsidence, compression index and consolidation constants predicted, for the study area, the value for minimum subsidence or vertical deformation 30 years after the year 2011 is predicted to be approximately 5.0 cm, whereas the maximum land subsidence is predicted to be 20.0 cm assuming the groundwater withdrawal is the same as the rate of water recharge into the aquifer. However, it is highly recommended that further accurate data concerning porosity, moisture content, compression index and effective stress of the field be obtained for more accurate subsidence results for a 3D consideration.
Finally, yet importantly, consolidation constants should also be measured and identified from the laboratory. Results can then be used to predict the trend of land subsidence with a given lifespan of the study area.
All data concerning the studied area were available thanks to Ali Ferat Bayram of Konya Technical University, Faculty of Engineering and Natural Sciences. These data are not publicly available to all users due to Konya Technical University data policy restrictions.
The conceptualization, data curation, investigation, and methodology were the responsibility of AWA, EK, and MA; the software was from AWA; supervision was by AG and AM; writing of the original draft was done by AWA; writing, review, and editing were done by AG and AM.
The authors declare that they have no conflict of interest.
This article is part of the special issue “TISOLS: the Tenth International Symposium On Land Subsidence – living with subsidence”. It is a result of the Tenth International Symposium on Land Subsidence, Delft, the Netherlands, 17–21 May 2021.
Biot, M. A.: General theory of three-dimensional consolidation, J. Appl. Phys., 12, 155–164, 1941.
Caló, F., Notti, D., Galve, J., Abdikan, S., Görüm, T., Pepe, A., and Balik Şanli, F.: DInSAR-Based Detection of Land Subsidence and Correlation with Groundwater Depletion in Konya Plain, Turkey, Remote Sens., 9, 83, https://doi.org/10.3390/rs9010083, 2017.
Canaslan Comut, F., Lazecky, M., Ustun, A., and Yalvack, S.: Land Subsidence Detection in Agricultural Areas of Konya Closed Basin by PS-InSAR and GNSS Observations, FRINGE Workshop, Frascati, Italy, 23–27 March 2015.
De Glopper, R. J. and Ritzema, H. P.: Land subsidence, in: Drainage Principles and Applications, edited by: Ritzema, H. P., International Institute for Land Reclamation and Improvement, Wageningen, the Netherlands, 477–512, 2006.
Galloway, D. and Burbey, T. J.: Review: Regional land subsidence accompanying groundwater extraction, Hydrogeol. J., 19, 1459–1486, 2011.
Guzy, A., Ahmed, A. W., and Malinowska, A.: Spatio-Temporal Distribution of Land Subsidence and Water Drop Caused by Underground Exploitation of Mineral Resources, International Multidisciplinary Scientific GeoConference: SGEM, Vienna, Austria, 3–6 December 2018.
Habibbeygi, F., Nikraz, H., and Verheyde, F.: Determination of the compression index of reconstituted clays using intrinsic concept and normalized void ratio, International Journal of GEOMATE, 13, 54–60, 2017.
Hoffman, J., Leake, S. A., Galloway, D. L., and Wilson, A. M.: MODFLOW-2000 Ground-Water Model – User Guide to the Subsidence and Aquifer-System Compaction (SUB) Package, U.S. Geological Survey, Open File Rep., 44 pp., 2003.
Jacob, C. E.: Flow of Ground-Water, in: Engineering Hydraulics, edited by: Rouse, H., Proceedings of the Fourth Hydraulics Conference, Iowa Institute of Hydraulic Research, Iowa City, US, 1950.
Koppejan, A. W.: A formula combining the Terzaghi load compression relationship and the Buisman secular time effect, Proc. 2nd ICSMFE, Rotterdam, the Netherlands, 1948.
Osmanoğlu, B., Dixon, T. H., Wdowinski, S., Cabral-Cano, E., and Jiang, Y.: Mexico City subsidence observed with persistent scatterer InSAR, Int. J. Appl. Earth Obs., 13, 1–12, 2011.
Özyurt, N. N., Avcı, P., and Bayarı, C. S.: Using Groundwater Flow Modelling for Investigation of Land Subsidence in the Konya Closed Basin (Turkey), Handbook of Research on Trends and Digital Advances in Engineering Geology, 569–590, 2018.
Terzaghi, K., Peck, R. B., and Mesri, G.: Soil Mechanics in Engineering Practice, John Wiley & Sons. Inc., New York, US, 1967,
Üstün, A., Özkan, İ., Bildirici, İ. Ö., Tuşat, E., Üstüntaş, T., Eren, Y., and Özdemir, A.: Geodetic methods of soil subsidence in Konya closed basin and investigation of their causes, TÜBİTAK Proje No: 110Y121, 2014.
Üstün, A., Özkan, İ., Tuşat, E., Eren, Y., Bildirici, İ. Ö., Üstüntaş, T., and Özdemir, A.: Monitoring of the subsidence in Konya Closed Basin, TUBİTAK Araştırma Projesi, Ara Rapor, Konya, 110, 2013.
Üstün, A., Tuşat, E., Yalvaç, S., Özkan, İ., Eren, Y., Özdemir, A., Bildirici, İ. Ö., Üstüntaş, T., Kırtıloğlu, O. S., and Mesutoğlu, M.: Land subsidence in Konya Closed Basin and its spatio-temporal detection by GPS and DInSAR, Environ. Earth Sci., 73, 6691–6703, 2015.
Yavuz, S.: Analysis of hydrogeological parameters in Konya-Karapınar Basin, Master Thesis, Ataturk University, Turkey, 2010.