the Creative Commons Attribution 4.0 License.
the Creative Commons Attribution 4.0 License.
 | 22 Apr 2020
Determination of land subsidence value under permanent drainage conditions at the site of highway tunnel in Moscow
Aleksandr V. Anikeev
Olga N. Eremina
Irina V. Kozliakova
The paper discuses one of the most complicated cases in tunnel construction practice in the water-saturated fine-grained deposits in Moscow. Due to the imperfectness of enclosing engineering structures, groundwater and water-saturated soils broke through to the tunnel at the time of its construction. This resulted in the formation of decompaction zones in the enclosing ground massif as well as in deformation of buildings and land surface subsidence. After the end of construction, settling of land surface near tunnel has almost stopped; however, groundwater seepage to the tunnel still continues despite numerous percolation-control measures. As a result, the decision was made to arrange the permanently operating drainage, which could have sustain the groundwater level at the required depth. The possible settling of the land surface has been calculated for the area near the tunnel due to the soil compaction upon the water drawdown. The calculation is based on the principle of linear deformability of soils and on the Terzaghi law about the stresses of two kinds in a ground massif. The results obtained prove that the settlement values will not exceed the critical values adopted by standard regulatory documents. It appears virtually impossible to take account in calculations the transformation of ground massif parameters at the sites of soil breakthrough to the tunnel. Therefore, it is necessary to keep continuous observations over the deformation of buildings and the land subsidence in the tunnel zone. Monitoring and permanent drainage should ensure the safe operation of the tunnel.
- Article
(3918 KB) - Full-text XML
- BibTeX
- EndNote


A new 2 km-long highway tunnel was open for traffic in the northwest of Moscow in 2016. Included in a major transport interchange, it is named Alabyano-Baltic tunnel (ABT), as it connects Alabyan street and Baltic street.
Uneven land subsidence with deformation of buildings was registered around the tunnel during and after its construction. After the groundwater pumping during construction had been stopped, water seepage started into the inner subsurface engineering structures of the tunnel. These unfavorable natural-anthropogenic conditions are caused by imperfect protective waterproof coatings as well as by the changing state and properties of ground massif as a result of numerous cases of groundwater and water-saturated soil breakthrough into the tunnel during its driving.
To the time of traffic opened through the tunnel, surface deformations at the adjacent territory had stopped completely. However, despite the diverse filtration-control protective measures, water seepage still continues in the bottom, roof and walls of the operating tunnel. Under these circumstances, in order to stop the water inflow to the tunnel, arrangement of the permanent drainage appears to be most appropriate. However, many experts are afraid that water pumping may cause additional adverse changes in the technonatural environment around the tunnel. That is why the necessity arose to assess the influence of planned water drainage on land subsidence in the vicinity of the tunnel based on the present-day ideas in geomechanics.
The tunnel site and its surroundings of a total area of 20 km2 are located in the fluvioglacial plain in the northeast and at the third terrace above the Moscow River floodplain in the southwest (Osipov and Medvedev, 1997). The modern relief surface is rather gentle with the markedly pronounced sloping southwards towards the Moscow River channel. The territory topography is complicated by the valleys of the Moscow River tributaries, i.e., Khodynka, Zhabenka, and Tarakanovka rivers. The maximal elevations of the earth surface (169 m above sea level) are registered in the northern part of the territory; whereas the minimal elevation (148 m) are typical for the site of the Khodynka River channel, in the south. The tunnel route goes immediately along the Tarakanovka River channel, flowing in the collecting pipe now.
The oldest deposits drilled by the boreholes in the studied area are represented by limestone, clay and marl of Carboniferous age (Fig. 1). These deposits are registered at a depth of 40–50 m and deeper, being almost everywhere overlapped by the sandy-clayey Jurassic and Cretaceous deposits of 25–30 m thick. The thickness of Quaternary deposits is equal to 20–30 m. It is composed mainly of sand with locally spread lenses and discontinuous interlayers of sandy loam and loam. Technogenous soil covers the surface everywhere. Its maximal thickness (up to 6–8 m) is observed within the backfilled channels of minor rivers as well as highway and railroad embankments.

Groundwater aquifers are found in Carboniferous limestone, as well as Jurassic, Cretaceous and Quaternary sand. The lowermost Carboniferous aquifer is a confined one. It is covered by mid- and upper Jurassic clay of Callovian and Oxfordian stages at the top. Above-lying are the confined aquifer in sandy and sandy loamy interlayers in Jurassic clay stratum and predominantly unconfined groundwater complex in Jurassic, Cretaceous and Quaternary sands (the above-Jurassic water-bearing complex).
The Alabyan-Baltic tunnel is driven mainly in Quaternary sandy deposits and in the upper Jurassic sandy loam and loam in its deepest part. For the most part, it runs below the groundwater level. The tunnel was driven by the open-pit method, somewhere by the cut-and-cover technique. Independently of the cutting technique, reinforced concrete bored piles or cement piles serve as enclosing engineering structures. Walls of bored piles are the elements of the principal supporting structures at the stage of the facility operation; whereas the walls and the floor of the cement piles serve as the waterproof curtain that was intended to reinforce the enclosing rock massif and to eliminate the groundwater seepage to the construction pit and the inner structures of the tunnel.
The tunnel construction affected significantly the hydrodynamic regime of the above-Jurassic water-bearing complex both due to the uneven (in time and in space) water drainage during the construction works, and also because the enclosing engineering structures of the tunnel blocked nearly completely this aquifer at the 1000 m-long route segment. In 2010–2011, the depression cone exceeded 2 km in the width, and a decrease in the groundwater level reached 10 m. In the course of construction works, the shape and depth of depression funnel changed several times. In the end 2012, when the main construction works at ABT terminated, water pumping outside its contour was also almost stopped. Since then, the groundwater level started to restore.
In the course of construction of enclosing structures, numerous cases of breakthrough of groundwater and water-saturated soils into the tunnel happened. Geophysical survey registered decompaction zones near the tunnel. Considerable percolation heterogeneity of enclosing ground massif has been noted. In 2013, after groundwater pumping had terminated, water seepage to the inner structures of the tunnel started. In 2011 and 2015, the surface collapses near the tunnel happened. These facts proved that the application of “Jet-grouting” technology was insufficiently effective under these conditions, and the waterproof cement curtain surrounding the reinforced concrete walls and floor of the tunnel failed to protect them adequately. To stop water inflow to the tunnel, it was decided to arrange a permanent drainage at the territory adjacent to the tunnel. Possible subsidence of the surface caused by drainage was calculated.
At present, prediction of soil and rock massif compaction process and the land surface subsidence upon the decreasing groundwater level is usually based at the principle of linear deformability of soils and on the main law (principle) of subsurface hydrostatics (Gersevanov and Pol'shin, 1948; Kutepov and Sheko, 2002; Mahmutoğlu, 2011; Theoretical fundamentals of engineering geology, 1986; Land subsidence, 2005). The former consists in the following (Gersevanov and Pol'shin, 1948): upon insignificant variation of the external pressure (0.1–0.3 MPa, and up to 0.5–0.7 MPa for hard rock), the dependence between the total deformations and stress may be considered as a linear one (with the sufficient for practical tasks accuracy).
For compressive compaction, this principle is written in the form of the following equation (Tsytovich, 1967):
where ε stands for the relative vertical deformations; σ designates vertical stress; and arc is the coefficient of soil relative compressibility (Pa−1), equal to
Here, Eo is the total strain modulus; β is the coefficient depending on the relative transverse deformation of soils (similar to the Poisson's coefficient for elastic bodies). The physical essence of Eq. (2) becomes clear from Eq. (2a):
which shows that this coefficient stands for the relative subsidence si∕m of m-thick layer per the applied pressure unit pi.
Solving problem about the final subsidence s of the ground layer under the uniformly distributed load q is the simplest model of linearly deformed medium. For continuous loading q, deformations ε may be considered as linear to be based on the results of soil compressibility tests. Then, taking the compressibility coefficient ac constant in the course of deformation, we come up with (Mironenko and Shestakov, 1974):
where e0 is the initial coefficient of porosity. Note also that the compressibility coefficient correlates with the relative compressibility coefficient via formula (Tsytovich, 1979):
The second principle (the main law of subsurface hydrostatics, according to Mironenko and Shestakov, 1974; Terzaghi and Pek, 1967) says that in any point of the two-phase soil-water, the full pressure σΣ is equal to a sum of effective (σ) and neutral (p) stresses exerting an impact on the soil skeleton and pore water, respectively:
For σΣ=const
therefore, upon the constant external pressure and incompressible liquid phase, a decrease in the groundwater head by ΔH causes a decrease in the pore pressure by (where γw=10 kN m−3 is the bulk water weight). In this case, the effective stress will increase by the same value Δσ=γwΔH:
which will or may lead to the soil skeleton compression and land subsidence.
However, unlike the continuous evenly distributed load q, with the pressure diagram by the soil layer depth shows a rectangular shape (Fig. 2a), the compressive pressure produced by the volume forces γw rises with the depth according to the triangle rule (Fig. 2b). In this case, Eq. (3) for the compressible layer of drained soils of m=ΔH thickness is written as follows:
because the total additional force per 1 linear meter normal to the plane (Fig. 2) is evidently equal to 1∕2 of rectangular square with sides m and γwm: . Then, substituting expressions (2) and (6) to (3a) we come up finally with:
The equation for the final ground subsidence on water pumping usually contains effective stress represented as (Mironenko and Shestakov, 1974; Terzaghi and Pek, 1967; Theoretical fundamentals of engineering geology, 1986):
where γ is the bulk weight of water-saturated soil and γ′ is the weight of soil suspended in water. However, this value of additional stress does not contradict the above-listed equation: . Let us explain.
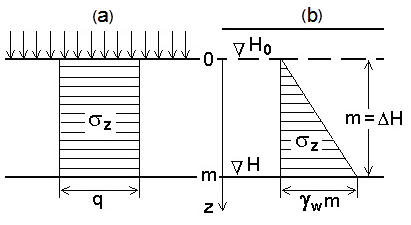
Figure 2Distribution of additional compressing stresses σz in the soil layer of m thickness under the impact of continuous evenly distributed load q, applied to its surface (a), and volume forces γw, arising upon decreasing the groundwater level by (b).
The ABT basement (including the deepest elevation marks of the tunnel bottom) is mainly composed by sand. For such soils with all pores being filled with water (below the groundwater level), the following equations are valid (Gersevanov and Pol'shin, 1948; Terzaghi and Pek, 1967):
where γs is the bulk weight of the soil mineral particles and n is the soil porosity. It is easily shown that the difference between these bulk weight values is equal to
Thus, for ABT conditions, Eq. (8) is reduced to
which follows directly from the consideration of the main principle of subsurface hydrostatics.
It appears appropriate to cite Nikolay M. Gersevanov here: “…artificial decreasing of groundwater level by H meters always produces and additional load on the soil equal to Hγw, being accompanied by the relevant ground subsidence” (Gersevanov and Pol'shin, 1948, p. 117). The growth of effective stress in the water-decrease zone may be caused by three reasons: (1) appearing filtration pressure (prior to drying soils), (2) a decrease in the suspending effect of water; and (3) an increase in the capillary pressure.
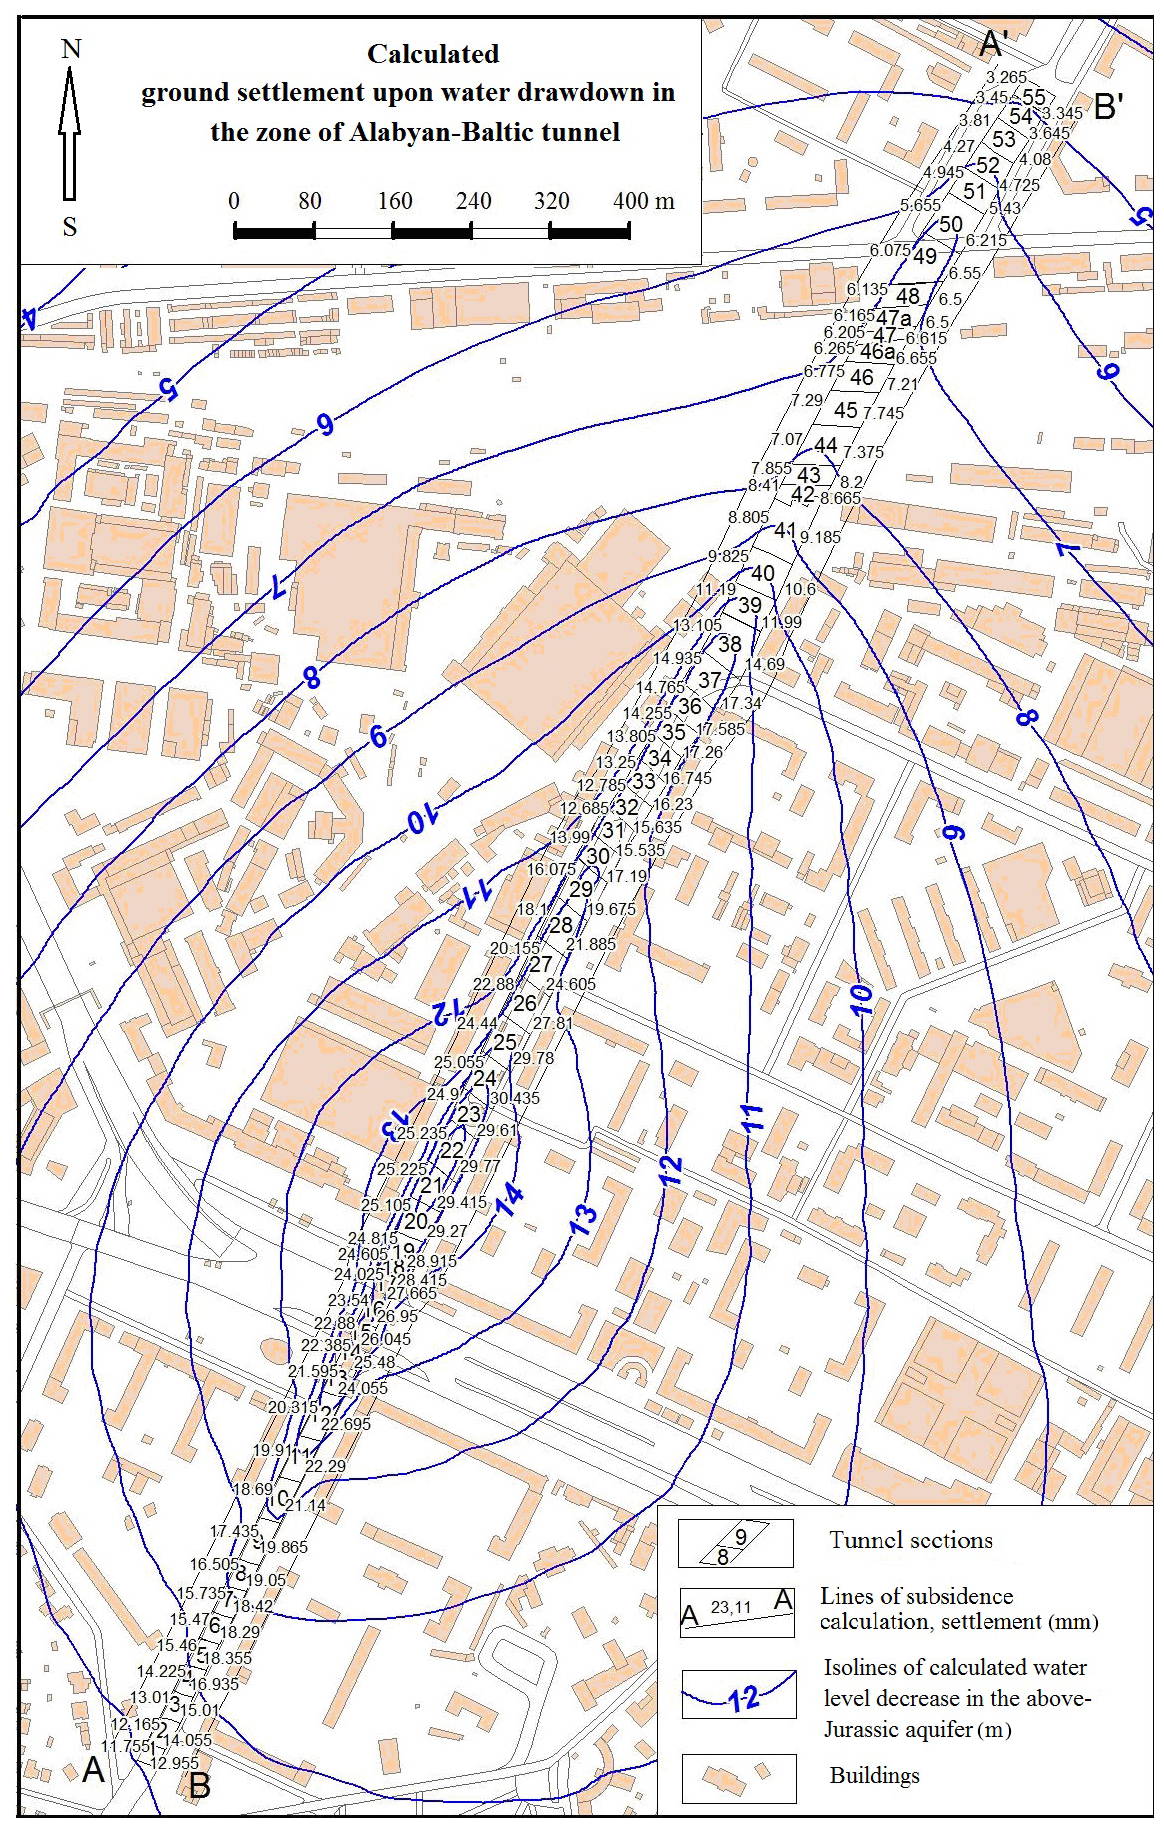
Figure 3Map of isolines of lowering groundwater level and subsidence distribution along the tunnel route.
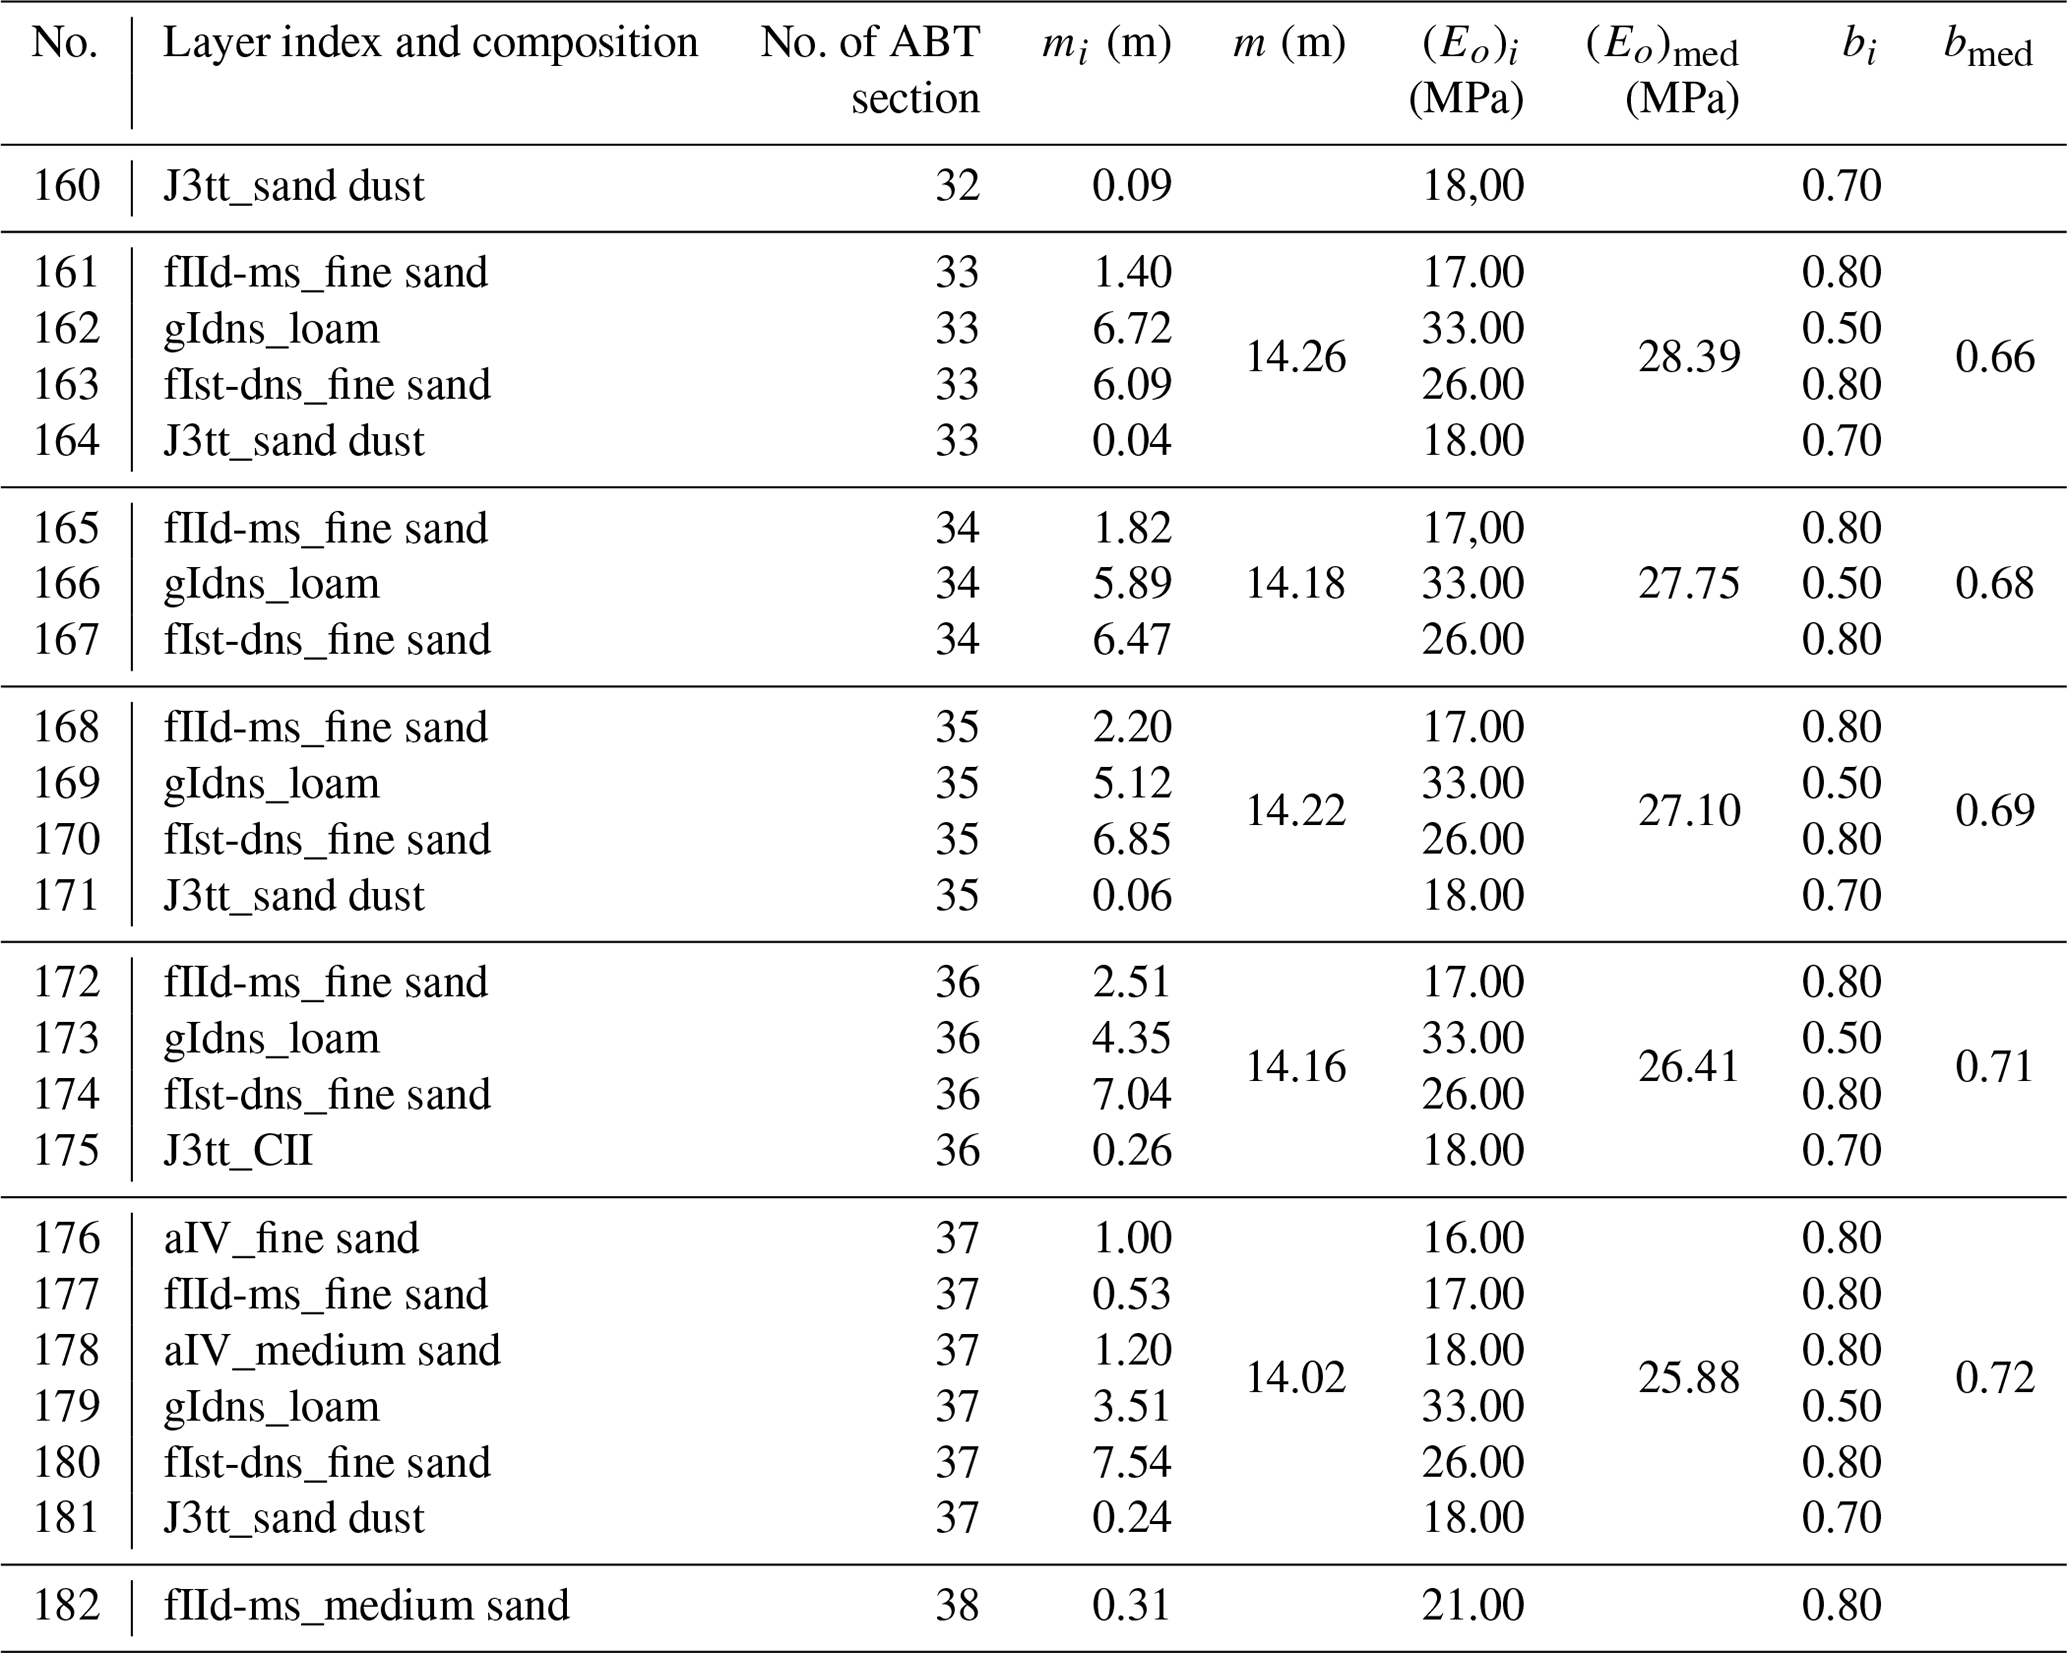
Table 1Fragment of the table of data by the calculation layers and for the entire compressible massif model.
If soil is incompletely water-saturated, which is often met in soils although occurring below the groundwater table, its weight (let us designate it as γS<1) may be evidently lower than that defined by Eq. (a): . The lower index indicates that the moisture content Sr<1. The difference (c) will be also lower: γS<1 – ; it may differ substantially (by 10 %–20 %) from γw for the interlayers of sandy loam (sand dust), loam and clay. Nevertheless, for calculations let us use Eq. (7):
since the subsidence value calculated according to this equation will exceed that determined from Δσ according to Eq. (8). Here, we follow the conservative approach commonly used in engineering survey and projecting of buildings and engineering structures.
Let us take the values for β coefficient proceeding from Nikolay A. Tsytovich recommendations, i.e., β=0.8 for sand, β=0.7 for sand dust, β=0.5 for loam, and β=0.4 for clay (Tsytovich, 1979, p. 64). We set the Eo modulus values proceeding from the engineering geological survey data for all lithological types that occur in the interval:
where H0, H are the elevations of the initial and predicted groundwater level (see Fig. 2b). The ground massif of m=ΔH thickness is multi-layered; therefore, we rewrite Eq. (7) as:
Here, βmed, and (Eo)med are the weighted average values of these parameters:
mi and ki are the thickness and the parameter of the ith soil layer, respectively, in the table of input geological data, a fragment of which is shown in Table 1.
For calculations, we use the data on the initial position of groundwater level and on the predicted value of this level lowering (ΔH). Figure 3 shows the isolines of the predicted level decrease value (ΔH) and the position of two profiles used for s (subsidence) calculation. The subsidence values are also shown in this figure beside each tunnel section. The calculations were performed using the software developed at IEG RAS and 3D engineering geological model of soil and rock massif at the ABT site. The calculation results are presented in Table 2.
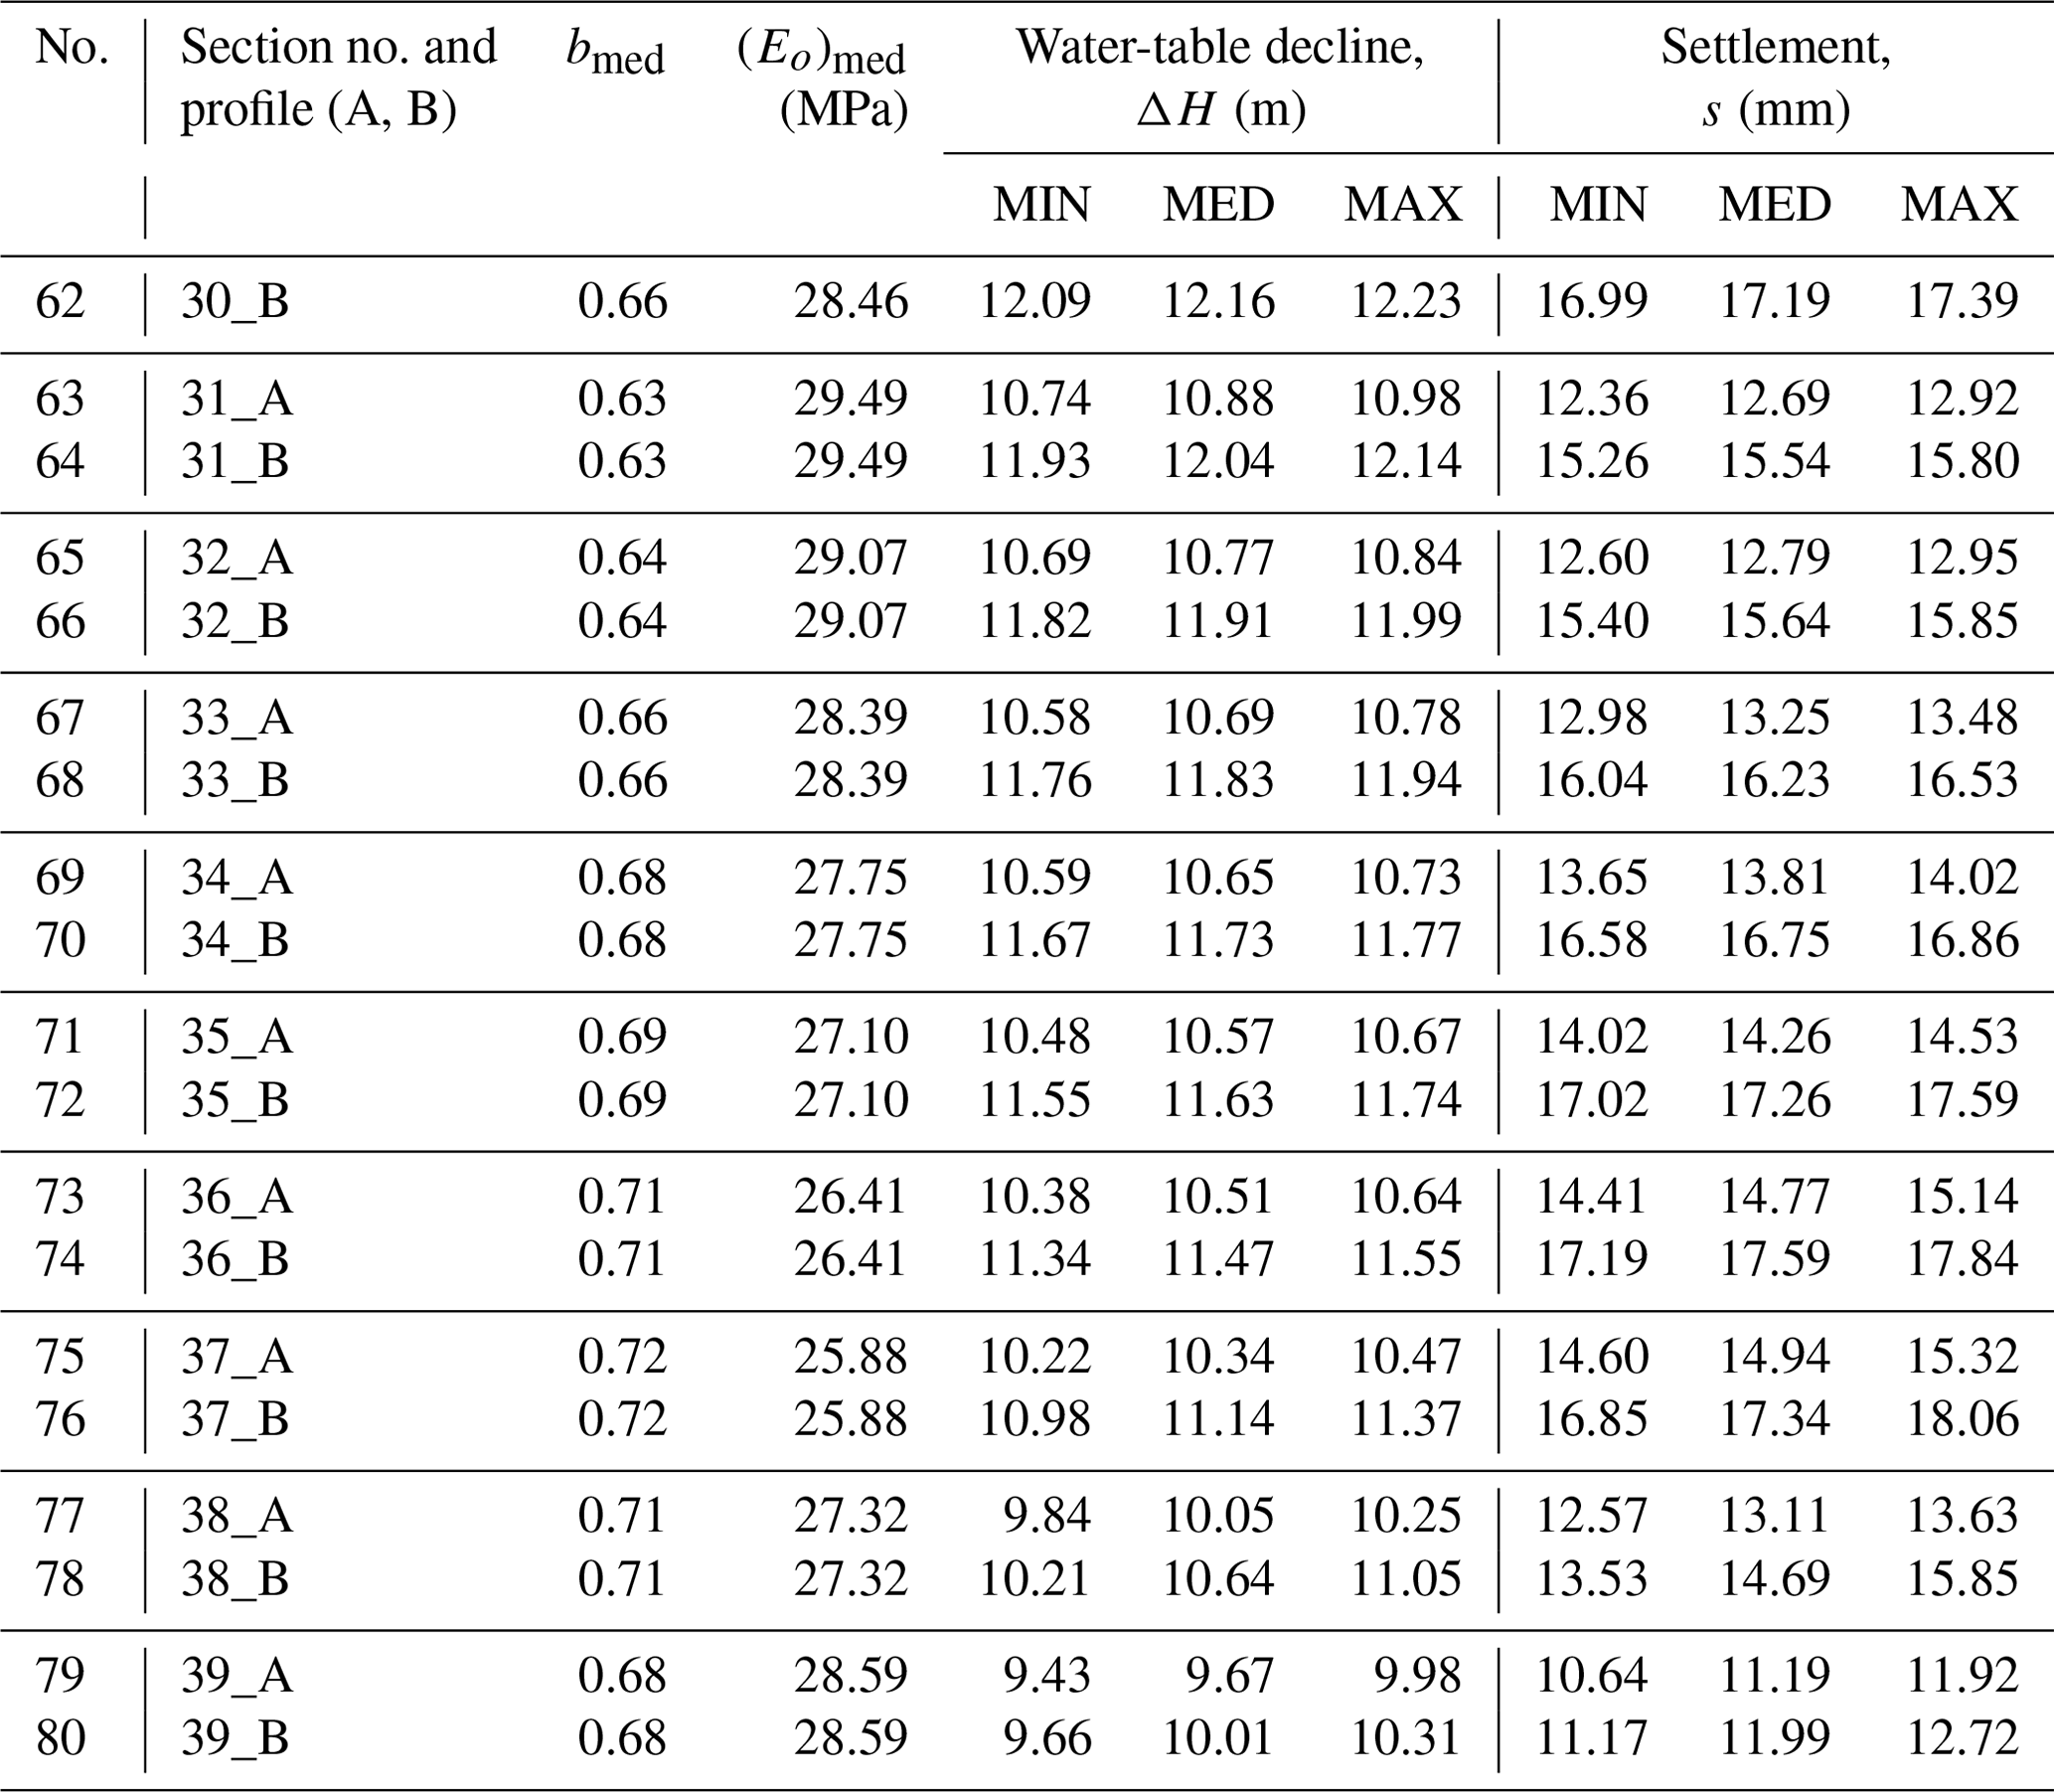
Table 2Fragment of the table showing the calculated subsidence for AA′ and BB′ profiles in the points located in the centers of tunnel sections.
The calculation results are also presented in the form of graphs of subsidence distribution by the lengths of profiles AA′, BB′ (Fig. 4). As is seen, the absolute values s grow regularly up to the 23th ABT section. A somewhat straightening of graphs at segments L = 120–150 m (sections nos. 5–7) and L = 340–400 m (sections nos. 11–12) is explained satisfactorily by the joint influence of changing ΔH, βmed and (Eo)med, in Eq. (9).
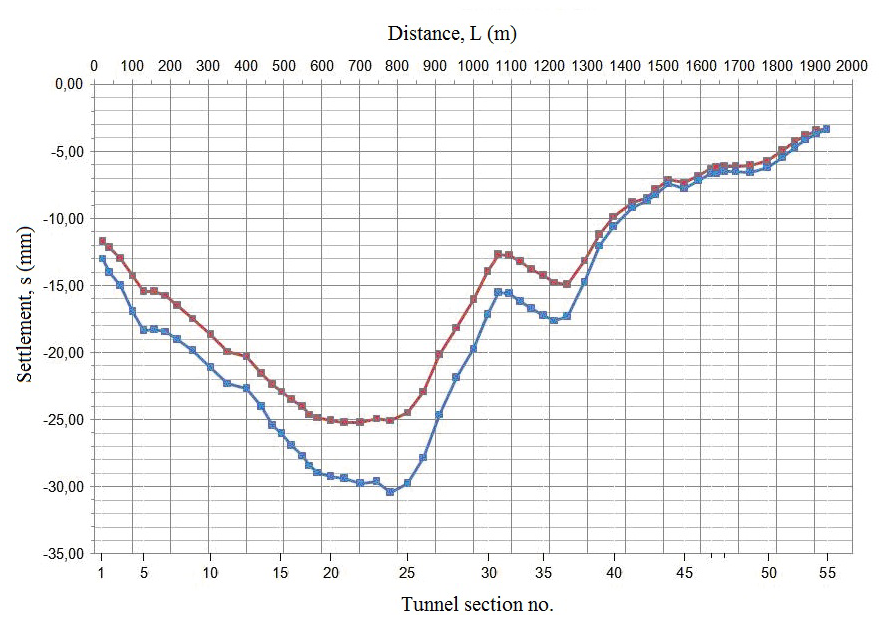
Figure 4Subsidence variation by the profiles AA′ (the red line) and BB′ (the blue line) along the ABT route at a distance of 30 m from the tunnel walls (see Fig. 3). Sections 46a and 47a are marked by small dashes at the lower abscissa axis.

Figure 5Graphs of changing the relative subsidence difference by the lines AA′ (red) and BB′ (blue): ΔL is the distance between the centers of the first and the each of the following 56 sections.
Starting from the 19th and 20th sections (L = 600–630 m, Fig. 4) and up to the 24th and 25th sections (L = 780–830 m, Fig. 4), profiles AA′ and BB′ cross the center of depression cone. Therefore, we can see a beak-shaped depression in the area of sections 23 and 24 in BB′ profile; it is due both to a decrease in (Eo)med, by 1 MPa, and to an increase in ΔH by 1.3 m. Mind that a decrease in the groundwater level exerts a greater effect on the increasing the absolute subsidence value as compared to the reduction of (Eo)med, because as proceeds from Eqs. (7) and (9) s is directly proportional to ΔH in power 2 and inversely proportional to (Eo)cp in power 1. This is the reason for a markedly higher position of the red graph as compared to the blue one in the centre of the depression cone (Fig. 3), where the settlement difference reaches Δs = 5–6 mm (Fig. 4).
Thus, the maximal predicted subsidence along the tunnel route due to groundwater drawdown is observed within the interval L = 600–800 m (sections nos. 19–24). It reaches mm 30 m westward (NW) from the tunnel along the AA′ line; whereas it reaches mm eastward (SE) from the tunnel along the line BB′.
The subsidence value decreases regularly from section 24 to section 31 to sred (AA′) = 12.7 mm and sblue (BB′) = 15.5 mm. The gap between the red and blue graphs also reduces noticeably (Fig. 4), which must be related to aligning of ΔH isolines and a decreasing head difference perpendicular to the tunnel axis (Fig. 3).
The subsidence value is almost the same at sections 31 and 32. However, further, instead of expected rising of graphs, we observe their fall (sections 33–36, L = 1100–1210 m, Table 2). Subsidence is rising by 2 mm: sred=14.8 mm, sblue=17.6 mm. After the “pit” near section 37 (L=1250 m), graphs go upward to join nearly together at the site of section 40 (L=1300 m) (Fig. 4). Further, starting from section 40, with the depression cone having been passed, the surface settlement decreases regularly to s=3.4 mm in the area of the last section 55. Some (though insignificant) violations of this trend do not disturb the above-presented pattern of soil subsidence upon the groundwater level decrease.
Nevertheless, an abrupt rise in the subsidence value in the interval L = 1100–1210 m (sections 33–36, Fig. 4) needs to be explained. Attentive study of the input data and calculation results draws us to the following conclusion. In case the groundwater level decrease changes insignificantly (ΔH ≈ const), which is observed at the segment L = 1100–1210 m (Fig. 3, Table 2), the deformation properties of soil become of decisive importance. In our case, these properties are represented by βmed, (Eo)med.
As is clearly seen from Table 2, starting from the 32nd and up to the 37th section, the total strain modulus decreases, whereas the β coefficient, on the contrary, rises. It is this combined effect from the growing βmed in the numerator and the decreasing (Eo)med in the denominator of Eq. (9) that results to a sharp bending of graphs in Fig. 4 within the interval of the above-mentioned values L.
In any case, the calculation results attests to the insignificant value of the final subsidence s due to the groundwater level drawdown. It is 3–5 and more times lower than the maximum permissible (critical) settlement stated by SP 22.13330-2011 (2011, Annex D).
The relative difference between the subsidence (uplifting) of ground basement Δs∕ΔL is another, no less important parameter of sustainable operation of engineering structures (SP 22.13330.2011, 2011; Theoretical fundamentals of engineering geology, 1978; Tsytovich, 1979). Distribution of its absolute value is shown in Fig. 5. The uneven distribution of subsidence values is seen to be noticeably higher along the eastern profile (BB′) than along the western one (AA′).
In Fig. 5, we observe the alternating rises and falls in the Δs∕ΔL ratio, all of them being somehow related to the intensity of decreasing or increasing the absolute final subsidence value s (Fig. 4). Analysis of these regularities is a separate research task. Here, we may just note that groundwater drawdown along the ABT route does not evidently result in any serious uneven subsidence of the earth surface.
For instance, in the area of sections 26–27 (Fig. 3), we may observe the maximal values of the relative subsidence difference both on the right and on the left from the tunnel: , (Fig. 5, ΔL=867.7 m). However, they are still two orders lower than their permissible values adopted in standard regulations SP 22.13330-2011 (2011, 5, Annex D).
The arrangement of permanently acting drainage in the tunnel will inevitably lead to a decrease in the level of above-Jurassic aquifer at the entire territory adjacent to ABT. At the same time, under these circumstances, the lowering level of the uppermost groundwater aquifer could not cause any serious adverse changes in the environmental conditions.
In particular, it is revealed that the drainage of the ABT ground foundation massif results in the final subsidence of the territory by AA′ and BB′ profiles running along the tunnel route at a distance of 30 m from its walls, which ranges from s = 3–12 mm (in the beginning and in the end of the ABT, respectively) to s = 25–30 mm (near section 24). The subsidence becomes still less significant at a distance of only 100–200 m from the tunnel.
As to the unevenness of land subsidence within the ABT territory due to water drainage, the maximal predicted values of relative subsidence difference in the area between the tunnel sections 26 and 27 are equal to Δs∕ΔL = (0.063–0.075) × 10−3. This is two orders lower than the critical values adopted in the standard regulatory documents.
Note that the calculations performed determine only the influence of groundwater level decrease on the surface subsidence and prove it to be far less than the maximal permissible values (100 mm) stated by standard regulatory documents. This conclusion does not rule out the necessity to undertake protective measures and monitoring of buildings in the ABT vicinity, since the state and properties of soil and rock massif enclosing the tunnel were changed significantly during its construction.
The data have been obtained within the scientific accompaniment of ABT construction project; according to the contract they are unavailable in open access. For interested parties, the data can be provided by IEG RAS upon request.
IVK and ONE characterized engineering geological conditions at the site as well as their transformation in the course of tunnel construction and analyzed the constructional specifics of the tunnel. AVA substantiated theoretical positions for the subsidence calculation and performed the calculations proper. All authors participated in the analysis and interpretation of the results obtained.
The authors declare that they have no conflict of interest.
This article is part of the special issue “TISOLS: the Tenth International Symposium On Land Subsidence – living with subsidence”. It is a result of the Tenth International Symposium on Land Subsidence, Delft, the Netherlands, 17–21 May 2021.
This research has been supported by the Russian Science Foundation (grant no. 16-17-00125).
Gersevanov, N. M. and Pol'shin, D. E.: Theoretical fundamentals of soil mechanics and their practical application, Gosstroiizdat, Moscow, 247 pp., 1948.
Kutepov, V. M. and Sheko, A. I. (Eds.): Natural hazards of Russia. Exogenous geological hazards. Thematic volume, Kruk Publ., Moscow, 348 pp., 2002.
Land subsidence: Special Volume: Proceedings of the 7th International Symposium, 23–28 October 2005, Shanghai, P.R. China, edited by: Barends, F. B. J., Carbognin, L., Gambolati, G., Steedman, R. S., Millpress, Rotterdam, 171 pp., 2005.
Mahmutoğlu, Y.: Surface subsidence induced by twin subway tunnelling in soft ground conditions in Istanbul, B. Eng. Geol. Environ., 70, 115–131, 2011.
Mironenko, V. A. and Shestakov, V. M.: Fundamentals of hydrogeomechanics, Moscow, Nedra, 296 pp., 1974.
Osipov, V. I. and Medvedev, O. P. (Eds.): Moscow: geology and the city, Moskovskie uchebniki i kartolitiografiya Publ., Moscow, 400 pp., 1997.
SP 22.13330.2011: Basements of buildings and engineering structures, Actualized edition SNiP 2.02.01-83*, NIIOSP, Moscow, 162 pp., 2011.
Terzaghi, K. and Pek, R.: Soil mechanics in engineering practice, 2nd Edn., John Willey and Sons, Inc., New York, 729 pp., 1967.
Theoretical fundamentals of engineering geology: Mechanical mathematic fundamentals, edited by: Sergeev, E. M., Nedra, Moscow, 254 pp., 1986.
Tsytovich, N. A.: Soil mechanics (a short course), 3rd Edn., Vysshaya shkola, Moscow, 272 pp., 1979.
- Abstract
- Introduction
- Engineering geological conditions of the site and their changing upon tunnel construction
- Principal theoretical positions for the land subsidence calculation
- Procedure and results of land subsidence
- Conclusion
- Data availability
- Author contributions
- Competing interests
- Special issue statement
- Financial support
- References