the Creative Commons Attribution 4.0 License.
the Creative Commons Attribution 4.0 License.
 | 22 Apr 2020
An InSAR based planning tool for maintaining the Dutch height system
Bas Alberts
Anneleen Oyen
Pieter van Waarden
The Dutch height system, called Normaal Amsterdams Peil (NAP), is realized purely trough leveling between designated benchmarks. In a cycle of 10 years secondary NAP benchmarks, generally located in buildings and civil engineering structures, are surveyed to provide actual and reliable heights. However, leveling campaigns are very labor-intensive and take a lot a of time, resulting in high costs. Furthermore, the planning of secondary leveling is based on limited prior knowledge. Instead of yearly leveling of each bench mark within a region, the strategy could be optimized such that deforming areas are visited more often and stable areas less. Trends estimated from historical NAP data could be used, but these provide insufficient information about stability and reliability of published heights. Therefore we propose to use a nationwide deformation map derived from InSAR satellite data to optimize the planning of the secondary leveling campaigns. By using InSAR deformations combined with information of the NAP benchmarks such as measurement date, type and location, a planning tool has been developed. The first targeted leveling of NAP benchmarks using this tool is planned for 2020.
- Article
(1142 KB) - Full-text XML
- BibTeX
- EndNote


The Normaal Amsterdams Peil (NAP) is the Dutch reference system for physical heights. The realization of the system is formed through a network of 1st order benchmarks that are founded on the Pleistocene sand layer, ensuring for an as stable as possible basis height for secondary measurements (e.g. de Bruijne et al., 2005). The heights of the primary network have been determined relative to the datum point in Amsterdam by nationwide precise levelings. The network of benchmarks is further densified by secondary leveling campaigns, resulting in a secondary network consisting of about 35 000 benchmarks that are publicly accessible. To make sure that these NAP benchmarks have actual and reliable heights, the heights are updated in a cycle of 10 years. In areas subject to deformation, such as northern Groningen or Zuid-Limburg, the update frequency is twice as high, such that the difference between the actual height and the published height remains small. As the average distance between secondary benchmarks is about 1 km, the yearly amount of levelling is about 3500 km. The current strategy has several limitations. Firstly, leveling campaigns are very labor-intensive and take a lot of time, resulting in high costs. Furthermore, the planning of secondary leveling campaigns is based on limited or no prior knowledge about actual deformation. Trends estimated from historical NAP heights could be used, but these do not provide sufficient information about stability and reliability of published heights. The planning strategy of the leveling may be optimized such that areas affected by deformation are measured more often than areas that are stable. Deformation rates estimated from space geodetic techniques, more specifically Interferometric Synthetic Aperture Radar or InSAR, can provide the information to base the planning of leveling upon.
In 2019 Rijkswaterstaat has tendered and awarded the production of a nationwide InSAR based deformation map. This deformation map will be estimated from data acquired by the Sentinel-1 satellite mission. At the time of writing, a nationwide deformation map of the Netherlands was not yet available. In this paper the strategy is tested using a deformation map estimated from RADARSAT-2 data.
Based on the deformation map, areas may be identified that should be prioritized in updating the NAP heights, such as mining or gas extraction areas. Instead of selecting large scale areas this way, we estimate the deformation of individual NAP benchmarks from InSAR measurements that are close to or on the object in which the NAP benchmark is located.
The aim of this study is to optimize the planning of the NAP leveling campaigns, rather than to obtain “true” deformation rates of the NAP benchmarks. Estimates of the deformation rate are not used to update the published NAP height, but are used to obtain the year that a benchmark has to be measured again by leveling.
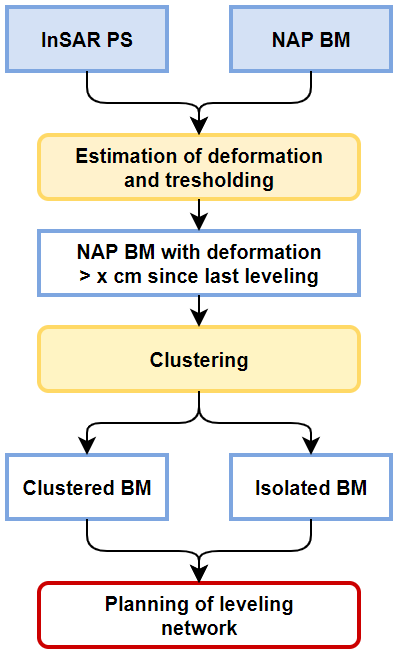
A schematic overview of the concept of the developed strategy is shown in Fig. 1. The input datasets, discussed in Sect. 2, are combined to obtain an estimate of the deformation at the NAP benchmark. Then the estimated rate is used to obtain the total amount of deformation since the benchmark was last measured by leveling and find the year that this deformation would exceed the targeted threshold of 1 cm. This is outlined in Sect. 3. Section 4 deals with the clustering of the benchmarks that have been identified for resurveying. Finally, Sect. 5 gives an outlook to further study.
The developed strategy is tested for the province of Limburg situated in the south of the Netherlands. Especially the southern part of this province, Zuid Limburg, is affected by strong deformations as a result of rising groundwater levels in the former mining areas (e.g. Bekendam and Pöttgens, 1995; Caro Cuenca et al., 2013). For this study the NAP point location and point type information are combined with InSAR to obtain an optimal estimate of the deformation at the NAP benchmarks. This information will form the input for the planning of the levelling. The NAP and InSAR data sets are discussed in detail below.
2.1 NAP benchmarks
The set of NAP benchmarks for which the deformation rate is estimated is limited to benchmarks that have been measured in the last 10 years. Within the test area the last levelings were done in 2012 and, in the most southern part, in 2016. The current NAP publication also contains benchmarks with a measurement date before 2008, but these are not considered in the estimation. The main reason for this is that these benchmarks have a higher chance to be selected for resurvey due to the long measurement time since the last levelling. This would mean that the first year the new strategy is used, it would be mainly focused on leveling the oldest benchmarks. Furthermore, the longer a benchmark has not been revisited the higher the uncertainty whether the benchmark still exists.
Secondary order NAP points are generally situated in buildings or civil engineering structures (bridges, weirs, locks) that are well-founded. A small part of the benchmarks is located in smaller buildings like electricity houses or in a trig point at ground level, which are generally less well-founded. Therefore, a distinction is made here between benchmarks that are located in buildings and benchmarks not located in buildings. The same distinction is also made for the InSAR data (Sect. 2.2) allowing to discard measurements at ground level that are affected by shallow subsidence.
The horizontal positioning accuracy of the NAP benchmarks is about 10 m. This is sufficient to find a point in the terrain (combined with a description and a picture), but is not accurate enough to use building outlines to make the distinction between buildings and non-buildings. Instead it was done using the frequently used abbreviations in the point description (such as HS = house). This means that points lacking such a description are wrongly classified resulting in a less accurate estimate of the deformation rate.
2.2 InSAR PS
In this study use is made of a deformation map derived from RADARSAT-2 imagery acquired over the southern part of the Netherlands between June 2010 and October 2014. The images were processed according to the persistent scatterer (PS) interferometry technique (Ferretti et al., 2001). The resulting PS are natural stable reflectors throughout a stack of SAR images on which the displacement van be accurately estimated from the phase differences. The dataset used here has been provided by Ministry of Economic Affairs and Climate Policy and was used for a study described in Projectgroup GS-ZL (2016). The reported standard deviation of the estimated deformation rates is 0.35 mm yr−1, the estimated relative horizontal positioning accuracy of the PS is about 5 m.
For the distinction between building/non-building use is made of an esri shapefile containing building outlines, which is part of the Dutch registration of addresses and buildings (BAG). The nationwide InSAR deformation map will also include the height of the PS above ground level. This information may be used to further classify the origin of the scatterer.
For the prediction of deformation rates at the location of NAP points the interpolation technique Squared Inverse Distance Weighting (Shepard, 1968) is used. The maximum interpolation distance depends on the density of PS within the vicinity of the NAP benchmark.
Projectgroup GS-ZL (2016) used the same dataset to predict the deformation rate at the location of NAP benchmark. In their study they used Kriging with a maximum radius of 400 m. In this study a smaller maximum interpolation distance is used. Ideally, when a benchmark is located in a building, only the PS on that building would be used. However, as the positional accuracy of the NAP points is rather low and cannot be easily linked to a specific building, PS that are in close proximity of the benchmark are used. As mentioned in the previous section a distinction is made between buildings and non-buildings. Figure 2 shows an example where the estimated rate of the benchmark is affected by a PS on the ground close to the documented position of the NAP point, whereas the actual location of the benchmark is at the front of the church. Although the position of the NAP benchmark is incorrect, using only PS on buildings close to benchmark gives in this case a much better estimation of the deformation.
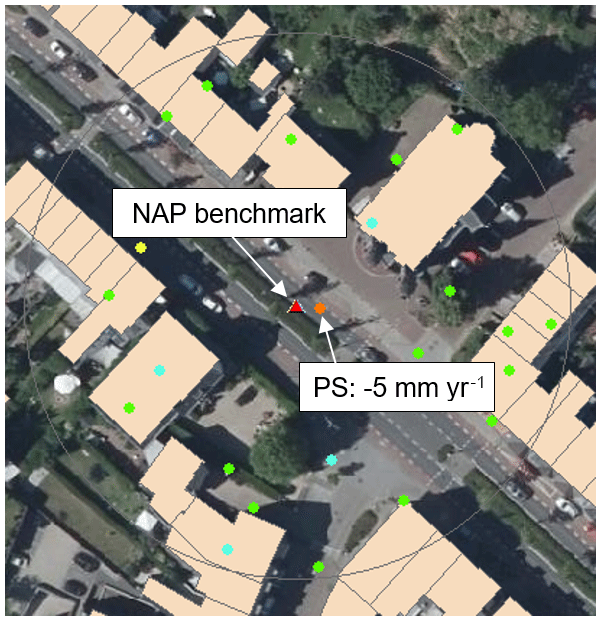
Figure 2Example where the estimated rate of the benchmark is affected by a PS on the ground close to the documented position of the benchmark, whereas the actual location is at the front of the church.
The interpolation is tested for maximum radii of 25, 50 and 100 m. It was found when a radius of 25 m is used, no rate could be obtained for a large number of benchmarks. This may be caused by a lack of reflections on the object containing the benchmark, or by an error in the position of the benchmark. Differences between using a interpolation distance of 50 m or 100 m were small, both for the number of benchmarks for which a rate is estimated and for the estimate deformation rate itself. Therefore, a maximum interpolation distance of 50 m is used here. A disadvantage of using the Squared IDW method is that an outlier or low quality point close to the location of a NAP point has a large impact on the estimated rate. To find outliers the predicted rates are compared to rates estimated from NAP height time series of the benchmark. An example of an suspected outlier strongly affecting the estimated deformation rate is shown in Fig. 3. In order to deal with low quality points the quality measure which is given for each PS can be included in the IDW method. Commonly used quality measures are either the fit of the estimated displacements to a temporal model (e.g. combination of linear and seasonal model) or the temporal coherence of the PS.
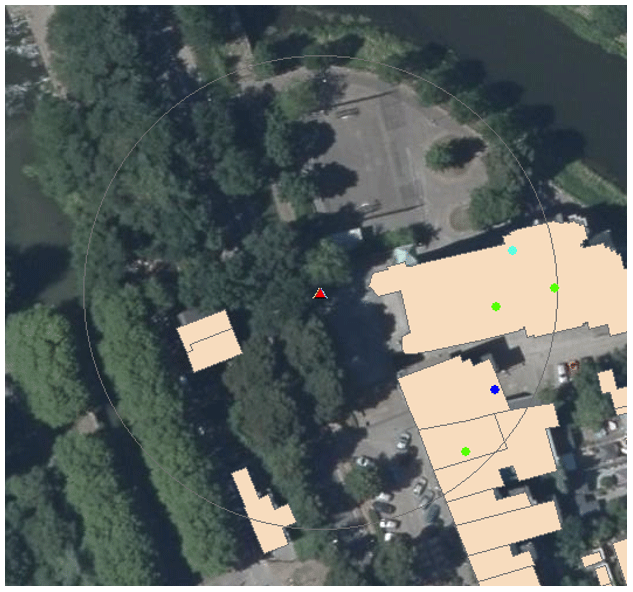
Figure 3Example where a suspected outlier in the InSAR PS data strongly affects the estimated deformation at the NAP point. The outlier was identified by comparing the estimated rates from InSAR with rates estimated from NAP height time series.
The final estimated rate of the NAP points, shown in Fig. 4, is used to compute the total deformation since the last leveling of the benchmarks. Then the NAP benchmarks can be selected that show a deformation larger than a predefined threshold. Here a threshold of 1 cm is used. However, selecting the benchmark this way means that benchmarks showing a deformation slightly less than 1 cm are not selected, but may be located near stronger deforming benchmark. This might mean that the area would have to be resurveyed the next year. Therefore, the year for which the threshold is exceeded is computed and used in the clustering of groups of benchmarks to be updated.
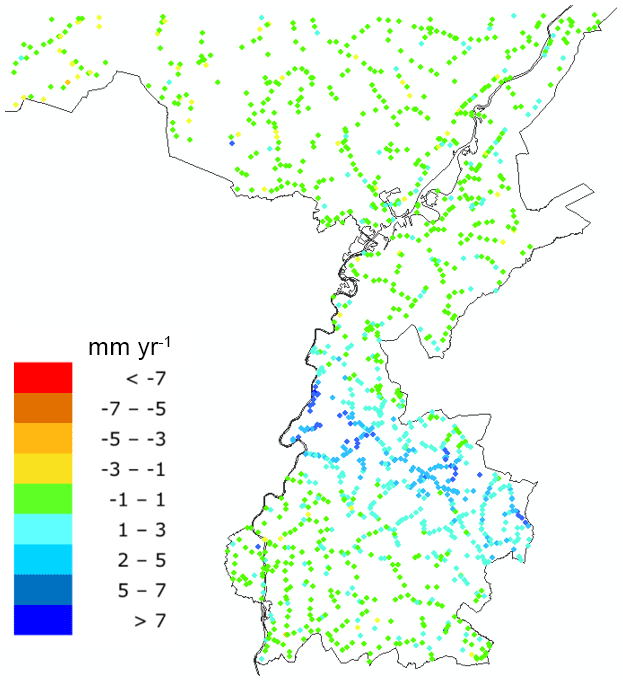
Figure 4Result of the estimation of deformation at the locations of the NAP benchmarks.
Based on the RADARSAT-2 InSAR dataset, the total number of benchmarks to be measured in 2020 with a targeted threshold of 1 cm is 340. This is 18 % of the total number of benchmarks within the test area. Whether this is a large number can only be assessed when the strategy can be applied on the whole nationwide dataset. Obviously, the workload is much less when the target threshold is set to 2 cm. In that case the number of benchmarks to be updated is 73 (4 %).
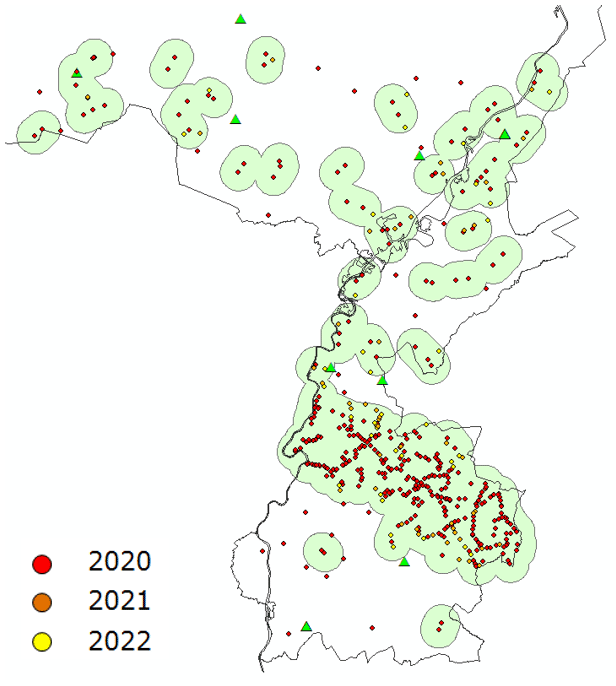
Figure 5Clustered groups and individual benchmarks to be measured in 2020. Benchmarks that exceed the threshold in 2021 and 2022, but are located close to clustered groups need to be measured as well.
The majority of the benchmarks that have been identified in the previous section are located within the former mining area that is affected by deformation due to rising groundwater levels. These benchmarks can be connected by levelling within a large network. However, a large number of benchmarks are isolated from others and cannot be easily connected to a levelling network. Therefore, the benchmarks are divided in groups of points belonging to individual networks and isolated points, based on some predefined rules such as maximum distance and minimum number of points. In this example we used a maximum distance of 2 km and a minimum of 2 points.
The clustering consists of several steps. First, the points to be measured in 2020 are selected and distances between nearest points are computed. Then points that are within 2 km are connected to form a network. This network is then buffered and overlapping networks are connected to a single network to form a stronger network in terms of reliability and redundancy. Finally the buffered networks are intersected with benchmarks to be measured in 2021 and 2022 to prevent a yearly revisit in the same area for a smaller number of points. This is both more cost-efficient and leads to a more reliable levelling network.
The clusters that are found in this manner are shown in Fig. 5. The clusters are the input for the planning of the leveling network. Groups of benchmarks are to be connected to 1 order benchmarks to obtain a stable connection to the NAP datum. For isolated points a different strategy could be followed. In the same way that InSAR is used to identify the deformation of NAP benchmarks, it could be used to identify benchmarks that are stable. Then the isolated benchmarks may be connected to at least 2 stable benchmarks. Alternatively, the NAP point could be flagged in the publication as unstable or be removed from the publication altogether.
The next step to an operational use of the developed strategy is to refine the various parameters using the Sentinel-1 nationwide deformation map when this becomes available. Parameters to be optimized include the maximum interpolation distance and the maximum distance used for the clustering of benchmarks to be updated. Furthermore, it is to be seen whether the target threshold of 1 cm maximum deformation of a NAP point is feasible or even necessary from a user perspective. An improvement in the estimation of the deformation of NAP benchmarks could be obtained if the position accuracy of the benchmarks can be improved and if the type classification (such as building versus non-building) can be enhanced.
In the new update strategy smaller leveling networks than in the current strategy will be surveyed. This means that the networks will be connected to fewer 1st order benchmarks. This limits the possibility to test the stability of these 1st order benchmarks in a constrained least squares adjustment, as can be done in larger leveling networks. A new precise nationwide leveling may be the only way to update the heights of 1st order benchmarks, relative to the datum point in Amsterdam. Finally, a large number of 2nd order benchmarks will not be resurveyed for longer periods, especially when they are found to be stable. This means that inspections may become necessary to flag benchmarks that have disappeared due to construction work or cannot be reached due to obstruction.
The InSAR results based on the RADARSAT-2 SAR data were provided by the Ministry of Economic Affairs and Climate Policy. The RADARSAT-2 SAR images were be provided by the Netherlands Space Office and are free and open for any Dutch legal entity. The location and the most recent heights of the NAP benchmarks are free and open, online available through the Dutch “national geo-register” (http://nationaalgeoregister.nl, last access: 2 March 2020).
The simulations and analyses were carried out by the main author and the results were discussed by all authors. The manuscript was prepared by the main author with contributions from the co-authors.
The authors declare that they have no conflict of interest.
This article is part of the special issue “TISOLS: the Tenth International Symposium On Land Subsidence – living with subsidence”. It is a result of the Tenth International Symposium on Land Subsidence, Delft, the Netherlands, 17–21 May 2021.
We thank the Ministry of Economic Affairs and Climate Policy for providing the RADARSAT-2 InSAR results that are used for developing the proof of concept as presented in this paper.
Bekendam, R. F. and Pöttgens, J. J.: Ground movements over the coal mines of southern Limburg, The Netherlands, and their relation to rising mine waters, Proceedings of the Fifth International Symposium on Land Subsidence, The Hague, The Netherlands, 3–12, 1995.
Caro Cuenca, M., Hooper, A. J., and Hanssen, R. F.: Surface deformation induced by water influx in the abandoned coal mines in Limburg, the Netherlands observed by satellite radar interferometry, J. Appl. Geophys., 88, 1–11, 2013.
de Bruijne, A., van Buren, J., Kösters, A., and van der Marel, H.: Geodetic reference frames in the Netherlands, Netherlands Geodetic Commission 43, Delft, 2005.
Ferretti, A., Prati, C., and Rocca, F.: Permanent Scatterers in SAR Interferometry, IEEE T. Geosci. Remote, 39, 8–20, 2001.
Projectgroup GS-ZL: Na-ijlende gevolgen steenkolenwinning Zuid-Limburg, Final report on the results of the working group 5.2.1 – ground movements. Ministry of Economic Affairs and Climate Policy, The Netherlands, 2016.
Shepard, D.: A two-dimensional interpolation function for irregularly-spaces data, Proceedings of the 1968 23rd ACM national conference, 517–524, 27–29 August 1968.