the Creative Commons Attribution 4.0 License.
the Creative Commons Attribution 4.0 License.
 | 22 Apr 2020
Land subsidence monitoring based on PS-InSAR Persistent Scatterers identification with spectral analysis method
Di Zhou
Jie Yu
Yanbing Wang
Jing Zhang
Shuai Jiao
Ren Shu Chen
Layover occurs as a consequence of the slant range scale distortion in Synthetic Aperture Radar (SAR) data and it is commonly observed in the images acquired over urban areas. There may be two or more Persistent Scatterers (PSs) in one pixel. Moreover, these PSs do not have amplitude stability and spatial coherence. The threshold method used in the Persistent Scatterer Interferometric (PSI) SAR technique cannot identify the PS with two scatterers in urban, the accuracy of urban land subsidence is reduced. To solve this problem, we used Fast Fourier Transform (FFT) convert PSs in frequency domain during PS identification process of PSI, by observing their characteristics in the frequency domain, the layover scatterers can be identified and separated. The results of simulation experiment show that by analyzing the peak distribution characteristics of PSs in the elevation direction under the relatively even space baseline, PSI with FFT can identify single scatterers and layover scatterers. After separating the layover scatterers, the reliability of PSs identification are improved. For the real data experiment, we use 31 Sentinel-1A IW images covering Beijing from 2014 to 2016 as data sources. The results show that the proposed method can effectively identify layover scatterers which cannot be identified by the threshold method in urban, reducing the effect of layover scatterers, improving the accuracy of urban land subsidence monitoring.
- Article
(1629 KB) - Full-text XML
- BibTeX
- EndNote


Land subsidence is a geological phenomenon caused by natural physical and chemical processes or by human activities such as over-exploitation of subsurface fluids and solid minerals and construction engineering primarily in urban. Land subsidence has been discovered in more than 150 regions and cities over the world. Beijing is one of the areas where land subsidence is relatively serious in China (Chen et al., 2015). Excessive exploitation of groundwater is the main cause of land subsidence in Beijing (Wang et al., 2005). At present, five large land subsidence areas have been formed in Changping District, Chaoyang District, Shunyi District and Tongzhou District. The potential threatens of urban land subsidence mainly include damage to buildings, railways, roads and bridges. Therefore, to ensure sustainable urban development and to improve the residental environment and safety of people's lives and property, land subsidence monitoring is an essential process in Beijing.
With the development of the Interferometric Synthetic Aperture Radar (InSAR) techniques, PSI has become one of the main means of monitoring land subsidence in urban. In PSI technique, PSs identification method mainly includes: single and multiple threshold. It is difficult to identify and separate the layover scatterers in the urban environment through the threshold setting, which reduce the reliability of PSs identificatin for both single and multiple threshold method.
For our purposes, we, therefore, adopted the following simple procedure. To identify and separate single and layover scatterers, the FFT algorithm in spectral analysis is applied to the PSs identificatin process. The FFT can be used to analyze the height-to-peak position of single and layover scatterers, and the frequency information contained in corresponding scatterers are obtained. Thereby improving the problem of layover scatterers in urban environment and improve the monitoring accuracy.
2.1 PSI Technique
In 2001, Ferretti et al. proposed a permanent scatterer differential interferometry technique to reduce temporal and geometric decorrelation and atmospheric influences in traditional InSAR technology (Ferretti et al., 2001). The core idea of the method mainly includes: firstly registering the auxiliary image of the N+1 SAR image covering the research area with the main image, and interfering to obtain the N-view differential interferogram, and then using the external DEM to remove the terrain phase. The candidate PS is preselected based on the Dispersion Amplitude Index (DAI). After obtaining the PS candidate points, analyze the phase stability and screen the best PS points (Hooper et al., 2004). The basic model is as follows Eq. (1):
where ϕx,i is the phase of the xth PS point in the ith interferogram, is the phase related to the deformation along Line of Sight (LOS), is the phase caused by the atmospheric phase, is the orbit error phase, is DEM error phase, nx,i is the thermal noise of the system.
2.2 Fast Fourier Transformation
FFT is a fast algorithm of Discrete Fourier Transform (Tan and Zhang, 2006). As to complex serial , following Eq. (2):
In the focused SAR complex image, the complex value Y of a pixel in the Nth scene image can be regarded as the projection of the real 3-D reflection on the azimuth-oblique distance plane, i.e. the integral of the reflected signal along the vertical oblique distance direction (Fornaro et al., 2003), which can be expressed as Eq. (3):
where is the distribution range of the signal along the tomography direction s. γ(s) represents the scattering value in the vertical oblique direction. ξn represents spatial frequency, which is related to the position of the synthetic aperture. Images obtained by satellites at different positions represent the results of discrete Fourier transform of oblique vertical target scattering points at different frequency components (Zhu and Bamler, 2010). When enough images of different frequency components are registered, the sequence can be regarded as Fourier transform of the distribution function γ(s) of the backward complex scattering coefficient of the oblique vertical target, and the information of the distribution function γ(s) of the backward complex scattering coefficient of the oblique vertical target can be obtained by inverse Fourier transform.
In this method, the PSs with better spatial distribution density can be obtained by DAI pre-selection and phase stability screening. On this basis, the FFT is used to identify the layover scatterers contained in a pixel.
In order to verify the effectiveness of FFT in frequency domain conversion at PS, simulation experiments are carried out.
3.1 Simulation Experiment
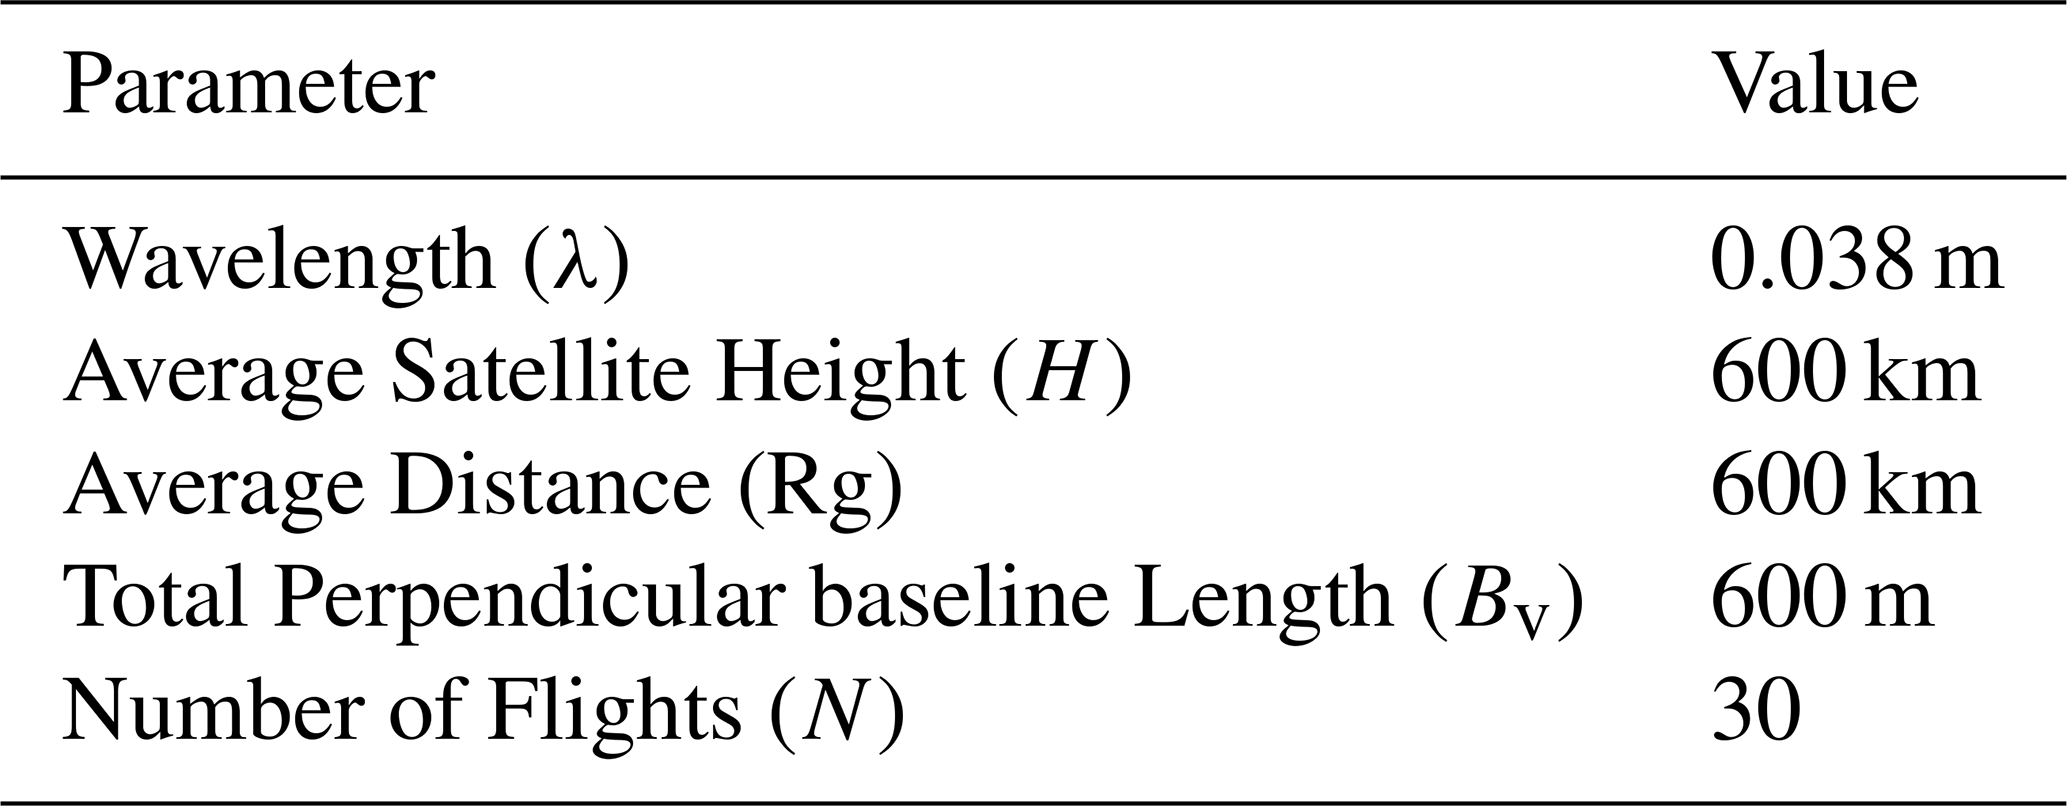
It is assumed here that the SAR azimuth and distance directions have been completely focused, and only the height-direction signals are simulated. The specific simulation parameters are shown in Table 1.
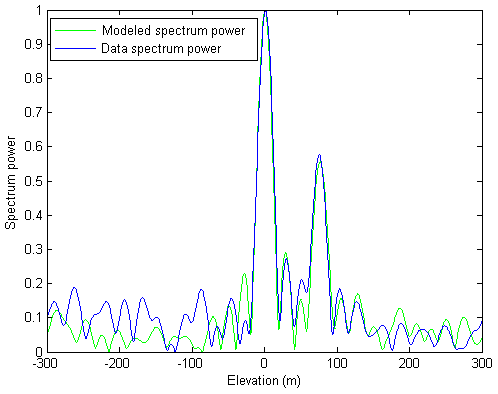
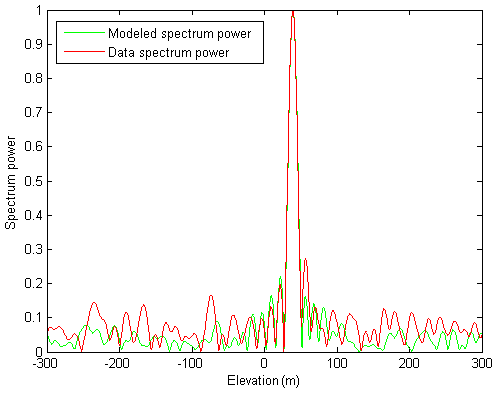
Assuming that the perpendicular baseline Bv is a random non-uniform distribution, the parallel baseline Bp is a random distribution of 0 to 100 m. When there is a single scatterer in one pixel, the height Hs of the scatterer is 40 m, when one pixel is a layover scatterer (that is layover scatterer), the scatterer heights Hs are 0 and 80 m respectively, and the corresponding scattering intensities are 100 and 150 respectively. In order to make the analog data closer to the real data, Gaussian white noise with a certain intensity is added to the SAR signal. The high-dimensional focusing of the simulated highly diffuse cross section is performed using the FFT. The simulation results of single scatterer in the resolution unit are shown in Fig. 1; the simulation results of layover scatterers in the resolution unit are shown in Fig. 2.
As can be seen from Figs. 1 and 2, when a single scatterer is known in the resolution unit, there is only one peak in the height range of scatterers reconstructed by FFT, while when a layover scatterer is known in the resolution unit, there are two peaks in the height range of scatterers reconstructed by FFT. This proves that single and layover scatterers can be identified by FFT after frequency domain conversion of PSs. In the simulation experiment, the baseline distribution is dense, FFT can better control the generation of noise, and the scattering point position is more accurate.
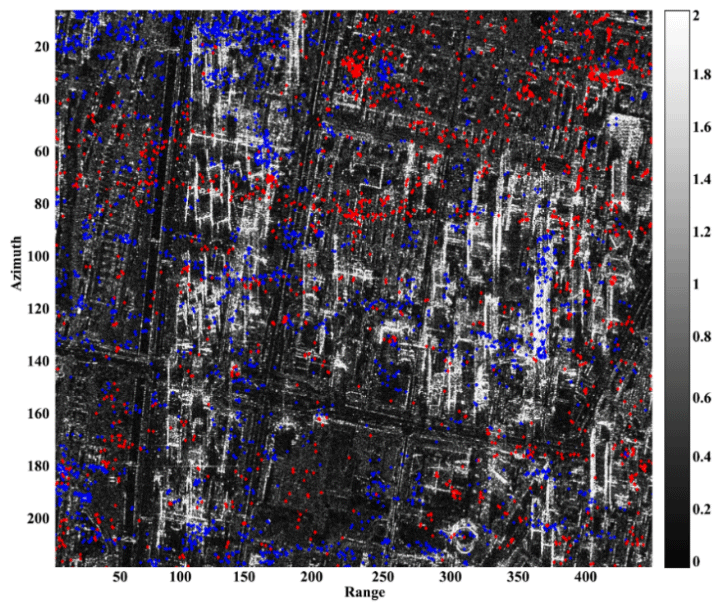
Figure 4Distinguishing single- (red) and layover scattering (blue) points using PSI with FFT on a stack of Sentinel-1A IW images of Beijing (Sentinel-1A data ©ESA 2014–2016).
3.2 Land Subsidence Monitoring in Beijing
In order to verify the effectiveness of FFT applied to PSs identification in land subsidence, a PS identification method called “PSI technique with FFT” (FFT+PSI) is used for identifying and separating layover scatterers. We used 31 Sentinel-1A IW images from October 2014 to September 2016 in Beijing area for method verification. The range resolution of Sentinel-1A IW images is 5 m, the azimuth resolution is 20 m. Rapid deformation rates can be monitored due to the short repeat cycle of only 12 d of each satellite of the Sentinel-1 mission. The images obtained on 20 November 2015 are taken as the master images, and the remaining 30 scenes are slave images.
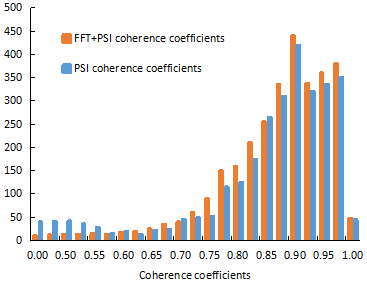
Statistics are made on the mean values of PS correlation coefficients identified by the two methods respectively, and the results are shown in Fig. 3. It can be seen that the average correlation coefficient of a small portion of PSs are in the range of 0.0–0.6. However, the mean value of correlation coefficients of almost all PSs are kept within a relatively high range (0.6–0.95), which shows that the spatial correlation of PSs are improved as a whole after FFT is used, and further proves that it is feasible to identify layover scatterers in urban.

Figure 5Comparison of deformation velocity calculated for Beijing between 2014 and 2016 for two cases, using (a) PSI and (b) FFT+PSI (The Digital Elevation Model (DEM) with a spatial resolution of 90 m was used as a basemap. DEM ©Geospatial Data Cloud 2016).
In this paper, FFT is applied in the PS point identification process, which can identify single and layover scatterers. The number distribution of scatterers is shown in Fig. 4. Among them, the pixels represented by red points are single scatterers, and the pixels represented by blue points are layover scatterers. Most single scatterers are located in the lower part of the building, while most layover scatterers are located in the upper part of the building. This is because the facade of the building and the ground form a typical dihedral angle structure, and there are ground objects with the same distance from the satellite on the wall and the ground. The echo signal of the images element in the upper part of the building usually comes from the ground and the other part from the wall. The two kinds of signals are superposed to form the echo signal of the SAR images element.
3.3 Monitoring Results of Land Subsidence in Beijing
The PSI and the FFT+PSI are applied to Sentinel-1A IW images from October 2014 to September 2016 respectively, and the land subsidence information in Beijing is obtained, as shown in Fig. 5 (the red area in the Fig. 5 is negative, indicating the land subsidence; The blue area is positive, indicating that the ground is rising). Before further analysis, the land subsidence results obtained by PSI should be compared with the benchmark results to ensure the accuracy of the subsidence values obtained by PSI.
3.4 The Validation of Monitoring Results
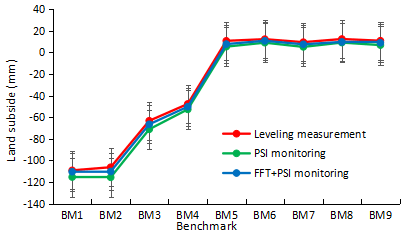
We chose the leveling measurements to evaluate the quality of monitoring results. We compared the time series of deformation from PSI, FFT+PSI and leveling measurements. And we chose the PSs within 200 m of benchmarks (that is reference point in the Fig. 5) for the comparison (arithmetic average method).
From Fig. 6, the difference between the two methods and the leveling measurement are smaller than ±5 mm at most points. And the standard deviation of the difference of PSI and leveling, FFT+PSI and leveling are 5.41 and 1.05, respectively, which indicates that the FFT+PSI results are more reliable for land subsidence monitoring. Very interesting are the results of the benchmark BM 1, BM 2 and BM 3 in densely built urban areas, the monitoring error of PSI is larger than the mean error.
3.5 Discussion
The velocity of land subsidence in Beijing is shown in Fig. 5. The western region has a center of land subsidence, and the phenomenon of regional uneven subsidence is serious. From 2014 to 2016, the annual deformation velocity ranges from +5.5 to −110.4 mm yr−1. The area with the most serious land subsidence is located in Chaoyang district of Beijing and the border area between Chaoyang and Tongzhou. This area is the economic center of Beijing. Many high-rise buildings are concentrated in the Central Business District (CBD), and the average annual subsidence is more than 100 mm yr−1.
The above results have shown that both methods can obtain more accurate land subsidence results for regions with stable surface conditions. But, for urban with dense buildings, the threshold method used in the PSI technique can only deal with the situation that there is a single scatterers in a pixel, and cannot identify and separate layover scatterers, so it is easy to affect the monitoring results of urban land subsidence. However, the method in this study can also obtain better monitoring accuracy for urban areas, we applied the FFT convert PSs in frequency domain during identification process of PSI technique. By observing their spectral distribution characteristics of single and layover scatterers from the frequency domain, they are identified and separated, further proving the effectiveness and reliability of this method, and the monitoring accuracy was significantly improved.
In this paper considering the threshold method cannot identify layover scatterers in urban through threshold setting. The FFT is used to PS identification process in PSI. This method through convert PSs into frequency domain, observe the peak of reconstructed scatterer height range, and obtain the frequency domain characteristics of single and layover scatterers. In particular, the land subsidence monitoring experiment in Beijing shows that the monitoring accuracy of proposed method is higher than that of PSI method, and the subsidence monitoring accuracy in densely built urban areas is improved. As an additional contribution, these results cast new light on the PSs identification and have important ramifications for obtain information on urban land subsidence.
All code required to reproduce these findings cannot be shared at this time as the code also forms part of an ongoing study.
DZ performed the experiments, analyzed the data. JY provided crucial guidance and support through the research. LZ, YW and JZ contributed significantly to fund support. SJ and RSC made helpful suggestions on data processing. DZ prepared the manuscript with contributions from all co-authors.
The authors declare that they have no conflict of interest.
This article is part of the special issue “TISOLS: the Tenth International Symposium On Land Subsidence – living with subsidence”. It is a result of the Tenth International Symposium on Land Subsidence, Delft, the Netherlands, 17–21 May 2021.
We thanks the European Space Agency for their great efforts in developing the Sentinel-1A. We also thank for Geospatial Data Cloud for making DEM data available. Moreover, thanks for the excellent Persistent Scatterer Interferometric Synthetic Aperture Radar technique for data processing.
This research has been supported by the National Natural Science Foundation of China, (grant no. 41671417) and the Beijing Outstanding Young Scientist Program (BJJWZYJH01201910028032) and Capacity Building for Sci-Tech Innovation Fundamental Scientific Research Funds (01119530050175).
Chen, B. B., Gong, H. L., and Li, X. J.: Spatial correlation between land subsidence and urbanization in Beijing, China, J. Nat. Hazards, 75, 2637–2652, https://doi.org/10.1007/s11069-014-1451-6, 2015.
Ferretti, A., Prati, C., and Rocca, F.: Permanent scatterers in SAR interferometry, IEEE T. Geosci. Remote, 39, 8–20, https://doi.org/10.1109/36.898661, 2001.
Fornaro, G., Serafino, F., and Soldovieri, F.: Three-Dimen-sional Focusing with Multipass SAR Data, IEEE T. Geosci. Remote, 41, 507–517, https://doi.org/10.1109/TGRS.2003.809934, 2003.
Hooper, A., Zebker, H., and Segall, P.: A new Method for Measuring Deformation on Volcanoes and Other Natuaral Terrains Deformation Using InSAR Persistent Scatterers, J. Geophys. Res. Lett., 31, 1–5, https://doi.org/10.1029/2004GL021737, 2004.
Tan, Z. Y. and Zhang, Y. B.: Research of Fast Fourier Transformation and Realization of MATLAB, J. China Sci. Tech. Info., 52, 179–188, https://doi.org/10.1109/TCE.2006.1605045, 2006.
Wang, Y. P.: Study on Land Subsidence Caused by Overexploiting Groundwater in Beijing, J. Site Investigation Sci. Tech., 5, 46–49, https://doi.org/10.3969/j.issn.1001-3946.2004.05.013, 2005.
Zhu, X. X. and Bamler, R.: Very High Resolution Spaceborne SAR Tomography in Urban Environment, IEEE T. Geosci. Remote, 48, 4296–4308, https://doi.org/10.1109/tgrs.2010.2050487, 2010.