the Creative Commons Attribution 4.0 License.
the Creative Commons Attribution 4.0 License.
 | 22 Apr 2020
Reliability of InSAR satellite monitoring of buildings near inner city quay walls
Arjan A. M. Venmans
Martin op de Kelder
Jarco de Jong
Mandy Korff
Martijn Houtepen
Amsterdam currently has a huge task of assessing and potentially upgrading its quay walls along the historic canals. Before replacement can take place, Amsterdam needs to determine the potential impact the replacement can have on the nearby buildings. The rate of vertical deformation of the adjacent buildings is used as indicator of potential foundation problems. To determine that rate, the current practice is to monitor the buildings by levelling for two years at least. This study shows that application of satellite measurements using Permanent Scatterer Interferometric Synthetic Aperture Radar (PS-InSAR) could reduce the monitoring period to a few months. The paper describes the statistical procedure that has been applied to levelling and satellite measurements to verify their reliability and determine the rate of vertical deformation of the buildings. The procedure was applied in three case studies. The rates of deformation observed in the InSAR measurements are in good agreement with the rates of deformation observed in the levelling in two of the case studies. The locally optimized InSAR data set with observations in the period 2014–2019 provides an almost 100 % coverage of reliable data points for all buildings in the case studies. More experience will need to be gained in the interpretation of InSAR measurements with respect to vulnerability of the buildings. Also, the procedure may be extended to include analysis of non-linear trends such as second order trends and seasonal effects.
- Article
(2024 KB) - Full-text XML
- BibTeX
- EndNote


The City of Amsterdam is facing the huge task of assessing and potentially replacing 200 km of the quay walls of its charming old inner-city canals. Soft soils underly the Amsterdam inner-city, causing an average subsidence rate of 2 mm yr−1 and making the adjacent historical buildings susceptible to damage by nearby construction activities. A city guideline (Crux, 2014) describes regulations that apply to construction activities for minimising the probability of damage to the adjacent historical buildings.
The guideline uses the vertical deformation rate of the buildings as indicator for potential foundation problems. Buildings with foundation problems are especially vulnerable during quay wall replacement. A vertical deformation rate higher than the background subsidence of 2 mm yr−1 is considered as a threshold for potential foundation problems, such as timber decay. If the vertical deformation rate exceeds the threshold value, further investigations of the foundation is required to assess the need for foundation improvement prior to quay wall replacement.
Until now the deformation rate is determined by traditional levelling of markers in the building facades. The monitoring of the markers should last two years at least to produce a reliable time series of building subsidence.
Permanent Scatterer Interferometric Synthetic Aperture Radar (PS-InSAR) (van Leijen, 2014) can measure deformations of objects with high reliability. For the last ten years the TerraSAR-X satellite (ESA, 2019) produces deformation time series with high temporal and spatial resolution. Application of satellite measurements using InSAR to building monitoring could reduce the monitoring period from two years to a few months.
The Technical University of Delft (de Jong, 2018) and Deltares (Venmans, 2019) have examined the reliability of the procedure and its potential for use in the city. Section 2 describes the procedure that has been applied to levelling and satellite measurements to derive the rate of vertical deformation of the buildings with a known reliability. Section 3 describes one out of three case studies in the Amsterdam inner city. Section 4 compares the results of the procedure applied to two InSAR data sets compared to the results of the procedure applied to the levelling data set. Section 5 gives conclusions and recommendations.
2.1 Data sets
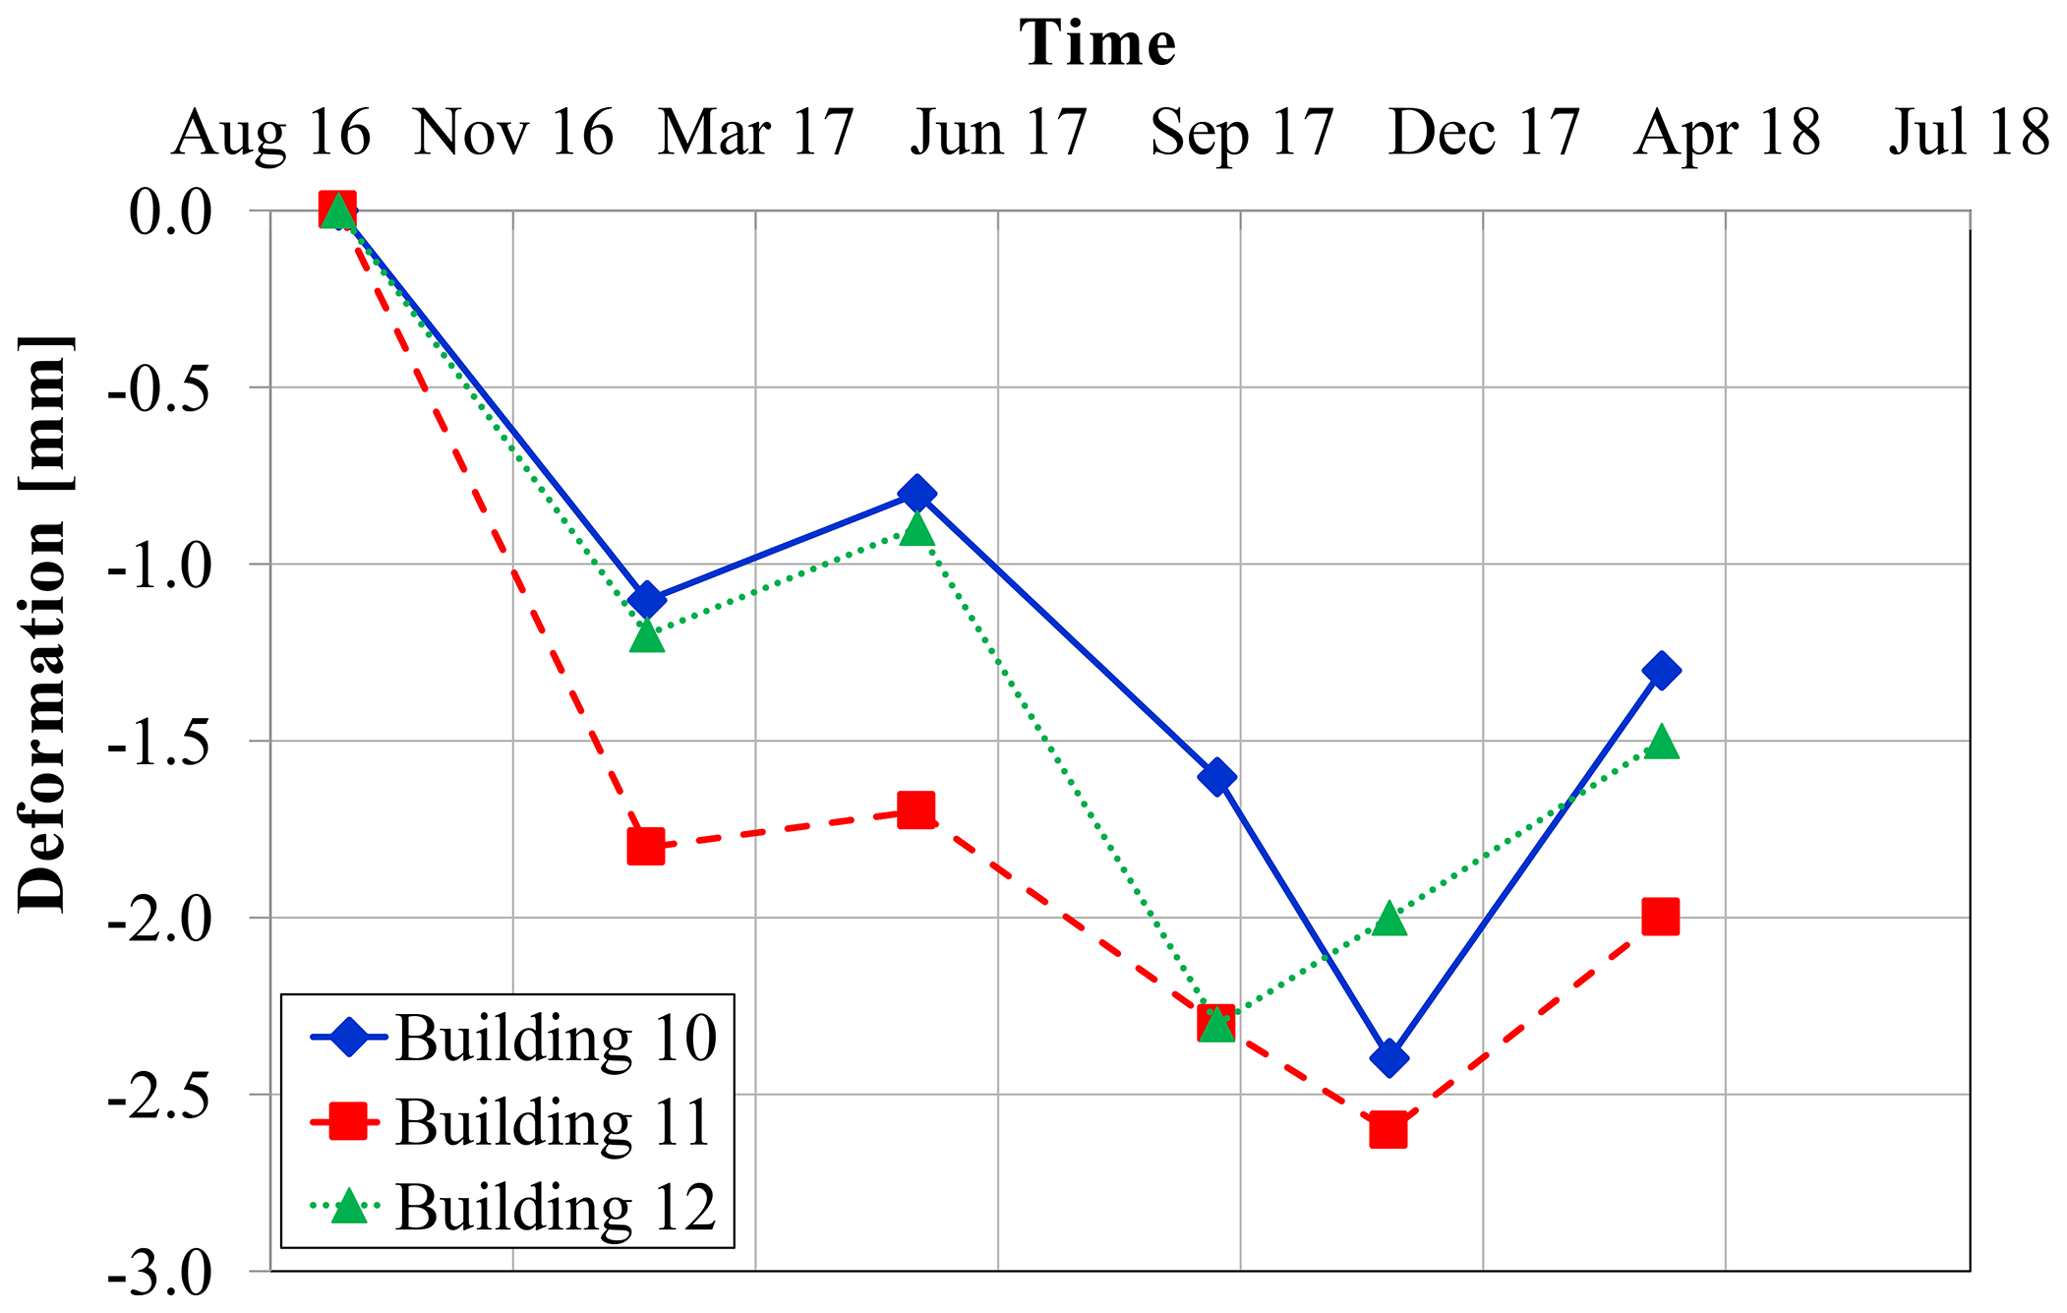
Three data sets were used in the case studies. The levelling data set usually comprises the last 2 to 4 years. The levelling measures the level of two markers installed in the facades of the buildings at low elevation, relative to a network of fixed points in the inner city. Figure 1 gives an example of a levelling time series. The accuracy of the levelling measurements is in the order of 1 mm. The precision, expressed as the a-priori standard deviation, is around 0.5 mm (Amsterdam, personal communication).
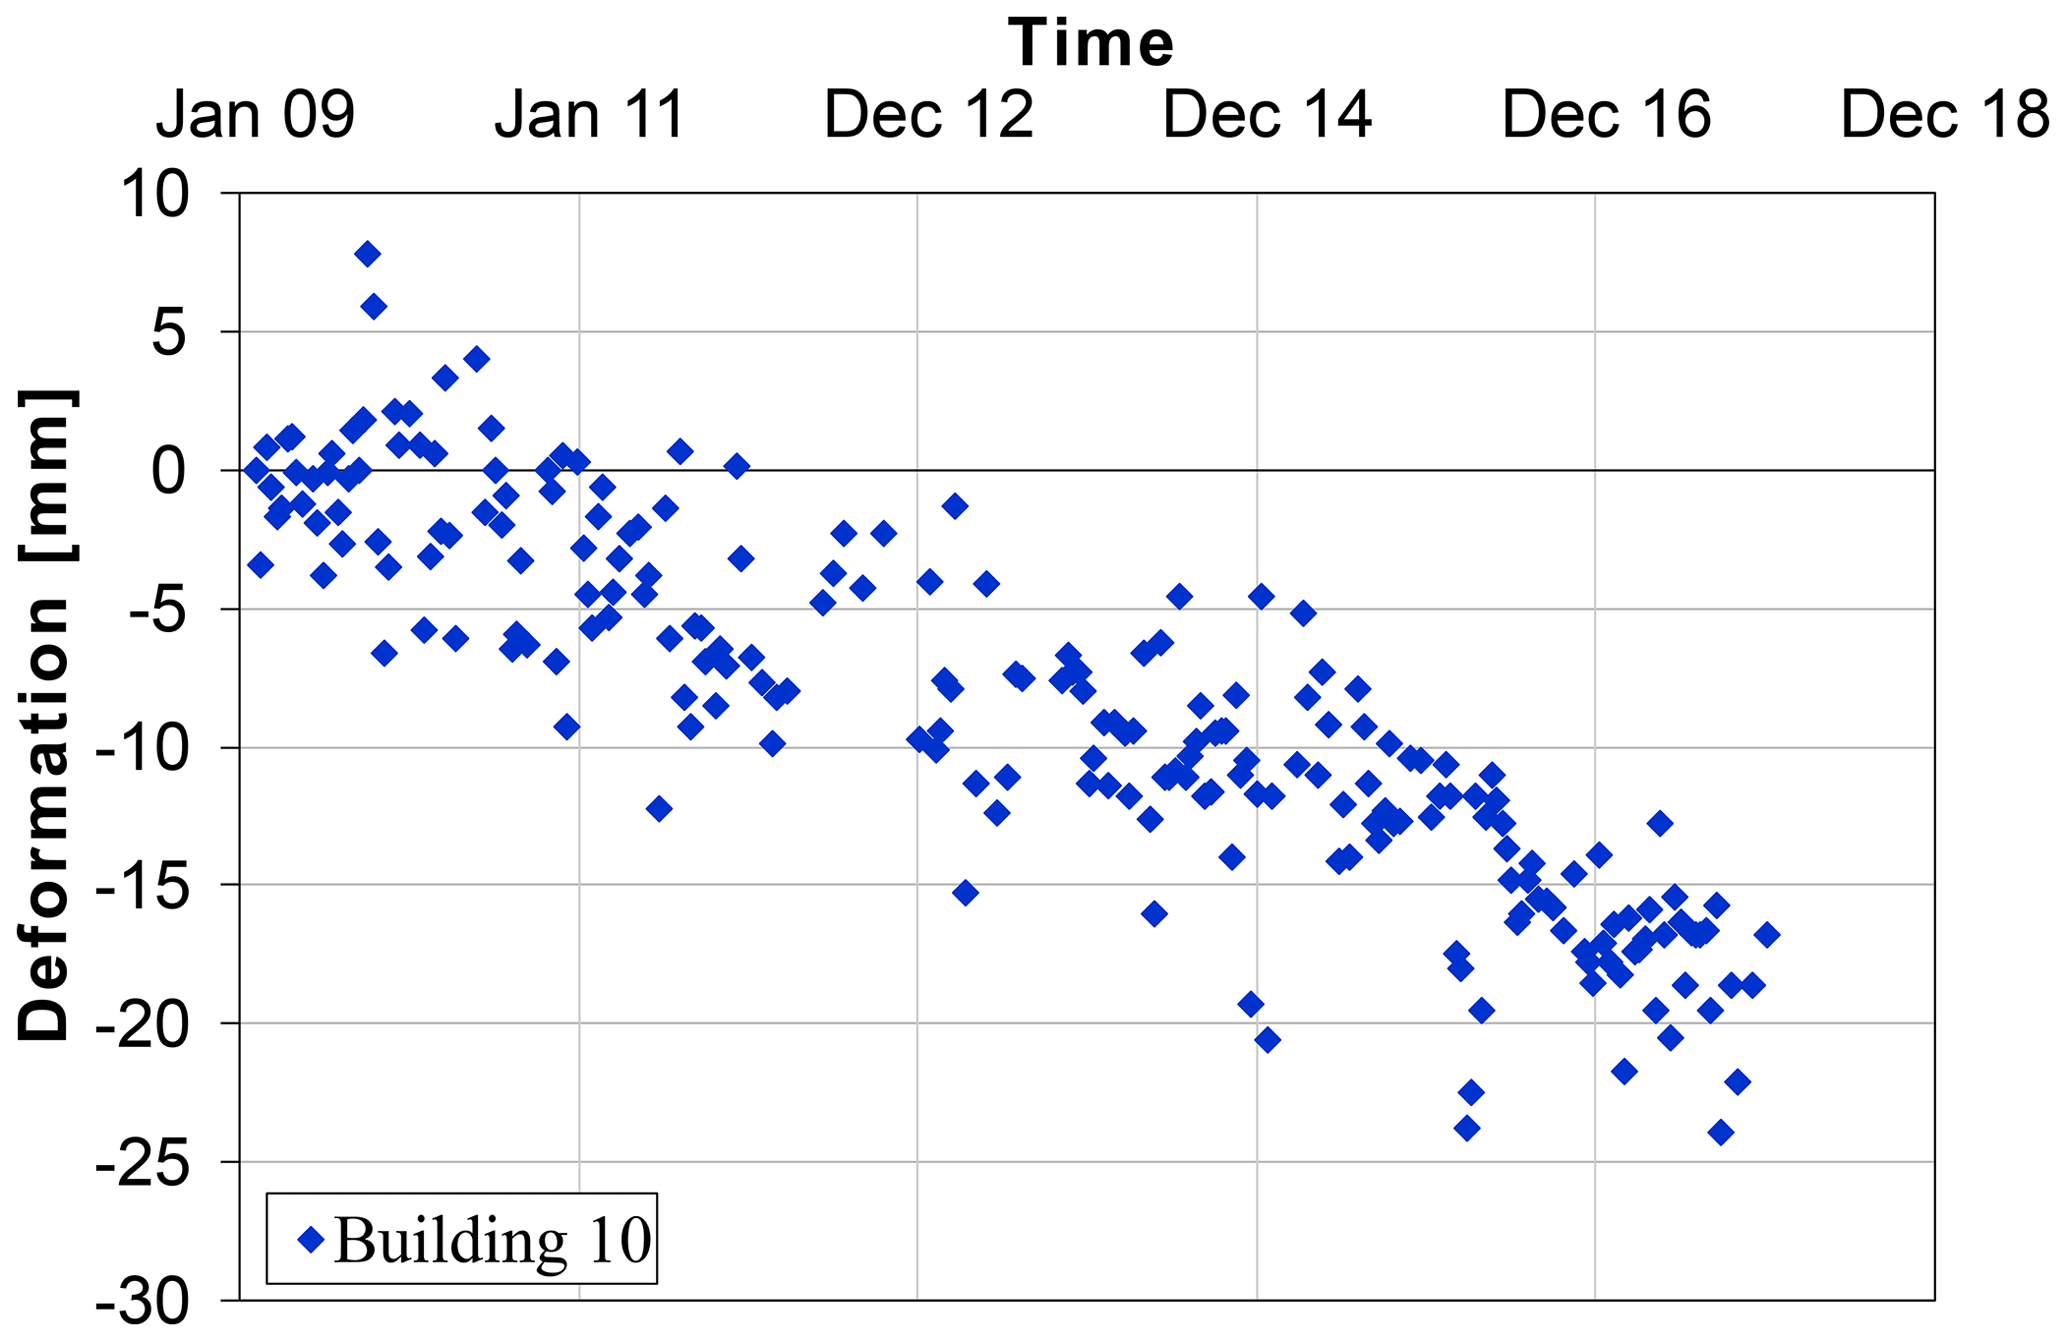
Two pre-processed InSAR data sets were supplied by SkyGeo: a general data set covering the entire city (2009–2018), and a locally optimized InSAR data set (2014–2019). The locally optimised data set gives a larger number of data points and better reliability than the general Amsterdam InSAR data set. The accuracy of the InSAR measurements has not be assessed by direct comparison with reference measurements e.g. from permanent GNSS stations. Every InSAR processing uses 2000 to 3000 of the most stable data points in a radius of 5 km around the area of interest to determine reference time series. The precision, expressed as the a-priori standard deviation, is approximately 3 mm (Marinkovic et al., 2007).
For all InSAR datasets the deformation in the direction of sight of the satellite (line-of-sight deformation) is converted to the vertical deformation using the incidence angle of 31.1∘. This procedure assumes that the buildings do not move in the horizontal direction because their movement results from subsidence processes acting over a larger area. The analysis only uses InSAR data points with an elevation at least 2.5 m above street level to make sure that the points represent the buildings.
The data set includes all points within 2 m outside the footprint of the buildings, because the location precision of the InSAR points is 1 to 2 m (SkyGeo, 2020). Figure 2 gives an example of an InSAR time series.
2.2 Procedure
The procedure to determine the measurement reliability has a statistical basis. The final result of the procedure is the probability that the deformation rate exceeds the threshold of 2 mm yr−1. The probability is calculated from the test statistic assuming a Student t distribution with n−2 degrees of freedom. Here, rate is the deformation rate (positive when downward), srate is its standard deviation and n is the number of observations in the time series.
If this probability is larger than 5 %, the building is tagged for further investigation of its foundation. It is not enough to determine the average deformation rate, since it does not consider the scatter of the measurements. For this reason, the reliability of its outcome is unknown.
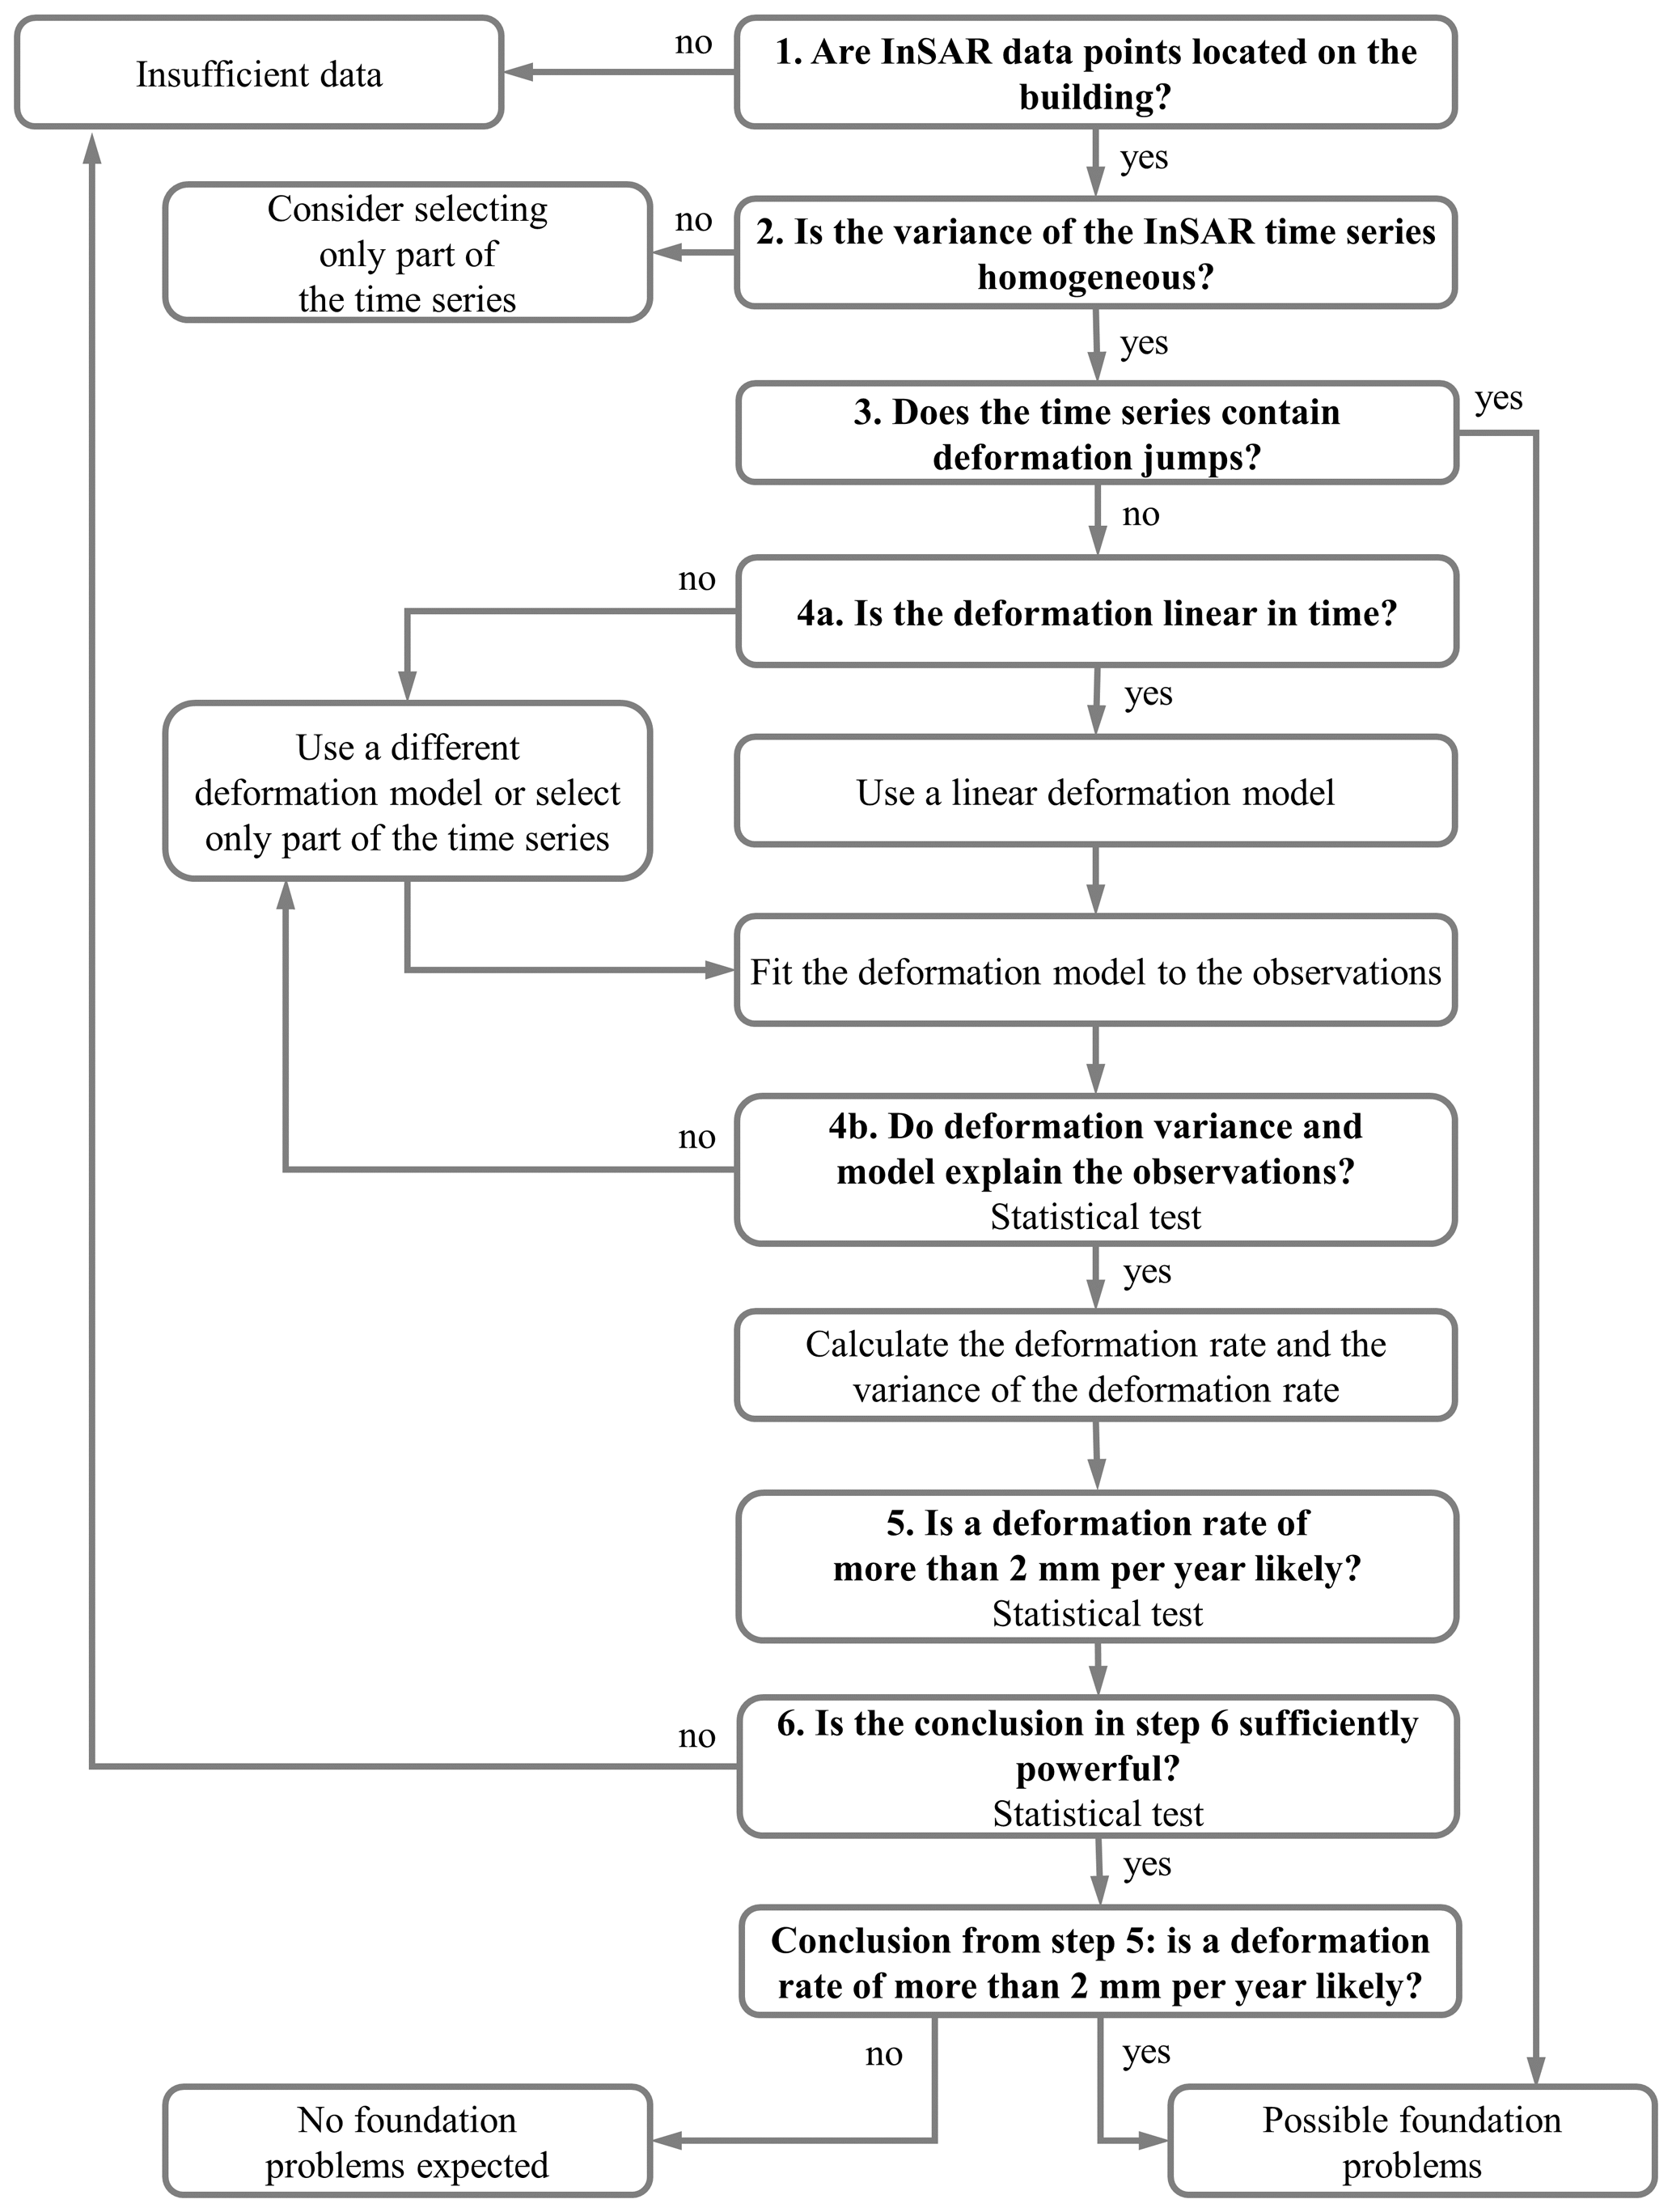
Figure 3Flow chart showing main steps of the procedure to determine the measurement reliability.
The main steps in the procedure are (Fig. 3):
-
Visualisation in GIS to assess the coverage of the data points.
-
Assessment of the homogeneity of the variance in the time series. The assessment of homogeneity is done visually.
-
Assessment of the presence of sudden jumps in deformation. These jumps may indicate sudden changes in the environment that affect the foundation of the buildings, such as groundwater extraction or foundation repairs. InSAR measurements may also be affected by changes to the rooftops of the buildings
-
Statistical testing of the linearity of the deformation in time. This is done by fitting a linear regression line through the measurements and determining the standard error of the difference between measurements and regression line (residuals). The standard error of the residuals is tested against the a-priori (common) standard deviations that can be expected for reliable measurements as given in Sect. 2.1. If the probability that the standard error of the residuals exceeds the a-priori standard deviation is equal to or smaller than 5 %, the assumption of linearity is not rejected.
-
Statistical testing if the deformation rate exceeds 2 mm yr−1. If the probability that the deformation rate exceeds 2 mm yr−1 is equal to or smaller than 5 %, the assumption that the foundation of the building is solid is not rejected. In other words: the probability that a building with a solid foundation is wrongly considered to have a bad foundation is 5 % at most.
-
Statistical testing of the power of the conclusion in step 5. If the probability that a building with a bad foundation is wrongly considered to have a solid foundation is larger than 5 %, the conclusion from step 5 is rejected. In other words: the probability that a building with a bad foundation is wrongly considered to have a solid foundation is 5 % at most.
The procedure was applied to three case studies in the Amsterdam inner-city. The results of one case study are shown here in detail. The case study involved 42 buildings. A total number of 67 levelling markers were installed on 38 buildings. Six levelling measurements were made between September 2016 and November 2017. The general Amsterdam InSAR data set contained 151 data points with measurements between January 2014 and January 2019, the locally optimised InSAR data set contained 546 data points with measurements between February 2009 and January 2018.
Figure 4 gives three maps of the buildings with the data points of the levelling, the general Amsterdam InSAR data set and the locally optimized InSAR data set. Green data points indicate that the probability that the deformation rate exceeds 2 mm yr−1 is equal to or smaller than 5 %. These buildings are assumed to have a solid foundation. Red data points indicate that the probability that the deformation rate exceeds 2 mm yr−1 is larger than 5 %. These buildings may experience foundation problems. White data points indicate that either the time series is not linear in time, or that the scatter in the measurements is larger than usual. These data points are not reliable and excluded from further analysis.
Figure 4Maps showing the results of the analysis for levelling (a) and two InSAR data sets (b) and (c). The building footprints have been anonymised.
4.1 General
A direct comparison between levelling and satellite measurements is meaningless for several reasons. Firstly, the location of the data points on the buildings is different. The levelling markers are located low in the facade of the buildings. The InSAR data points are located on the rooftops. This implies that the deformation observed in the levelling is determined foremost by the behaviour of the foundation. The deformation observed through the satellite is also determined by the deformation of the building itself.
Secondly, the levelling measures vertical deformation, the satellite data points are assumed to move only in the vertical direction. If in reality the data points also move horizontally this will affect the interpreted vertical deformation.
Thirdly, both types of measurements are sensitive in a different way to external changes such as seasonal effects. The frequency of the levelling is too low and the scatter too high to detect seasonal effects. Some InSAR time series display seasonal effects with a deformation amplitude up to several millimetres. Both types of measurements are sensitive to deformation of their reference points. Many levelling time series of neighbouring datapoints exhibit simultaneous random movements up and down in the order of several millimetres. This indicates a movement of the reference point. Also, the InSAR reference points show a periodic movement with an amplitude of 0.5 mm.
The locally optimised InSAR data set contains a significant number of time series with a non-linear trend, with the deformation rate increasing or decreasing in time. The current procedure can only handle linear trends. For this reason, the data set has been cut in two, and the analysis has been performed on the 2014–2019 data only. This operation produced a data set consisting of the most recent and relevant observations.
4.2 Case study
Figure 5 compares the deformation rates with probability larger than 5 % that the deformation rate exceeds 2 mm yr−1, for the buildings in the case study presented in Sect. 3.
The deformation rate in the levelling time series usually is smaller than in the satellite time series. The reason is not clear but could for example be due to settlement of the reference points.
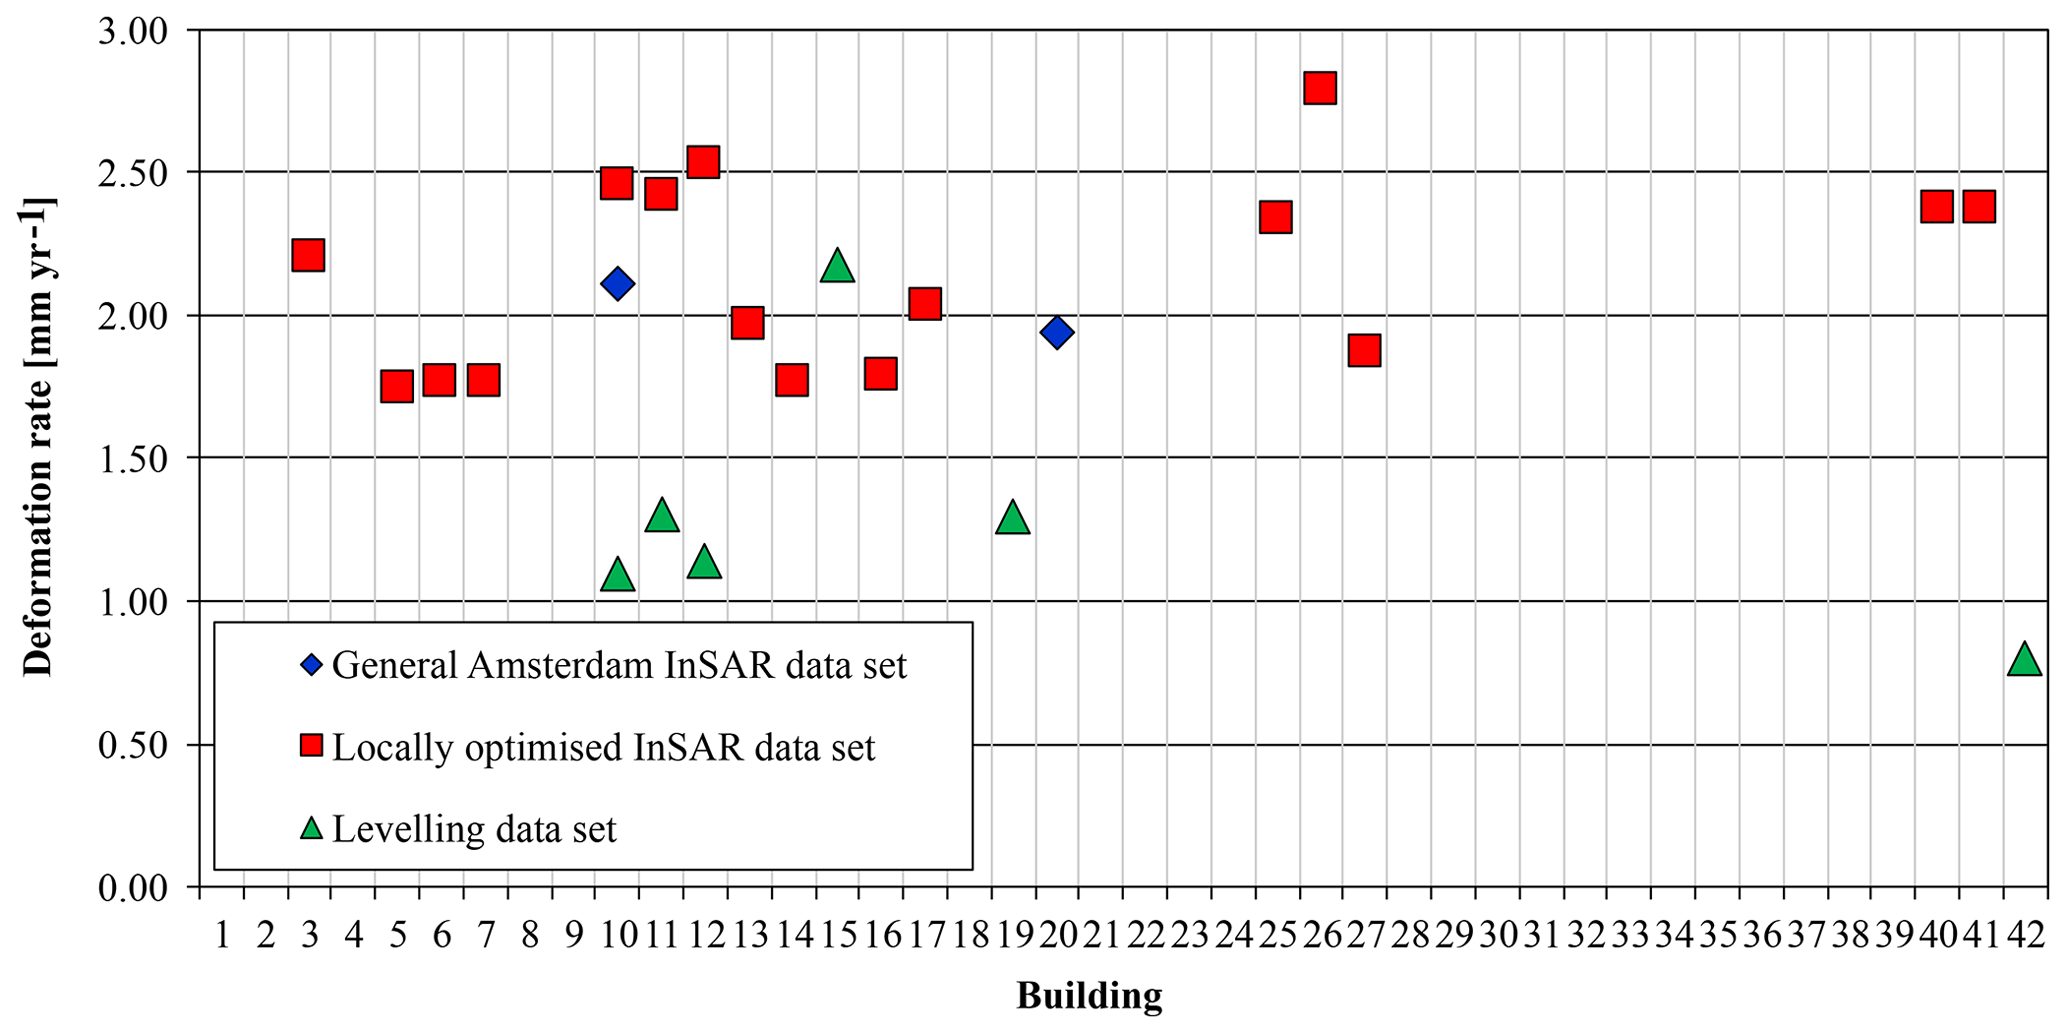
Figure 5Buildings in the case study with deformation rates exceeding 2 mm yr−1 with probability larger than 5 %, identified by using the levelling data set and the two InSAR data sets.
The locally optimised InSAR data set shows the largest number of buildings with data points with probability larger than 5 % of exceeding the threshold deformation rate. Most of these data points are located in the middle or back of buildings, although data points in the front facades facing the canals indicate a probability less than 5 % of exceeding the threshold. At the moment is not clear how this observation should be interpreted in terms of the condition of the foundation of the building.
The general Amsterdam InSAR data set hardly has buildings with probability larger than 5 % of the deformation rate exceeding 2 mm yr−1. This may be caused by a large number of non-linear time series that were eliminated in step 4 of the procedure.
Both levelling and InSAR measurements indicate that the probability of a deformation rate exceeding 2 mm yr−1 is larger than 5 % for buildings 10, 11 and 12. Also, the levelling indicates that the probability of a deformation rate exceeding 2 mm yr−1 is larger than 5 % for buildings 15, 19 and 42, whereas the InSAR measurements do not. The levelling time series for these buildings may be less reliable because of jumps up to 1.5 mm between subsequent measurements and the limited (4 to 6) number of measurements in the time series. The jumps do not correlate with a seasonal pattern.
Because of the large number of measurements in a time series the conclusions about the deformation rate are much more robust for the InSAR measurements in comparison with the levelling. The standard deviation of the deformation rate of a levelling time series in the case study typically is in the order of 0.5 mm. This implies that a data point may have a 5 % probability that the deformation exceeds 2 mm yr−1, although its average deformation rate is below 1 mm yr−1. This is the case for buildings 10, 11, 12 19 and 42 in Fig. 5. For the same case study, the standard deviation of the deformation rate of an InSAR time series typically is in the order of 0.05 mm. For this reason, InSAR measurements provide a much more reliable estimate of the deformation rate.
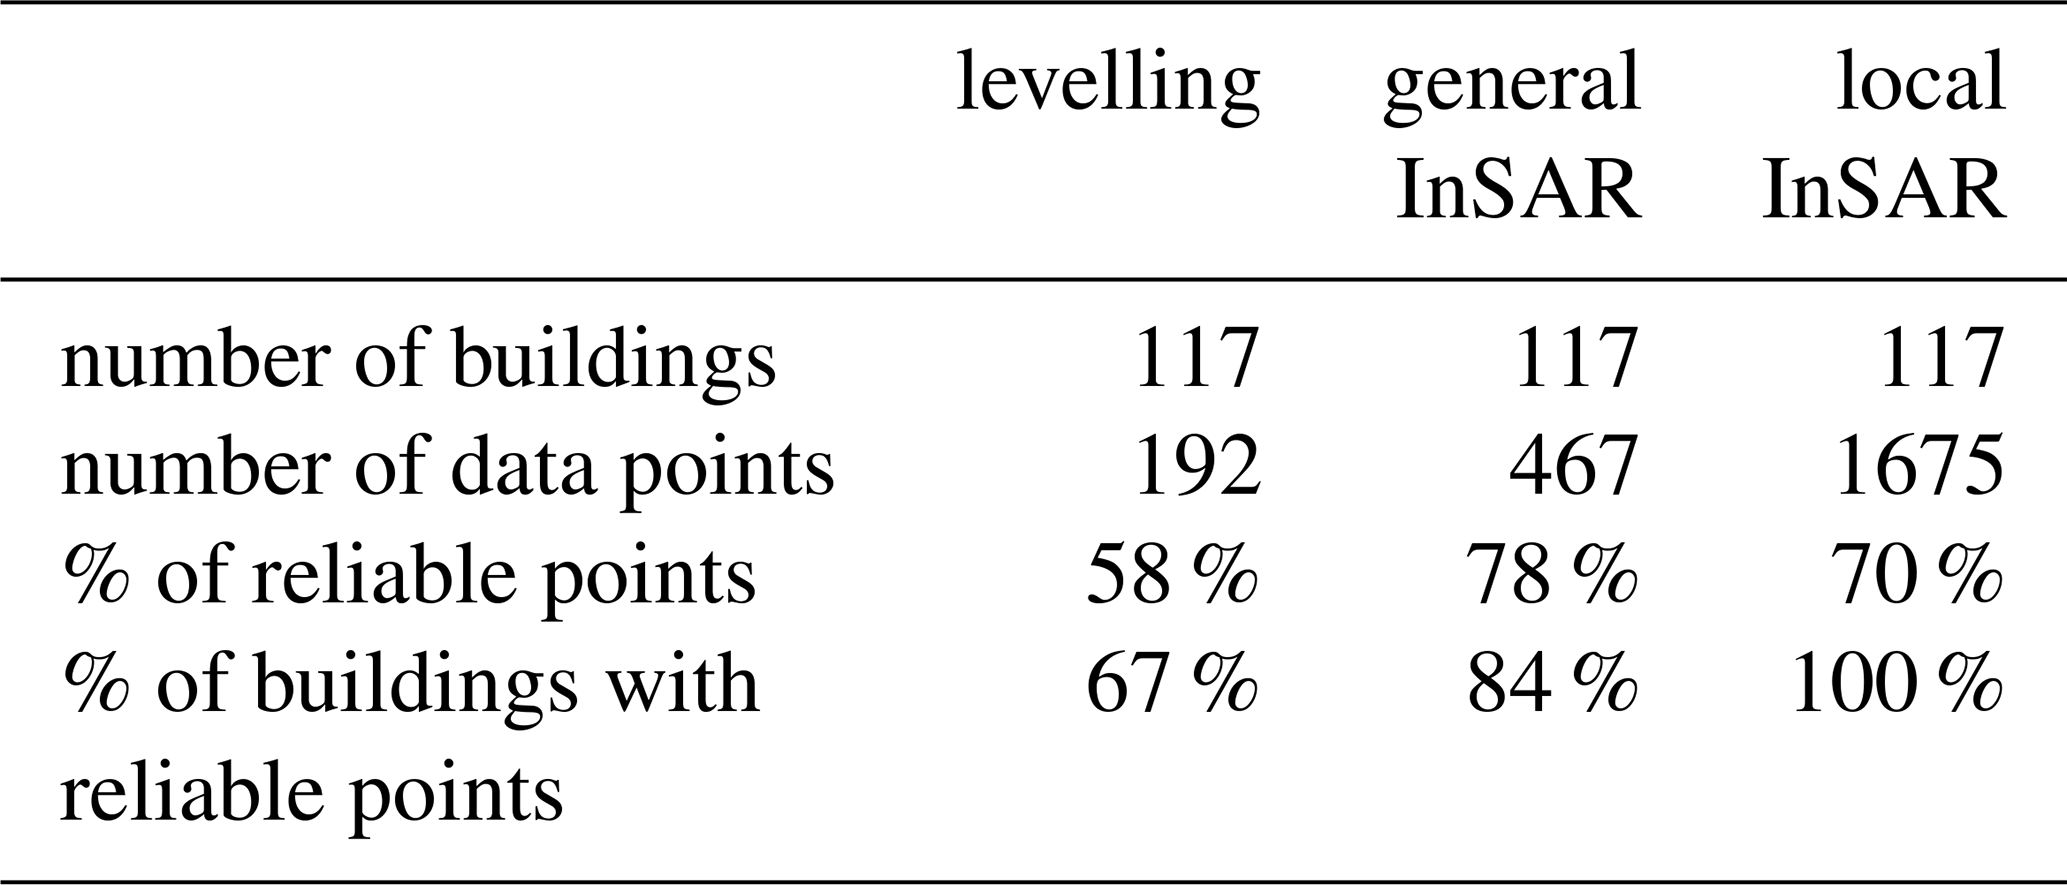
4.3 Coverage
Table 1 summarises the coverage of the different data sets for all three case studies. The traditional levelling is capable of providing a reliable conclusion for only 67 % of the buildings. The locally optimized InSAR data set has a 100 % coverage of the buildings, meaning that every building has one or more reliable data points.
5.1 Conclusions
Locally optimized PS-InSAR satellite measurements are most suitable for assessing the deformation rate of buildings in the Amsterdam inner-city. The case study presented shows that deformation rates of the satellite measurements are significantly higher than those of the levelling on the same buildings. The other two case studies (not shown in this paper) show a general agreement of the deformation rates of the levelling and the satellite measurements.
The locally optimised InSAR data set with measurements between 2014 and 2019 has reliable data points on 100 % of the buildings in all case studies. The large number of measurements in an InSAR time series makes the standard deviation of the deformation rate much lower than in a typical levelling time series, in spite of the larger scatter of individual InSAR measurements.
5.2 Recommendations
Future application of the procedure should include a comparison of the deformation rates derived from satellite measurements and the foundation condition of the buildings. This will improve the interpretation of the satellite measurements and reduce the number of false positives and false negatives. The improvement may include the interpretation of data points with high probability of the deformation rate exceeding 2 mm yr−1 that are not located near the facade of the buildings.
Also, the procedure may be extended to include analysis of non-linear trends such as second order trends and seasonal effects.
The underlying research data are not publicly accessible to protect the privacy of the owners of the buildings in the inner-city of Amsterdam.
AAMV performed the analysis and evaluation of the locally optimised InSAR dataset, using the methodology developed by JdJ. JdJ also performed the analysis of the levelling and general InSAR datasets. ModK provided the levelling data. MH provided technical support for the InSAR data. MK and ModK supervised the research.
The authors declare that they have no conflict of interest.
This article is part of the special issue “TISOLS: the Tenth International Symposium On Land Subsidence – living with subsidence”. It is a result of the Tenth International Symposium on Land Subsidence, Delft, the Netherlands, 17–21 May 2021.
This research has been supported by the Municipality of Amsterdam (order number 87387 OK) and Deltares (project 11203768-002).
Crux Engineering BV: Building Protocol. Guidelines and Roadmap for Geotechnical Risk Management of construction projects, 2014 (in Dutch).
de Jong, J. P.: Use of InSAR data for building deformation monitoring, M.S. Thesis, Technical University Delft, Delft, 2018.
European Space Association TSX (TerraSAR-X) Mission: TSX (TerraSAR-X) Mission, available at: https://earth.esa.int/web/eoportal/satellite-missions/t/terrasar-x, last access: 23 August 2019.
Marinkovic, P, Ketelaar, G., van Leijen, F., and Hanssen, R.: InSAR quality control: Analysis of five years of corner reflector time series, in: Fifth Int Workshop on ERS/Envisat SAR Interferometry, FRINGE07, Frascati, Italy, 26–30 November 2007.
SkyGeo: InSAR technical background, avaliable at: https://www.skygeo.com/insar-technical-background/, last access: 5 March 2020.
van Leijen, F.: Persistent Scatterer Interferometry based on geodetic estimation theory, PhD Thesis, Technical University Delft, Delft, 2014.
Venmans, A. A. M.: Reliable satellite monitoring of buildings near quay wall replacements, report 11202687-002-GEO-0003 v1.2, Deltares, Delft, 2019 (in Dutch).