the Creative Commons Attribution 4.0 License.
the Creative Commons Attribution 4.0 License.
 | 22 Apr 2020
Spatial–temporal characterization of land subsidence induced by large area distribution of recent dredger fill
Jinxin Lin
Hanmei Wang
Tianliang Yang
Xinlei Huang
Large-scale land subsidence often occurs after large-scale land formation caused by dredger fill, which affects the sustainable development of the region. In order to prevent and control land subsidence in the area with dredger fill, the characteristics of land subsidence and its main influencing factors need to be studied. A typical region was examined using geological survey data, land-level monitoring and comparative analysis, to provide insight regarding the variability of dredger-fill characteristics and impacts on land subsidence. The geological survey results provided the information about burial distribution characteristics of dredger fill and its underlying soil layers. The land-level monitoring results were analyzed to characterize the spatial–temporal distribution of land subsidence. The comparative analysis of land subsidence with the formation time, soil properties, thicknesses of dredger fill and the lower soft soil layer provided information about the different impacts. The monitoring results show that the land subsidence of dredger fill areas was substantially larger than that of adjacent areas. The later the filling was formed, the thicker the filling is, and the more clay-rich the soil property and the thicker the soft soil layer is, the larger the land subsidence is. Finally, the future trend of land subsidence in the study area are given and some suggestions on the prevention and control of land subsidence are also given.
- Article
(1791 KB) - Full-text XML
- BibTeX
- EndNote


Many coastal cities require large-scale urban construction and expansion of urban development space, as the rapid development and the population increases. But limited land resources seriously restrict the development. Reclamation is an important measure to solve the shortage of land resources in coastal cities. It is also a way to dredge silt and clean the coastal water environment (Huabo et al., 2016). There is a Chinese coastal city with substantial historical land subsidence (Shujun et al., 2016), needed to expand urban development space and therefore formed a large area using dredger filling distribution techniques (Linbo et al., 2019).
The abovementioned city is situated on the west coast of the Pacific Ocean, the east coast of the Asian continent, and the central point of China's north–south coast. There is a large area of dredger fill in the coastal area in the abovementioned city (Chen et al., 2018; Linbo et al., 2019). The area was rapidly formed and because it was underconsolidated, and it settled. Moreover, the large area of dredger fill caused additional subsidence from compaction of the lower soft soil layer. The research on dredger fill has mainly focused on the engineering characteristics of dredger fill, the deformation and strength of dredger fill, and the engineering treatment technology of dredger fill foundations. Few studies have been done on the characteristics of regional land subsidence in large areas of dredger fill. In these new large land areas, InSAR is a good way to study land subsidence (Qing et al., 2011). However, the accuracy and reliability of InSAR monitoring results are not as good as that of high-precision leveling monitoring.
This study's objectives are to understand the impact of dredger fill and provide useful information for coastal city planning and construction. Based on the variable distribution of dredger fill in a Chinese coastal city and the land-level monitoring results over several years, this paper analyzes the spatial and temporal characteristics of land subsidence induced by the distribution of recent dredger fill over a large area and studies the influence of the differences of dredger fill soil properties, thickness, formation time and the underlying soil layer on land subsidence.
There are five main confined aquifers in the study city. From shallow to deep, they are called the first, second, third, fourth, and fifth confined aquifers respectively. Groundwater exploitation in these aquifers is the main cause of land subsidence in the study city (Yun et al., 2015).
With field investigation and collected groundwater exploitation data in the study city, a new coastal land formation that did not undergo groundwater exploitation from 2013 to 2017 was selected as the study area. In the study area, the groundwater level of five confined aquifers steadily increased during that period. Water level of the first confined aquifer increased by about 0.5 m. Water levels of the second, third and fourth confined aquifer increased by between 2 and 3 m. And water level of the fifth confined aquifer increased by about 5.0 m. Therefore, the influence of groundwater on land subsidence should not be the main factor in the study area. Additionally, there were no large-scale construction activities from 2013 to 2017 in the study area. We conclude that the large-scale distribution of dredger fill is the main factor causing land subsidence in the study area.
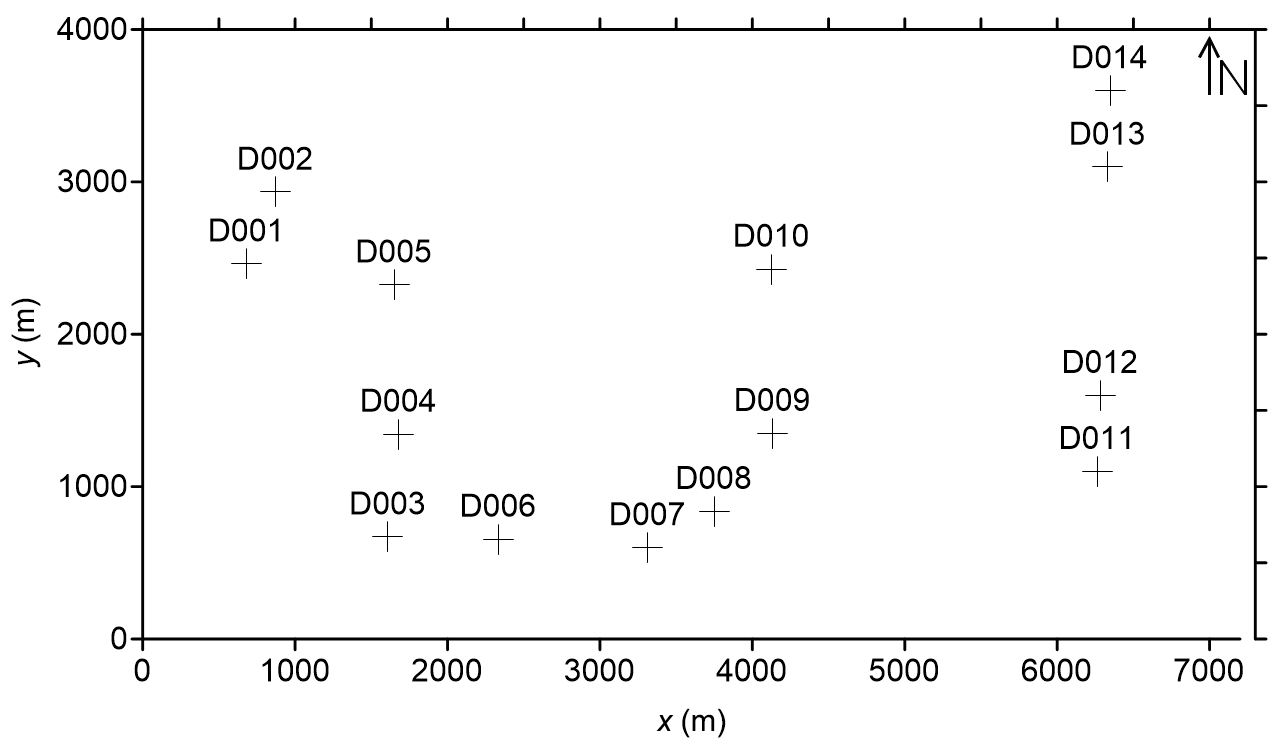
To provide insight regarding the variability of dredger-fill characteristics and impacts on land subsidence, 14 leveling points were selected for comparison. Their relative positions and numbers are shown in Fig. 1. The ocean lies to the east of these leveling points.
2.1 Influences of formation time of dredger fill
In the study area, the dredger fills nearer to the sea were formed later. The formation time has a great influence on the recent land subsidence. In order to understand this effect, we assigned the same properties and thicknesses but different formation times to make the comparison.
In leveling points D004 and D005, dredger fill was formed earlier in the process. In D009 and D010, dredger fill was formed later. The cumulative subsidence of D004, D005, D009 and D010 from 2013 to 2017 was 26.03, 28.42, 45.95, and 59.25 mm, respectively (Fig. 2). The newer the fill is, the larger the accumulated subsidence was.
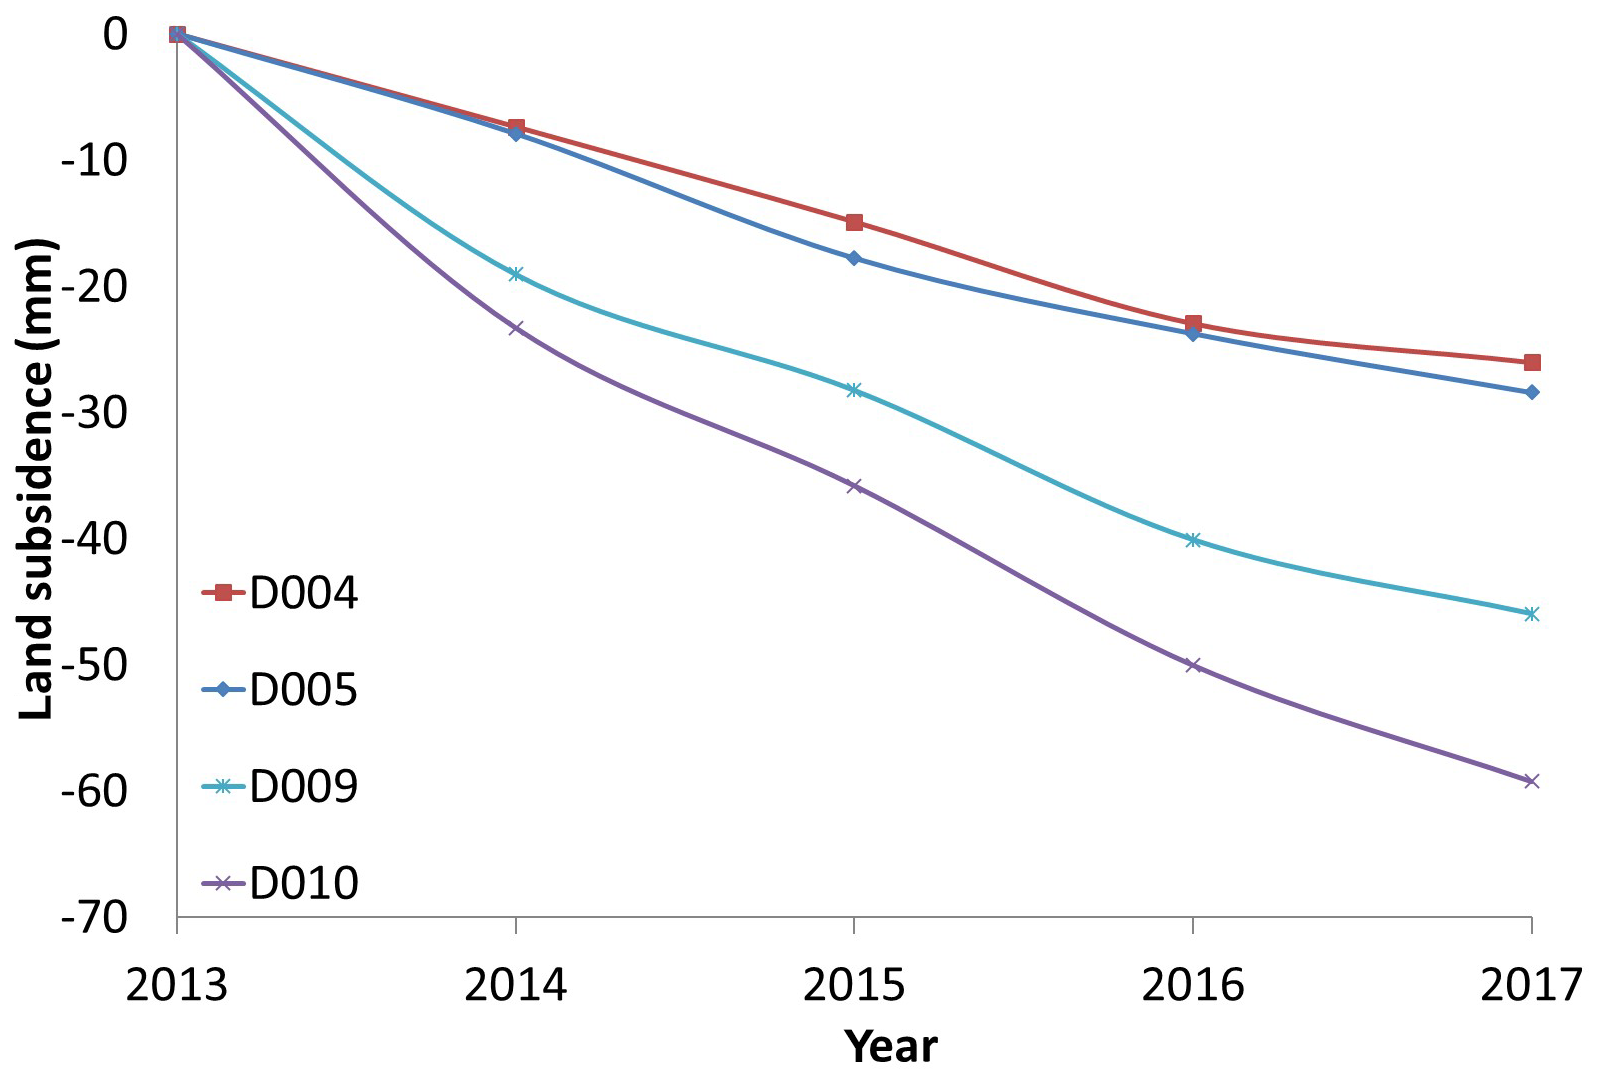
Figure 2Land subsidence curves (D004 and D005 dredger fill formed earlier, D009 and D010 formed later).
Since some leveling points providing comparative data were buried in 2012–2013, in order to reduce the impact of the stability of the monitoring facilities, the data after 2013 was used in the comparative study.
2.2 Influences of soil properties of dredger fill
Dredger fill can be divided into silty soil and clay soil according to filling composition in the study area. For this comparison, we assigned the same formation time and thicknesses of dredger fill but different soil properties to make the comparison.
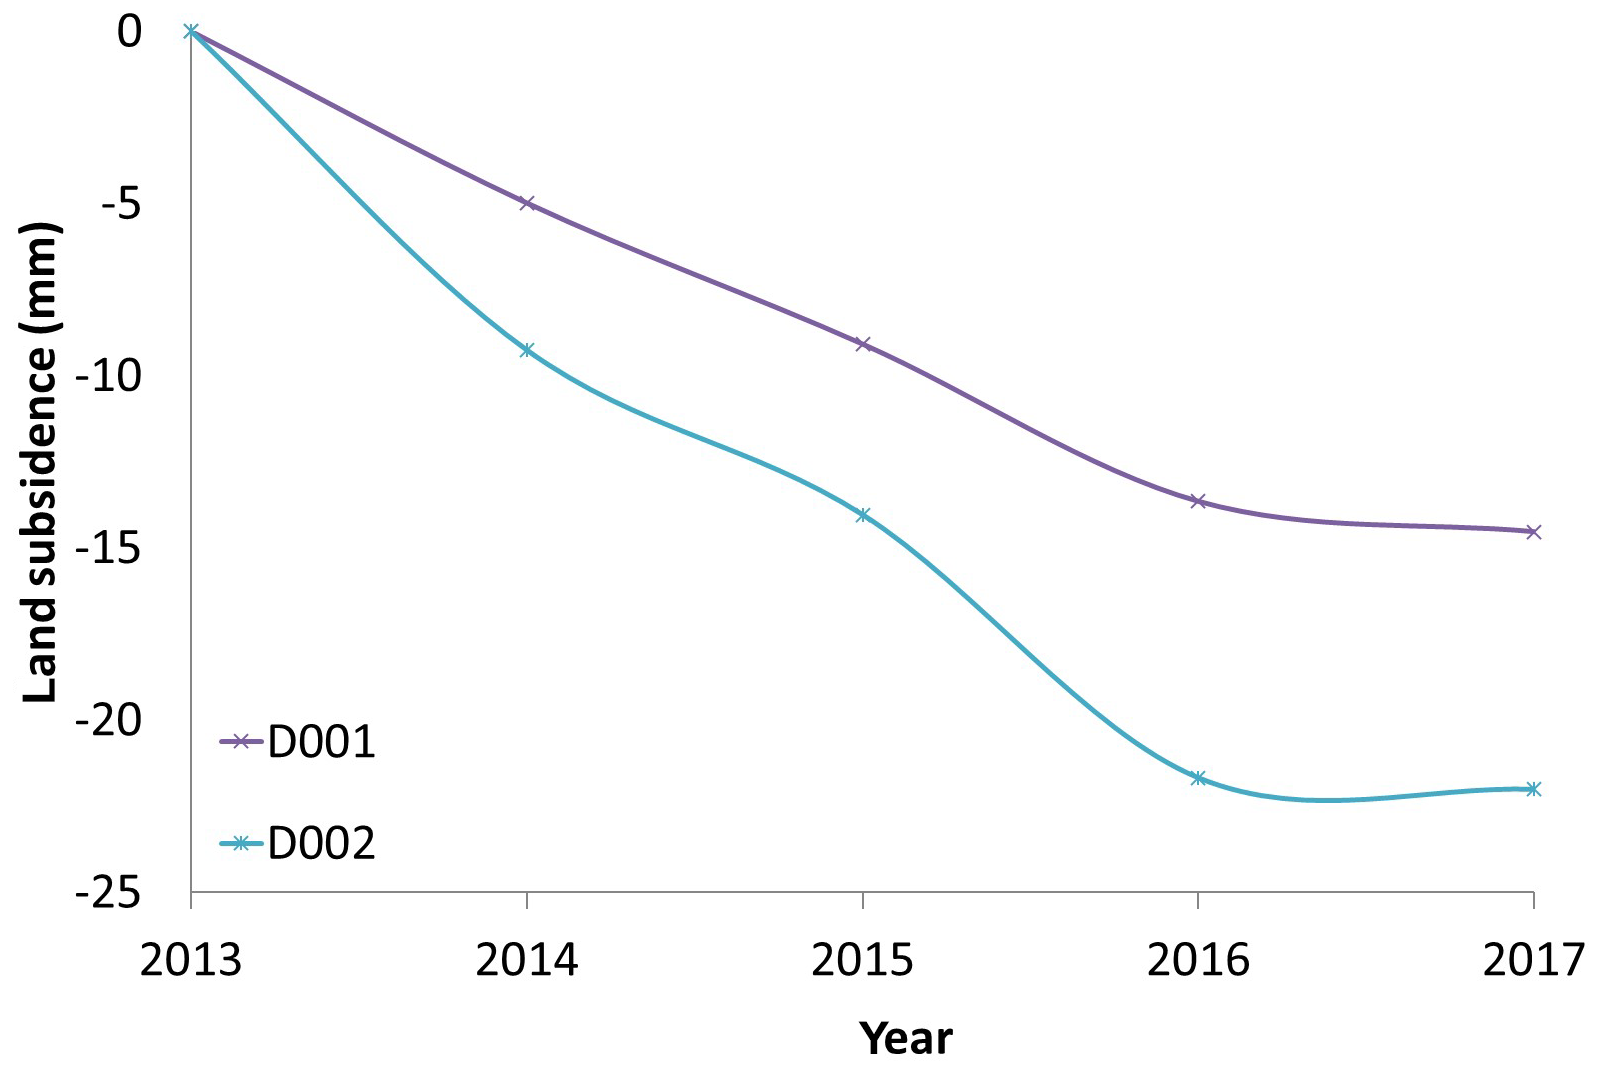
Leveling point D001 is where there is silty dredger fill and D002 is where there is clay dredger fill. The cumulative subsidence of D001 and D002 from 2013 to 2017 was 14.54 and 22.01 mm, respectively (Fig. 3). So when the thickness, formation time and underlying soil layer are similar, the presence of clay soil resulted in more subsidence than that of silty soil. Furthermore, the subsidence rate decreases with time.
2.3 Influences of the thickness of dredger fill
To examine the effect on subsidence from the thickness of dredger fill, we assigned the same formation time and soil properties but different thicknesses of dredger fill to make the comparison.
Leveling points D014 and D013 are where the thickness of dredger fill is about 3.5 m. D012 and D011 are where the thickness of dredger fill is about 2.5 m. The cumulative subsidence of D014, D013, D012 and D011 from 2013 to 2017 was 109.84, 91.79, 77.92, and 73.52 mm, respectively (Fig. 4). Divided by their respective thicknesses, the computed results are 31.38, 26.23, 31.17, and 29.41 mm m−1. These values are very similar; therefore, the subsidence was approximately proportional to the thickness of dredger fill.
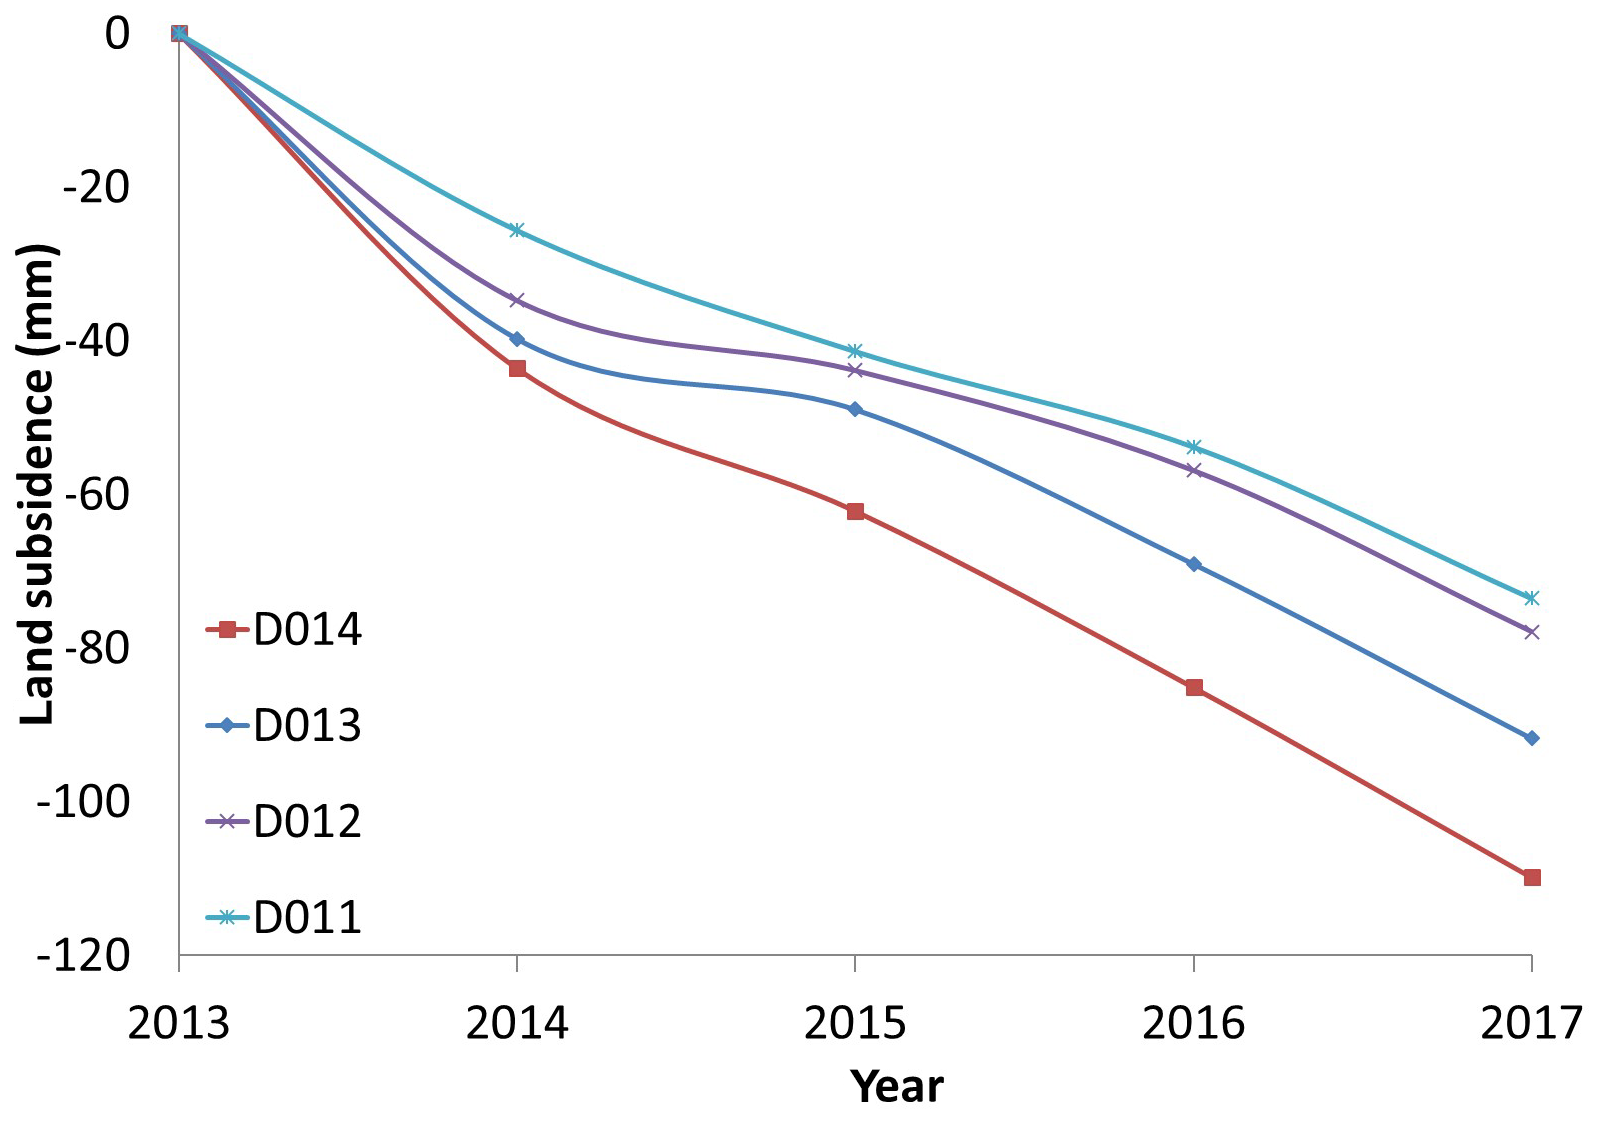
Figure 4Land subsidence curves (the thickness of dredger fill at D014 and D013 is about 3.5 m; the thickness of dredger fill at D012 and D011 is about 2.5 m).
2.4 Influences of the thickness of lower soft soil layer
According to “Code for investigation of geotechnical engineering” (DGJ08-37-2012), the engineering geological layers are unified in the study city. There are 11 engineering geological layers and several sublayers 100 m below the surface. The sequence numbers are (1)1, (1)2, (1)3, (2)1, (2)2, (2)3, (3)1, (3)2, (3)3, (4), (5)1, (5)2, (5)3, (5)4, (6)1, (6)2, (6)3, (6)4, (7)1, (7)2, (8)1, (8)2, (9)1, (9)2, (10), and (11). The order of the lower soil layer (within 40 m depth) from top to bottom below the dredger fill in the study area are shallow sand layer (2)3, soft soil layer (3) + (4), clayey soil layer (5), hard soil layer (6) and lower sand layer (7). The sequence numbers of dredger fill layers are (1)3. The distribution of dredger fill adds a load to the underlying layers, which could cause compaction of those underlying soil layers. The soft soil layer (3) + (4) is highly compressible and sensitivity.
We assigned the same formation time, soil properties, and thicknesses of dredger fill but different thicknesses of the soft soil layer (3) + (4) to make the comparison.
Leveling point number D008 is where the thickness of the soft soil layer (3) + (4) is about 7 m; D007 and D006 are where the thickness of the soft soil layer (3) + (4) is about 5 m; and D003 is where the thickness of the soft soil layer (3) + (4) is about 3.5 m. The cumulative subsidence of D008, D007, D006 and D003 from 2013 to 2017 was 58.77, 43.48, 43.56, and 32.09 mm, respectively (Fig. 5). Divided by their respective thicknesses, the computed results are 8.40, 8.70, 8.71, and 9.17 mm m−1. These values are very close; therefore the subsidence is approximately proportional to the thickness of the soft soil layer (3) + (4).
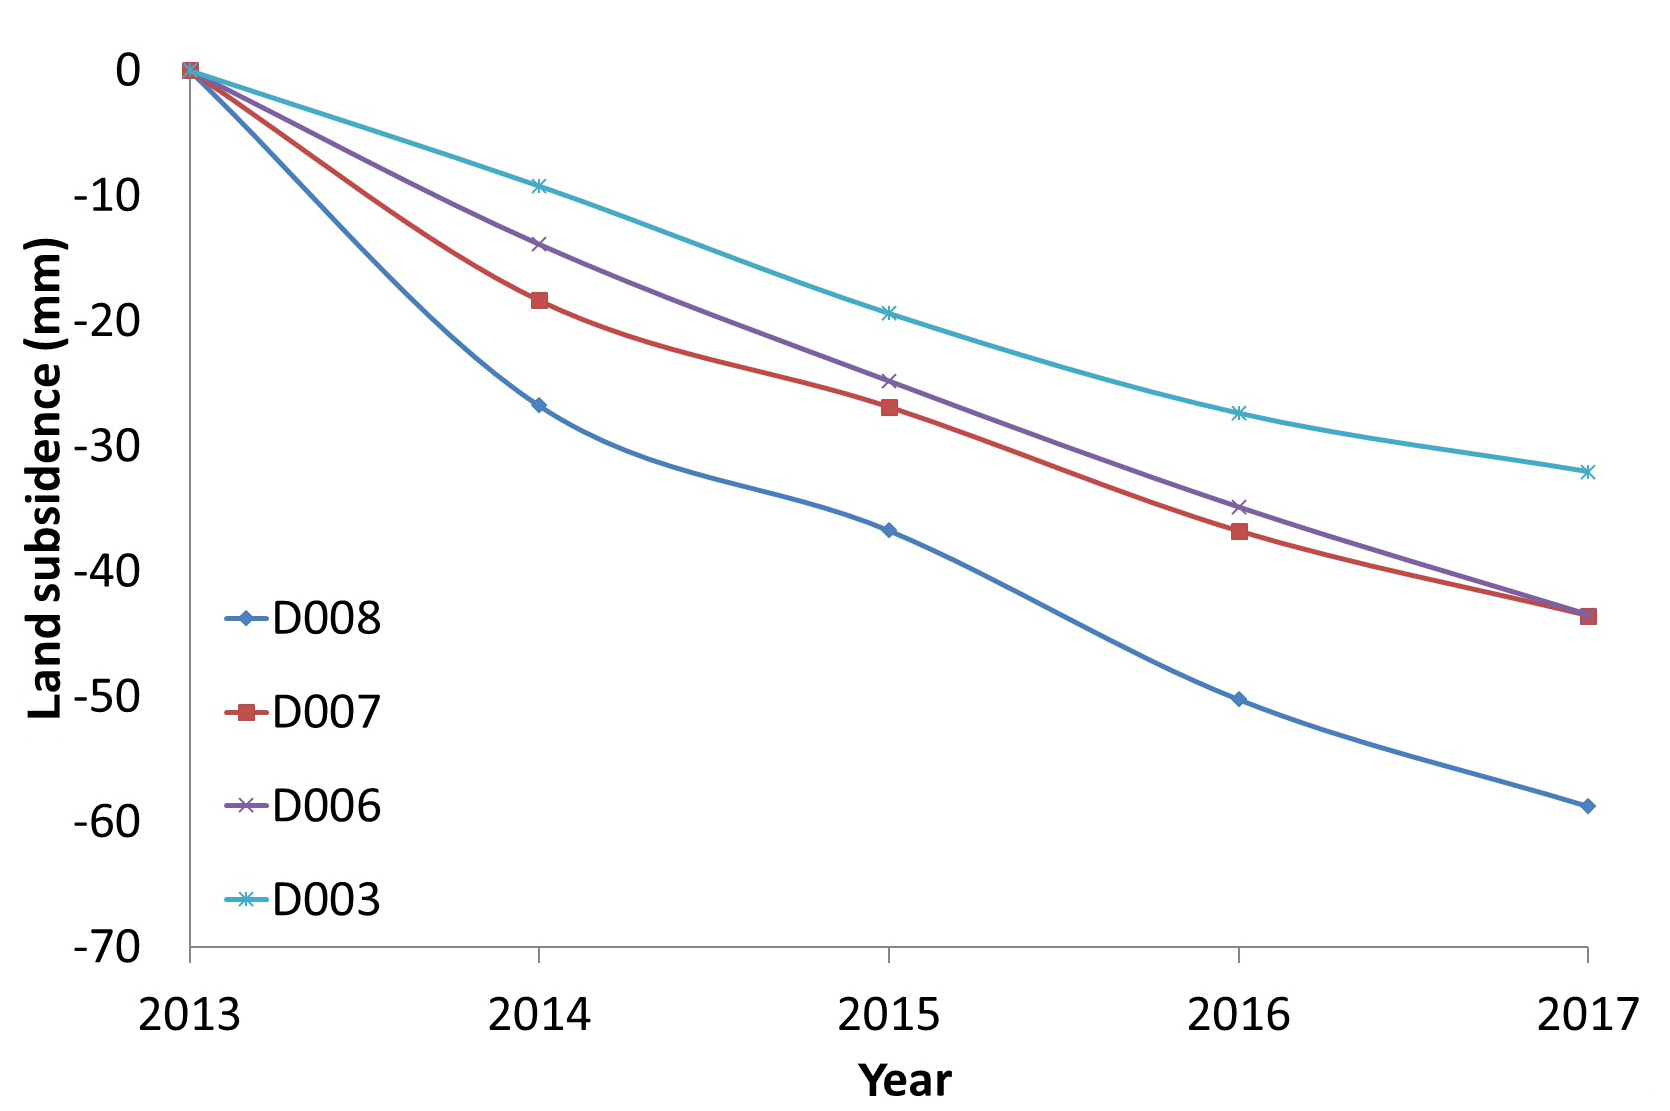
Figure 5Land subsidence curves (the thickness of the lower soft soil layer (3) + (4) at D008 is about 7 m, the thickness of layer (3) + (4) at D007 and D006 is about 5 m, and the thickness of layer (3) + (4) at D003 is about 3.5 m).
According to the law “Regulations of Shanghai Municipality on the Administration of Prevention and Control of Ground Subsidence” issued by Shanghai government in 2013 and the “Shanghai Urban Master Plan (2017–2035)” issued by Shanghai government in 2018, the possibility of large-scale groundwater exploitation in the study area is very small. Our analysis indicated the main factors influencing subsidence have been, and are likely to be in the future, the large-scale distribution of dredger fill and engineering construction activities. The later the filling is formed, the thicker the filling and the more clay-rich the soil will be; the thicker the soft soil layer, the larger the land subsidence effect will be.
According to the definition of the average consolidation degree of soil layer,
where Ut is the average degree of consolidation of the soil layer, s∞ is the final compaction of the soil layer, and st is the compaction of the soil layer in time t.
The relationship between the degree of consolidation and time of large area dredger fill due to self-weight pressure and its load on lower soil layer can be written in the following unified form:
where a, b are the parameters. Then,
Equation (3) was used to fit the multi-year leveling monitoring data. The fitting results are shown in Fig. 6 and indicate that subsidence caused from the impact of the dredger fill gradually diminishes.

The distribution of dredger fills over a large area is the main influencing factor of land subsidence in the study area. The differences of formation time, soil properties, thickness of dredger fill, and the thickness of soft soil layer result in differential land subsidence in the study area. The analysis presented here indicates that land subsidence will continue but subsidence rates will decrease and eventually stop.
This study needs further research and more data to support the research conclusion more comprehensively, and to establish the quantitative relationship between the various elements of dredger fill and land subsidence. Based on the investigation and monitoring results, it is necessary to study the prediction method and numerical calculation model of land subsidence in the dredger fill area.
In order to provide more accurate land-subsidence information for government decision-making in the large area of dredger fill, we should strengthen the construction of monitoring networks to provide early warnings of subsidence risk. Dredger fill treatment should be carried out before construction, strict groundwater control should be implemented, and urban construction should be planned rationally.
The raw/processed data required to reproduce these findings cannot be shared at this time, as the data also forms part of an ongoing study.
JL provided the main research ideas and was responsible for writing the paper. HW and TY contributed to the comparative analysis of some influencing factors. XH was responsible for drawing the main figures.
The authors declare that they have no conflict of interest.
This article is part of the special issue “TISOLS: the Tenth International Symposium On Land Subsidence – living with subsidence”. It is a result of the Tenth International Symposium on Land Subsidence, Delft, the Netherlands, 17–21 May 2021.
The authors thank the geological environment monitoring department of the Shanghai Institute of Geological Survey for the monitoring data.
This research has been supported by the IGCP (grant no. IGCP-663), the Shanghai Science and Technology Commission (grant no. 18DZ1201100), and the Shanghai Municipal Bureau of Human Resources and Social Security (“Study on land subsidence mechanism and safety warning in new land reclamation area”).
Chen, L., Ren, C., and Zhang, B.: Spatiotemporal Dynamics of Coastal Wetlands and Reclamation in the Yangtze Estuary During Past 50 Years (1960s–2015), Chinese Geogr. Sci., 28, 386–399, https://doi.org/10.1007/s11769-017-0925-3, 2018.
Huabo, D., Hui, Z., and Qifei, H.: Characterization and environmental impact analysis of sea land reclamation activities in China, Ocean Coast. Manage., 130, 128–137, https://doi.org/10.1016/j.ocecoaman.2016.06.006, 2016.
Linbo, W., Jianxiu, W., and Jie, Z.: Multi-scale geotechnical features of dredger fills and subsidence risk evaluation in reclaimed land using BN, J. Mar. Georesour. Geotec., https://doi.org/10.1080/1064119X.2019.1644406, online first, 2019.
Qing, Z., Hui, L., and Wei, G.: InSAR detection of residual subsidence of an ocean reclamation engineering project a case study of Hong Kong International airport, J. Oceanogr., 67, 415–426, https://doi.org/10.1007/s10872-011-0034-3, 2011.
Shujun, Y., Yuqun, X., and Jichun, W.: Progression and mitigation of land subsidence in China, Hydrogeol. J., 24, 685–693, https://doi.org/10.1007/s10040-015-1356-9, 2016.
Yun, Z., Jichun, W., and Yuqun, X.: Land subsidence and uplift due to long-term groundwater extraction and artificial recharge in Shanghai, China, Hydrogeol. J., 23, 1851–1866, https://doi.org/10.1007/s10040-015-1302-x, 2015.