the Creative Commons Attribution 4.0 License.
the Creative Commons Attribution 4.0 License.
 | 05 Jun 2018
Understanding the potential sources and environmental impacts of dissolved and suspended organic carbon in the diversified Ramganga River, Ganges Basin, India
Mohd Yawar Ali Khan
Fuqiang Tian
The river network is one of the important transporters of nutrients from the environment and land masses to the oceans and regularly provides storage for several compounds. The variations in suspended and dissolved discharge of the river are more substantial than the changes in water discharge. (Suspended and dissolved) organic carbons (SOC and DOC) are imperative segments in the carbon cycle and fill in as essential food sources for amphibian sustenance networks. In the present study, 26 samples of water were collected from different locations over the 642 km stretch of the Ramganga River and its adjoining tributaries to observe the spatial variation of DOC, dissolved inorganic carbon (DIC), SOC and suspended inorganic carbon (SIC) in river water. The DOC and DIC values of Ramganga River goes between 1.49 to 4.65 and 9.61 to 36.6 mg L−1 with an average convergence of 2.5 and 20 mg L−1, individually, while in case of tributaries, these values extends between 0.09 to 4.52 and 4.61 to 42.36 mg L−1 with an average convergence of 2.13 and 21.1 mg L−1, separately. The estimations of SOC and SIC in the Ramganga River extend between 1.31 to 22.15 and 1.27 to 10.14 g kg−1 with an average convergence of 6.29 and 4.24 g kg−1, individually, though in tributaries, these values run between 0.80 to 47.23 and 0.31 to 22.94 g kg−1 with an average convergence of 9.25 and 5.14 g kg−1, separately. The results also show the higher values of DOC as compared with SOC and these values shows an increasing pattern with a decrease in elevation.
- Article
(6013 KB) - Full-text XML
- BibTeX
- EndNote


The imbalance in the carbon cycle is an outcome of large scale human activities that enhance the atmospheric CO2 concentration. This enhanced amount of atmospheric CO2 has led to global warming. For the purpose of studying the role played by nature in global warming, quantification of each source and sink of the carbon cycle is immensely important. Rivers are immensely important components of the ecosystem as they relate soil with groundwater, oceans as well as the atmosphere (Khan et al., 2017). ∼ 2 Petagram (Pg) of terrigenous organic carbon is channelled, transformed and stored by fluvial networks transport annually (Battin, 2008). The role of fluvial network in the transportation, transformation as well as outgassing of organic carbon (OC) to the atmosphere has been highlighted by Battin (2008), on the other hand, hypothesis referred by several researchers, for example, Raymo and Ruddiman (1992) supported by Berner and Berner (1996); Gaillardet et al. (1999); Galy and France-Lanord (2001) emphasise that occurrence of high rate of physical and chemical weathering of the Himalayan terrain during the Cenozoic period, burial of huge masses of organic carbon as well as its segregation has caused a cooling trend on the climate globally. Over the past 15 Myr, the river system of Ganga-Brahmaputra has deposited 0.6×10¹² mol organic carbons in the Bay of Bengal; this accounts for 15 % of the total burial flux (Galy et al., 2007). The current study has been conducted in the Ramganga River, a tributary of River Ganges to determine the concentrations of total dissolved carbon (TDC) comprising DOC and dissolved inorganic carbon (DIC) and total suspended carbon (TSC) comprising SOC and suspended inorganic carbon (SIC) on spatial scale. The objectives of this study also include understanding the variation of TDC and TSC in the upstream and downstream of the Ramganga Basin.

Ramganga River originates from the Dudhotali Mountains in the Chamoli district of Uttarakhand, and flows through the Kumaun Himalayas and the Ganga Flood Plains (GFP) before joining Ganges River (Khan and Chakrapani, 2016) (Fig. 1).
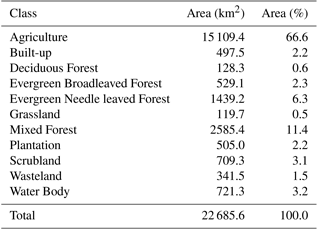
It has a catchment area of about 22 685 km2 (Khan and Chakrapani, 2016; Khan, 2018) of which mostly covered by forests and vegetation in the Uttarakhand state and agriculture in the Uttar Pradesh state (Table 1). Ramganga River flows through a length of 642 km (Daityari and Khan, 2017; Khan et al., 2016b). The river flows through the Kumaun Himalayas for about 158 km, covering the Jim Corbett National Park. Thereafter, it enters the GFP at Kalagarh, where the Ramganga Dam has been constructed. The river then flows through the highly industrialized and agricultural land of densely populated districts of Uttar Pradesh viz., Bijnor, Moradabad, Rampur, Bareilly, Shahjahanpur, Hardoi and Farrukhabad (Khan et al., 2016a).
Figure 2 shows the average annual temperature, precipitation and water discharge at three gauging site on the Ramganga River. Geologically, the entire basin has been divided into three zones, namely Lesser Himalayas, Sub Himalayas and GFP (Khan et al., 2016c).
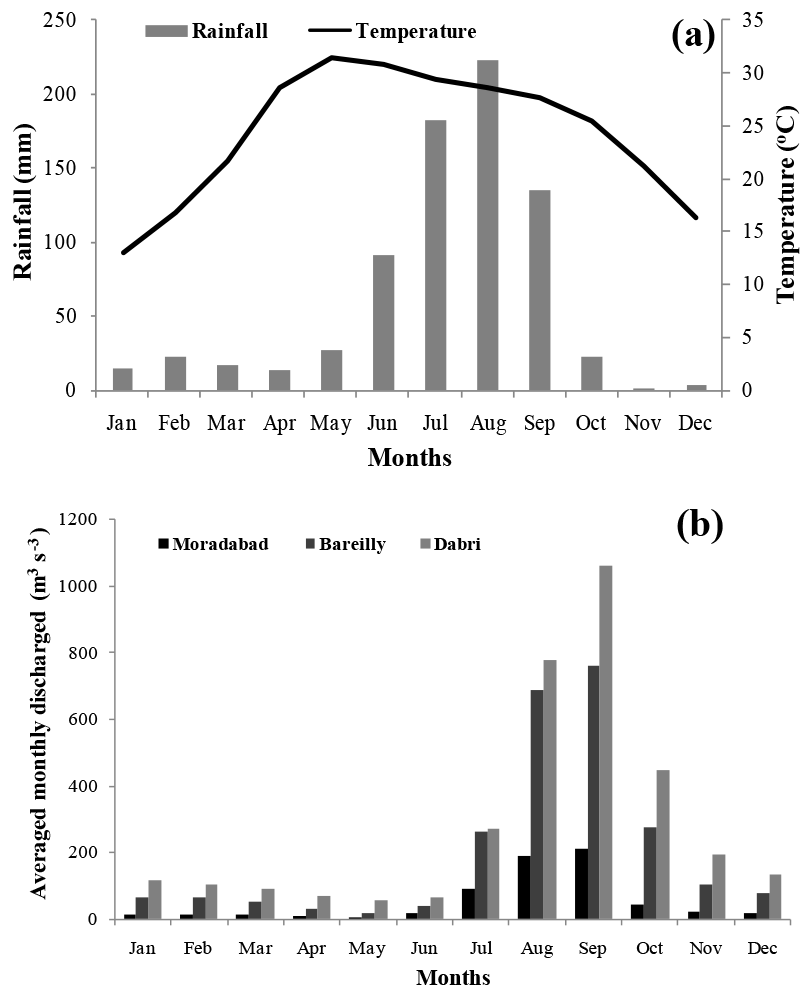
Figure 2(a) Averaged monthly rainfall (mm) and temperature (∘C) (b) Averaged monthly water discharge (m3 s−1) at three gauging sites of the study area.
10 L of water samples were collected from 26 different locations from the three stretches of the Ramganga River and its tributaries viz., upper (RG1–RG6 and T1–T5), middle (RG7–RG11 and T6–T8) and lower (RG12–RG16 and T9–T10) (Fig. 1). All the sampling has been done in the month March and April 2014. The suspended sediment concentration (SSC) was obtained by filtering the water sample using cellulose nitrate membrane filter paper of 0.45 µm and the material retained was weighed after dried. The collected water samples were placed in freezer at 4 ∘C and the process of filtering was done within 2 days from the collection of samples to avoid microbial growth (Chakrapani and Saini, 2009).
The estimation of TDC, DOC and DIC in the river water was done by liquid module of Analytik Jena TC Analyser Multi N/C 3100 instrument. TSC, SOC and SIC were estimated in the solid module of the same instrument by using calcium carbonate as a standard.
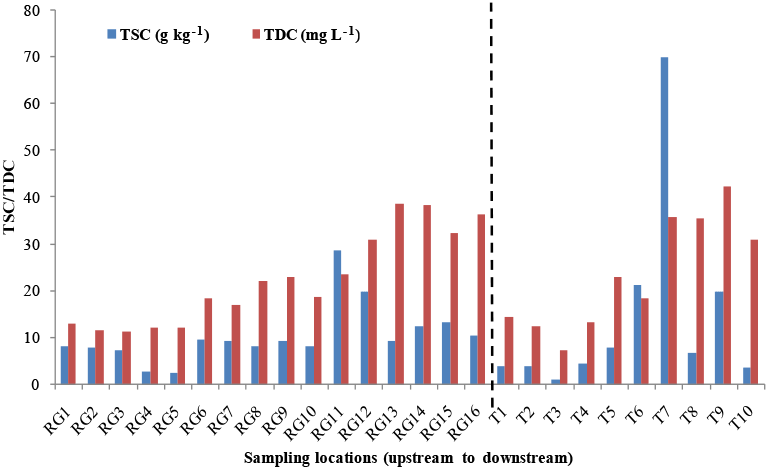
TDC shows very clear increasing pattern from upstream to downstream in case of Ramganga River and its tributaries which indicate the impact of human influence on the river; whereas TSC did not show any consistency in its concentration from upstream to downstream (Fig. 3).
4.1 Spatial variations in dissolved organic and inorganic carbon
DOC and DIC are the two important forms in which dissolved carbon is present in the river water. There is huge spatial variation has been shown in the concentration of DOC and DIC in the Ramganga basin. In Ramganga River and its tributaries, DOC varied from 1.49–4.65 and 0.097–4.52 mg L−1, respectively, whereas, the concentration of DIC ranges between 9.6–36.6 and 4.6–42.36 mg L−1, respectively (Fig. 4). The average DOC concentration in the Ramganga Basin in this study was 2.35 mg L−1, which is around half of the global average of 5.75 mg L−1, Indus River (4.6 mg L−1), Ganges (16.1 mg L−1) and Brahmaputra (3.2 mg L−1) DOC concentrations stated by Meybeck (1993) and Ramesh et al. (1995). The average concentration of DOC in Ramganga basin is two times higher from closely associated Alaknanda Basin, which was around 1.2 mg L−1 (Panwar et al., 2017). From the Fig. 4, it is evident that the value of DOC decreases in the upper and the lower reaches of the Ramganga River and its tributaries whereas increases in the middle reach of the river. On the other hand, a value of DIC decreases in the upper and increases in the middle and lower reaches of the Ramganga River and its tributaries.
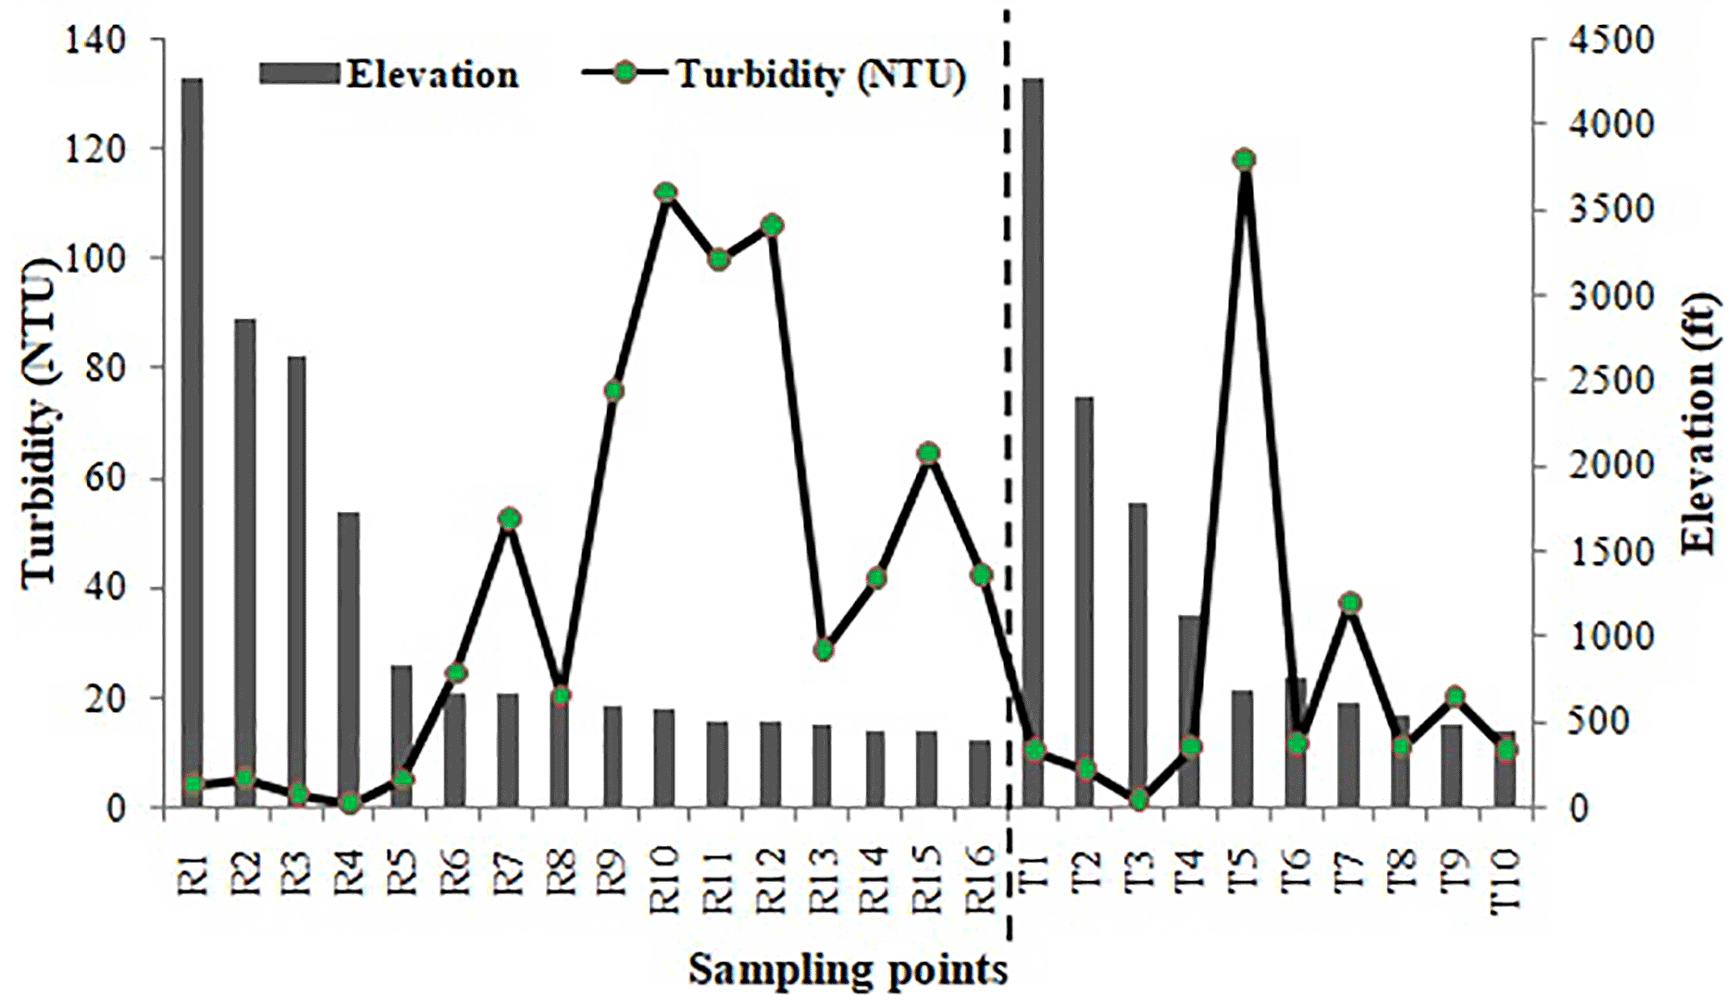
According to Sun et al. (2011), for most rivers, bicarbonate is the dominant form of DIC, primarily from chemical weathering of silicates and carbonates in the drainage basin. Soil erosion is the essentially derived source for DOC and SOC in the river which shows higher turbidity values, however, commitment of aquatic biomass may possibly enhance considerably in low turbid rivers (Ludwig et al., 1996).
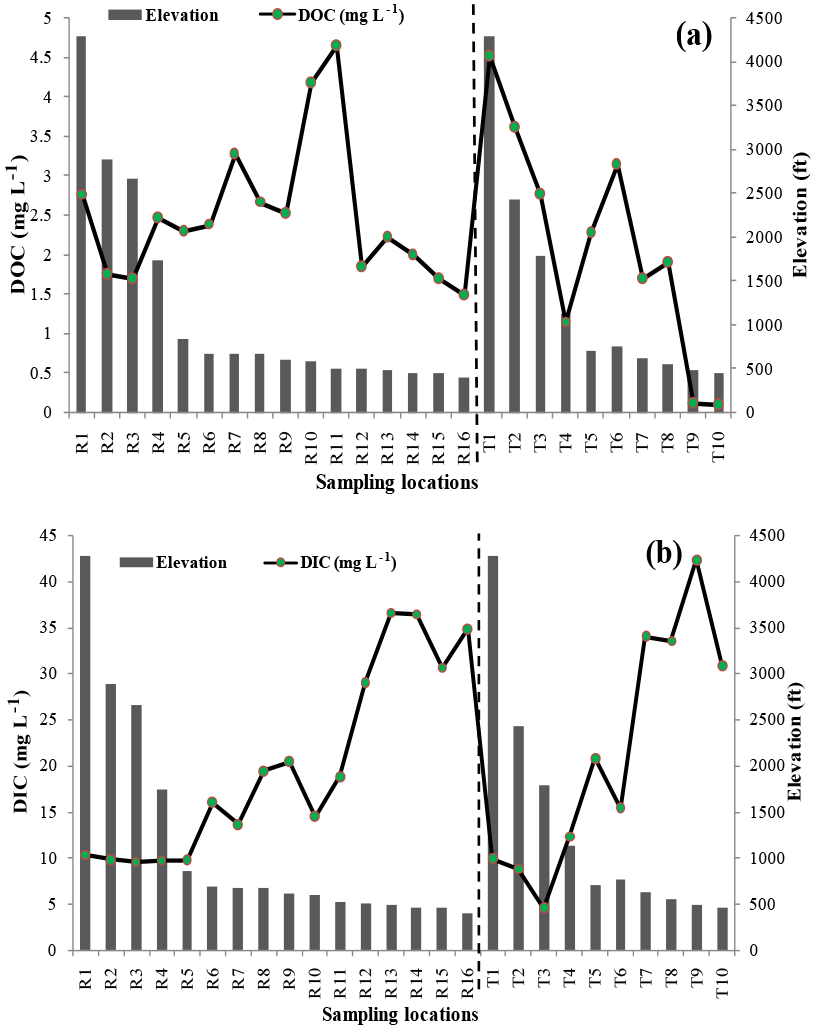
Figure 4Spatial variation in the DOC and DIC concentration of the Ramganga River and its tributaries.
Through temporary mechanism, for instance primary production and respiration, microbial consumption, organic and inorganic carbon in the river can transform to each other (Sun et al., 2011). The upper reach of the Ramganga River and its tributaries flowing in Himalayas shows low concentrations of DOC and DIC as compared to middle and lower reaches and the value of turbidity is also low in this stretch (Fig. 5). The DIC concentrations in this reach are mainly attributed to the dilution of carbonate and silicate rocks by chemical weathering. Forest covers which occupied > 75 % of the upper region of the Ramganga basin might be a possible factor for the DOC concentration. Evans et al. (2007) and Butman et al. (2015) observed that DOC has been regularly of recent source acclimatized by plants and old carbon (fossilized) includes just 3–9 % of the total DOC conveyed by the global rivers. The δ13Corg investigations by Aucour et al. (2006) in the Bengal fan sediments revealed that that Himalayan Rivers conveyed 70–85 % of late organic carbon. Vegetations comprised of both C3 and C4 were found in the Upper Ganges Basin (Chakrapani and Veizer, 2005). The dissimilarity amongst C3 and C4 plants is that C4 plants influence a four-carbon sugar amid the Calvin cycle rather than two three-carbon sugars as in C3 plants.
The huge elevation in the DOC and DIC concentration (Fig. 4) is shown in the middle and lower reaches of the Ramganga River and its tributaries, which is situated in the GFP. This area has largely influenced by dense population and highly industrial and agricultural activities and covers around 66 % area of the total basin. The higher values of DOC in sampling sites RG6 to RG11 and T5 to T8 in Fig. 4a may be due to the non-point sources of pollution from semi-urban and rural areas, human interaction with river such as direct discharge of waste material, mass bathing during festivals, religious funerals and cremation on the bank of river, cattle bathing etc. Whereas, the higher values of DIC from RG6 to RG11 and T5 to T8 in Fig. 4b is mainly attributed to the presence of silicate and carbonate rocks in the upper catchment area, soil erosion, agricultural activities and runoff, sand mining and river meandering etc.
4.2 Spatial variations in suspended organic and inorganic carbon
SOC and SIC are the two forms of suspended carbon or particulate carbon (SC or PC) are present in river systems. High concentrations of suspended organic and inorganic matters are a relentless component of numerous substantial streams (Smith et al., 1987). As similar to the dissolved carbon, huge spatial variation has also been shown in the concentration of SOC, whereas SIC does not show the similar pattern in the Ramganga basin (Fig. 6).

Figure 6Spatial variation in the SOC and SIC concentration of the Ramganga River and its tributaries.
In Ramganga River and its tributaries, SOC varied from 1.31–22.15 and 0.80–47.23 g kg−1, respectively, whereas, the concentration of SIC ranges between 1.27–10.14 and 0.31–22.94 g kg−1, respectively (Fig. 6). It is evident from the figures that the value of SOC decreases in the upper and the lower reaches of the Ramganga River and its tributaries while increases in the middle reach of the river and its tributaries. Dissimilar to the case of DIC, SIC does not show any spatial variation from upstream and downstream of the river.
Panwar et al. (2017), stated that due to variations in topography and rates of chemical weathering, the organic carbon transported by River Ganges mainly in the form DOC in its upstream and mostly as SOC down the Himalayan foothills. The possible factors behind the SIC concentrations in the upper reaches of the basin, which flows through Kumaon Himalayas is may be due to the dilution of carbonate and silicate rocks by chemical weathering. Forest covers which occupied > 75 % of the upper reaches of the Ramganga basin might be a possible factor for the SOC concentration. SC mostly shows positive correlation with SSC (Panwar et al., 2017). In case of Ramganga River and its tributaries, a positive correlation between SSC with SIC and SOC is shown in Fig. 7.
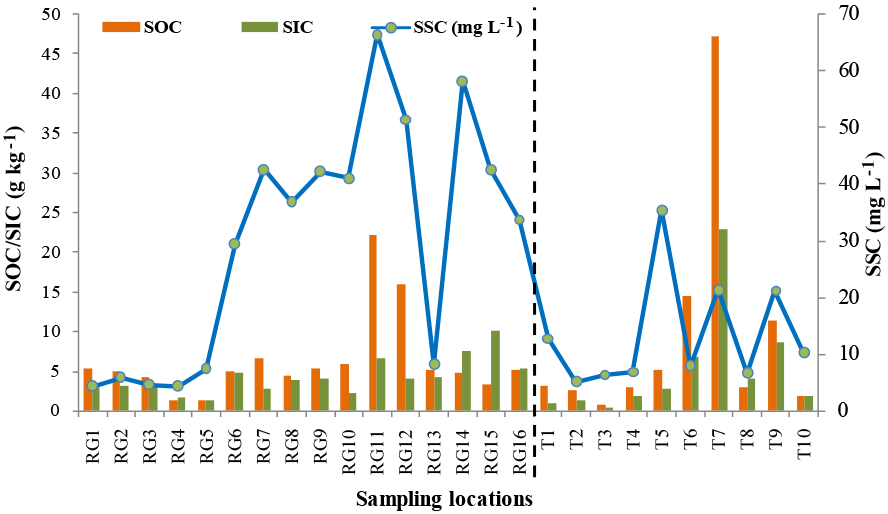
A regular downstream increase pattern in SSC, 4.4 to 66.36 mg L−1, SOC, 0.80–47.23 g kg−1 and SIC, 0.31–22.94 g kg−1 was observed during sampling movement, mainly marked below 304.8 m above sea level, demonstrating that most suspended matter transported towards the River Ganges instigated from the middle and lower regions of the Ramganga River, which is situated in GFP and also low altitude zones rather than from upper region or headwater regions. This indicates that the Ramganga dam, which has been constructed in Kalagarh town between the sampling stations RG5 and RG6 act as tremendously efficient sediment trap. It is concluded that the influence of anthropogenic activity in the GFP due to dense populations and highly industrial setup in one of the major reason of SOC concentration in the Ramganga river, on the other hand, soil erosion, agricultural activities, and sand mining etc., are the possible factors for SIC concentration.
The significant conclusions of this investigation are as per the following:
-
The Ramganga river and its tributaries show abundance amount of TSC (SOC and SIC) and TDC (DOC and DIC) both in the upstream and downstream.
-
TDC accounts more in river concentration as compared to TSC, especially in the downstream of the river.
-
Urbanization has driven the expansion of fluvial DOC in the Ramganga basin, which is likely connected to the expansion in sewage discharge because of expanded population.
-
Agricultural activities and sand mining have also plays significant role in triggering the river TSC in Ramganga River.
This study only shows the concentration of TSC and TDC on spatial scales, but in order to get the role Ramganga Basin's in transporting TSC and TDC to the River Ganges, this study can be further extended to the temporal scale in order to obtain total carbon flux and role of meteorological factors on regulating this phenomenon.
Data are available upon request by the corresponding author.
The authors declare that they have no conflict of interest.
This article is part of the special issue “Innovative water resources management – understanding and balancing interactions between humankind and nature”. It is a result of the 8th International Water Resources Management Conference of ICWRS, Beijing, China, 13–15 June 2018.
Mohd Yawar Ali Khan thanks the Indian Institute of Technology, Roorkee, India. The
authors gratefully acknowledge the comments of the reviewers and the editor,
which enormously improved the presentation of the final manuscript.
Edited by: Wenchao Sun
Reviewed by: two anonymous referees
Aucour, A. M., France-Lanord, C., Pedoja, K., Pierson-Wickmann, A. C., and Sheppard, S. M.: Fluxes and sources of particulate organic carbon in the Ganga-Brahmaputra river system, Global Biogeochem Cy., 20, GB2006, https://doi.org/10.1029/2004GB002324/, 2006.
Battin, T. J.: Biophysical controls on organic carbon fluxes in fluvial networks, Nat. Geosci., 1, 95–100, 2008.
Berner, R. A. and Berner, E. K.: Global environment: water, air, and geochemical Cycles, Prentice-Hall, Englewood Cliffs, NJ, p. 376, 1996.
Butman, D. E., Wilson, H. F., Barnes, R. T., Xenopoulos, M. A., and Raymond, P. A.: Increased mobilization of aged carbon to rivers by human disturbance, Nat. Geosci., 8, 112–116, 2015.
Chakrapani, G. J. and Saini, R. K.: Temporal and spatial variations in water discharge and sediment load in the Alaknanda and Bhagirathi rivers in Himalaya, India, J. Asian Earth Sci., 35, 545–553, 2009.
Chakrapani, G. J. and Veizer, J.: Dissolved inorganic carbon isotopic compositions in the upstream Ganga River in the Himalayas, Curr. Sci., 89, 553–556, 2005.
Daityari, S. and Khan, M. Y. A.: Temporal and spatial variations in the engineering properties of the sediments in Ramganga River, Ganga Basin, India, Arab. J. Geosci., 10, 134, https://doi.org/10.1007/s12517-017-2915-2, 2017.
Evans, C. D., Freeman, C., Cork, L. G., Thomas, D. N., Reynold, B., Billett, M. F., Garnett, M. H., and Norris, D.: Evidence against recent climateinduced destabilisation of soil carbon from 14C analysis of riverine dissolved organic matter, Geophys. Res. Lett., 34, L07407, https://doi.org/10.1029/2007GL029431, 2007.
Gaillardet, J., Dupre, B., Louvat, P., and Allegre, C. J.: Global silicate weathering and CO2 consumption rates deduced from the chemistry of large rivers, Chem. Geol., 159, 3–30, 1999.
Galy, A. and France-Lanord, C.: Higher erosion rates in the Himalaya: geochemical constraints on riverine fluxes, Geology, 29, 23–26, 2001.
Galy, V., France-Lanord, C., Beyssac, O., Faure, P., Kudrass, H., and Palhol, F.: Efficient organic carbon burial in the Bengal fan sustained by the Himalayan erosional system, Nature, 450, 407–410, 2007.
Khan, M. Y. A.: Spatial Variation in the Grain Size Characteristics of Sediments in Ramganga River, Ganga Basin, India, Handbook of Environmental Materials Management, 1–11, 2018.
Khan, M. Y. A. and Chakrapani, G. J.: Particle size characteristics of Ramganga catchment area of Ganga River, in: Geostatistical and Geospatial Approaches for the Characterization of Natural Resources in the Environment (pp. 307–312), Springer, Cham, 2016.
Khan, M. Y. A., Hasan, F., Panwar, S., and Chakrapani, G. J.: Neural network model for discharge and water-level prediction for Ramganga River catchment of Ganga Basin, India, Hydrol. Sci. J., 61, 2084–2095, 2016a.
Khan, M. Y. A., Gani, K. M., and Chakrapani, G. J.: Assessment of surface water quality and its spatial variation. A case study of Ramganga River, Ganga Basin, India, Arab. J. Geosci., 9, 28, https://doi.org/10.1007/s12517-015-2134-7, 2016b.
Khan, M. Y. A., Daityari, S., and Chakrapani, G. J.: Factors responsible for temporal and spatial variations in water and sediment discharge in Ramganga River, Ganga Basin, India, Environ. Earth Sci., 75, 283, https://doi.org/10.1007/s12665-015-5148-2, 2016c.
Khan, M. Y. A., Gani, K. M., and Chakrapani, G. J.: Spatial and temporal variations of physicochemical and heavy metal pollution in Ramganga River – a tributary of River Ganges, India, Environ. Earth Sci., 76, 231, https://doi.org/10.1007/s12665-017-6547-3, 2017.
Ludwig, W., Probst, J. L., and Kempe, S.: Predicting the oceanic input of organic carbon by continental erosion, Global Biogeochem Cy., 10, 23–41, 1996.
Meybeck, M.: Riverine transport of atmospheric carbon: sources, global typology and budget, Water Air Soil Pollut., 70, 443–463, 1993.
Panwar, S., Gaur, D., and Chakrapani, G. J.: Total organic carbon transport by the Alaknanda River, Garhwal Himalayas, India, Arab. J. Geosci., 10, 207, https://doi.org/10.1007/s12517-017-3003-3, 2017.
Ramesh, R., Purvaja, G. R., and Subramanian, V.: Carbon and phosphorus transport by the major Indian rivers, J. Biogeogr., 22, 409–415, 1995.
Raymo, M. E. and Ruddiman, W. F.: Tectonic forcing of late Cenozoic climate, Nature, 359, 117–122, 1992.
Smith, R. A., Alexander, R. B., and Wolman, M. G.: Water-quality trends in the nation's rivers, Science, 235, 1607–1616, 1987.
Sun, H. G., Han, J. T., Zhang, S. R., and Lu, X. X.: Transformation of dissolved inorganic carbon (DIC) into particulate organic carbon (POC) in the lower Xijiang River, SE China: an isotopic approach, Biogeosciences Discuss., 8, 9471–9501, https://doi.org/10.5194/bgd-8-9471-2011, 2011.