the Creative Commons Attribution 4.0 License.
the Creative Commons Attribution 4.0 License.
 | 05 Jun 2018
Centralized versus distributed reservoirs: an investigation of their implications on environmental flows and sustainable water resources management
Nishadi Eriyagama
Vladimir Smakhtin
Lakshika Udamulla
Storage of surface water is widely regarded as a form of insurance against rainfall variability. However, creation of surface storage often endanger the functions of natural ecosystems, and, in turn, ecosystem services that benefit humans. The issues of optimal size, placement and the number of reservoirs in a river basin – which maximizes sustainable benefits from storage – remain subjects for debate. This study examines the above issues through the analysis of a range of reservoir configurations in the Malwatu Oya river basin in the dry zone of Sri Lanka. The study produced multiple surface storage development pathways for the basin under different scenarios of environmental flow (EF) releases and reservoir network configurations. The EF scenarios ranged from “zero” to “very healthy” releases. It is shown that if the “middle ground” between the two extreme EF scenarios is considered, the theoretical maximum “safe” yield from surface storage is about 65–70 % of the mean annual runoff (MAR) of the basin. It is also identified that although distribution of reservoirs in the river network reduces the cumulative yield from the basin, this cumulative yield is maximized if the ratio among the storage capacities placed in each sub drainage basin is equivalent to the ratio among their MAR. The study suggests a framework to identify drainage regions having higher surface storage potential, to plan for the right distribution of storage capacity within a river basin, as well as to plan for EF allocations.
- Article
(2126 KB) - Full-text XML
- BibTeX
- EndNote


Storage of water is widely regarded as a form of insurance against rainfall variability. Although the debate over the most appropriate forms of water storage continues, historically, the “natural” first choice among water planners and managers has been surface storage. This is evidenced by the ancient tank irrigation systems that existed in Sri Lanka from around 300 BC, as well as multiple large dams that were constructed all over the world, during the latter half of the twentieth century. However, creation of surface storage often endanger the functions of natural ecosystems, and, in turn, ecosystem services that benefit humans. The optimal size, placement, and the number of reservoirs in a river basin, which maximizes sustainable benefits, while minimizing negative impacts on ecosystems, remain subjects for debate. This study examines some of the above issues through the analysis of a range of reservoir configurations in the Malwatu Oya river basin in the dry zone of Sri Lanka. Optimal sustainable limits to surface storage development for water supply, and the differences between centralized large reservoirs and distributed small reservoirs, are examined, by studying the behaviour of “water supply yield” versus “environmental flow (EF) yield” with increasing storage under each configuration.
The Malwatu Oya basin in the dry zone of Sri Lanka (Fig. 1) has a drainage area of 3246 km2 and a mean annual runoff (MAR) of 0.79 km3. It is dotted with small tank cascade systems, an ancient irrigation system consisting of a series of interconnected tanks, acting as storage and regulating reservoirs (Panabokke et al., 2002; Jayatillake et al., 2003). Apart from these small tanks the basin also consists of a number of larger irrigation reservoirs, also built in ancient times, but subsequently modified to suit present day demands. The combination of small and large reservoirs satisfy irrigation and other needs of the basin particularly during the long dry period from May to September.

3.1 Simulation of Natural River Flow
A Water Evaluation and Planning (WEAP) Model (Yates et al., 2005a, b) of the Malwatu Oya basin was developed in order to model its current hydrological processes, physical infrastructure and water abstractions. The larger basin was disaggregated into 147 sub watersheds (Fig. 1), for which climate input was provided with data acquired from six gauging stations in the vicinity. The sub watersheds were delineated in such a manner that they overlapped with the watersheds of the existing tank cascades as much as possible. The average area of a sub watershed was 22.7 km2. Water inflows, outflows, demands and currently available storage capacity (large reservoirs and small tanks) within a sub watershed were lumped together. The model was calibrated and validated (R2 = 0.92; Nash–Sutcliffe Coefficient = 0.84) for the period 1961–2013 against measured flow data, and simulated discharges output by a calibrated Soil and Water Assessment Tool (SWAT) model (R2 = 0.88; Nash–Sutcliffe Coefficient = 0.86), set up by the International Water Management Institute, for the same basin. Once the model calibration was completed, natural river discharge of each branch of the river was simulated by removing all reservoirs and water abstractions. This natural river discharge served as the basis for analysing different storage and environmental flow scenarios.
3.2 Behaviour of Water Supply and EF Yields under a Centralized Large Reservoir
The maximum potential annual “Safe Yield” from reservoir storage in the basin was estimated under a range of reservoir sizes and network configurations while allowing different (with respect to magnitude and timing) EF releases. The “Safe Yield” is the target draft that can be supplied at 100 % reliability for a given flow record by a reservoir which starts full and refills at least once after the worst drought on record (Vogel et al., 2007). The Sequent Peak Algorithm (Thomas and Burden, 1963), implemented in WEAP, which is the automated equivalent of the mass curve approach developed by Rippl (1883) was used for this purpose.
3.2.1 Mean Annual Safe Water Supply Yield and EF Yield under a Centralized Large Reservoir
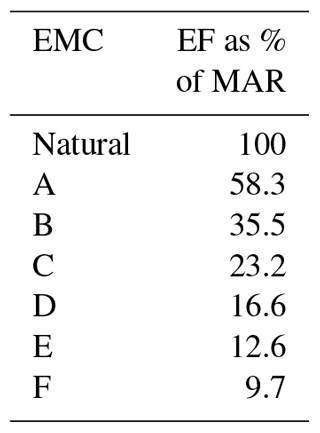
In the initial configuration, the cumulative runoff from the basin was routed through a hypothetical reservoir of increasing capacity while a varying monthly water demand, closely aligned with the actual demand distribution (which is mainly for irrigating rice) of the basin, was imposed on the reservoir. EF releases below the reservoir ranged from “zero” to “very healthy”. Six EF scenarios (time series of flow releases) were generated using the method of Smakhtin and Anputhas (2006). In this approach, the natural monthly flow time series at the outlet of the Malwatu Oya basin is used as input to develop six other monthly flow time series, which differ in magnitude, but are similar in pattern (following the monthly pattern of the natural flows – the pattern considered as the ideal for EF releases). The flow time series correspond to six Environmental Management Classes (EMCs), named A through F, and represent the EF requirements at the downstream end of the basin for the river to be maintained in each of the EMCs. Class A represents the ecological status of a protected healthy river whereas class F represents that of a highly degraded river. Table 1 summarises the mean annual “EF yield” required to maintain the river in each of the EMCs.
The behaviour of the Safe Yield under the zero EF (no EF) and the six EMC scenarios (with equal priorities assigned to both water supply and EF yields) is shown in Fig. 2. The yields shown are gross yields with no evaporation or seepage losses, and, no flood control, buffer or inactive storage assumed for the reservoir. The reservoir storage was allowed to become zero if it was necessary to satisfy the demands, but was required to fill up at least once during the total simulation period (53 years) in order to ensure continuity of storage. The curves represent the theoretical upper thresholds for cumulative annual surface water withdrawals (in units of MAR) from reservoir storage in the basin under a range of ecological protection categories. The curve for Class A provides the highest level of protection, while the curve with no EF requirements provides the lowest level of protection. The “middle ground” between the two extreme scenarios is shown as the “Mid” curve. The inverse of the curves correspond to the annual EF yields under the same set of scenarios, but are not shown on the figure for clarity.
Table 1Mean annual EF requirements (yields) under each Environmental Management Class (EMC).
3.2.2 Monthly Distribution of Safe Water Supply Yield and EF Yield under a Centralized Large Reservoir
The monthly distribution (quantity and timing) of both water supply and EF yields is as important as the mean annual quantity. The monthly water supply yield determines the “health” of the supply delivered, whereas the monthly EF yield determines the “health” of the river. Following the well documented reliability, resilience vulnerability and sustainability criteria (Hashimoto et al., 1982; Loucks, 1997) to evaluate the effectiveness of water storage, a Water Supply Sustainability (WSS) index and an Environmental Flow Sustainability (EFS) index (Eq. 1) was adopted to evaluate: how well a given demand is met by a given storage capacity and withdrawal scenario; and how well a prescribed EF regime is met by the in-stream flow releases below a reservoir, in terms of quantity and timing. Although the index of sustainability has been formulated in a number of ways by different authors, its formulation here (Eq. 1) follows that of McCartney et al. (2013). The optimum storage development pathway in a river basin should attempt to maximise both WSS and EFS.
The WSS versus EFS space was mapped out for the two reservoir sizes of 0.4 and 1.0 MAR assuming: (a) the “health of the water supply” is at its best (i.e. WSS = 1) when the water supply yield is at the level of the no EF scenario, and deteriorates when gradually increasing levels of EF is released, and, (b) the health of the river is at its best (i.e. EFS = 1) if the water supply yield is at the level of EMC scenario A, and deteriorates when gradually increasing levels of yields are drawn out. The resulting graphs of WSS versus EFS for scenarios (a) and (b) above for a reservoir size of 1.0 MAR (with different assigned priorities to water supply (WS), EF releases and reservoir filling) are shown on Fig. 3. The Safe Yields at which a compromise is reached between scenarios (a) and (b) for reservoir sizes of 0.4 and 1.0 MAR (when equal priorities to water supply and EF yields, and a lower priority to reservoir filling are assigned) are shown on Fig. 2 as “Compromise” points.
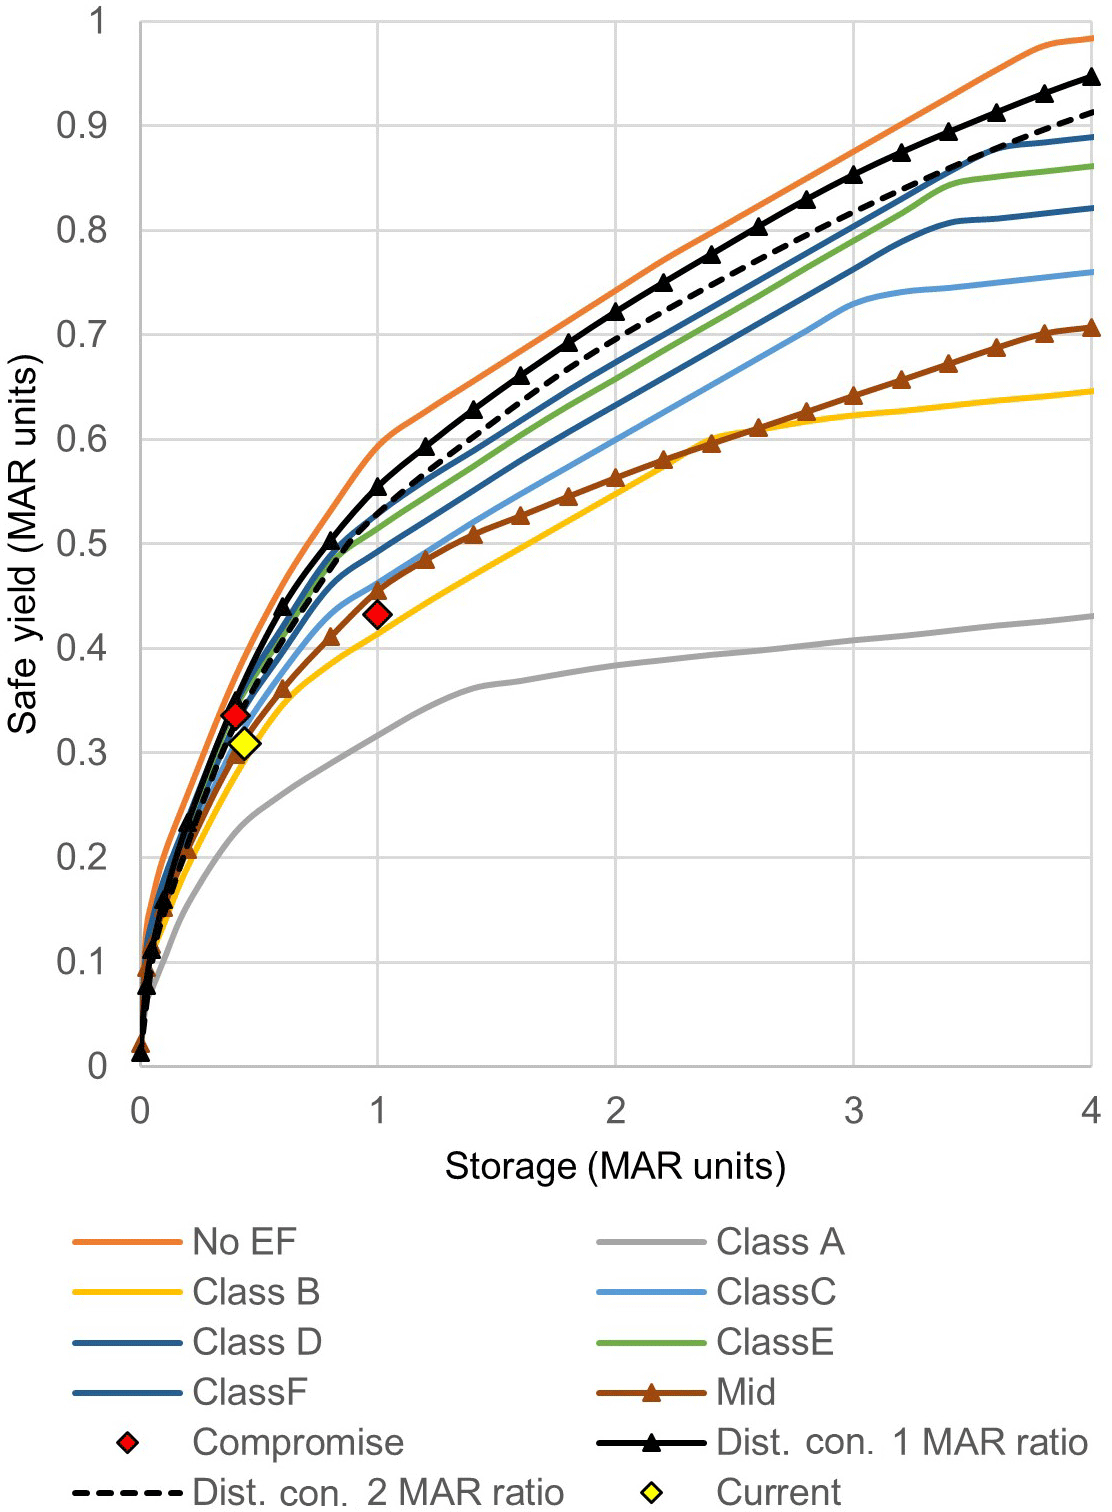
Figure 2Behaviour of Safe Yield for a centralized hypothetical reservoir under different EF releases, compared with those for two distributed reservoir configurations under which no explicit EF releases are made.
3.3 Behaviour of Water Supply and EF Yields under Distributed Small Reservoirs
In the second reservoir configuration, hypothetical reservoirs were placed at the outlets of 14 major sub drainage basins (identified by the Department of Agrarian Development) of the Malwatu Oya basin. Maximum potential Safe Yield curves for each of these drainage basins under the no EF scenario were developed, considering only the runoff generated within each sub drainage basin. This exercise helped to identify drainage regions having higher surface storage potential. Next, the cumulative Safe Yield curve for the entire basin was estimated by aggregating the individual yields under two sub scenarios as follows: (a) reservoirs placed in each sub drainage basin are of equal capacity, and, (b) reservoirs placed in each sub drainage basin follow a capacity ratio equivalent to the MAR ratio among sub drainage basins. The above exercise was then repeated under a third configuration where hypothetical reservoirs were placed at the outlets of the 147 sub watersheds delineated in the initial WEAP model. These 147 sub watersheds represent a further sub division of the 14 major drainage basins considered in scenario 2. The resulting Safe Yield curves under both distributed reservoir configurations are also shown on Fig. 2 (Dist. Con.1 MAR ratio, Dist. Con.2 MAR ratio), along with the earlier curves for the centralized reservoir configuration.
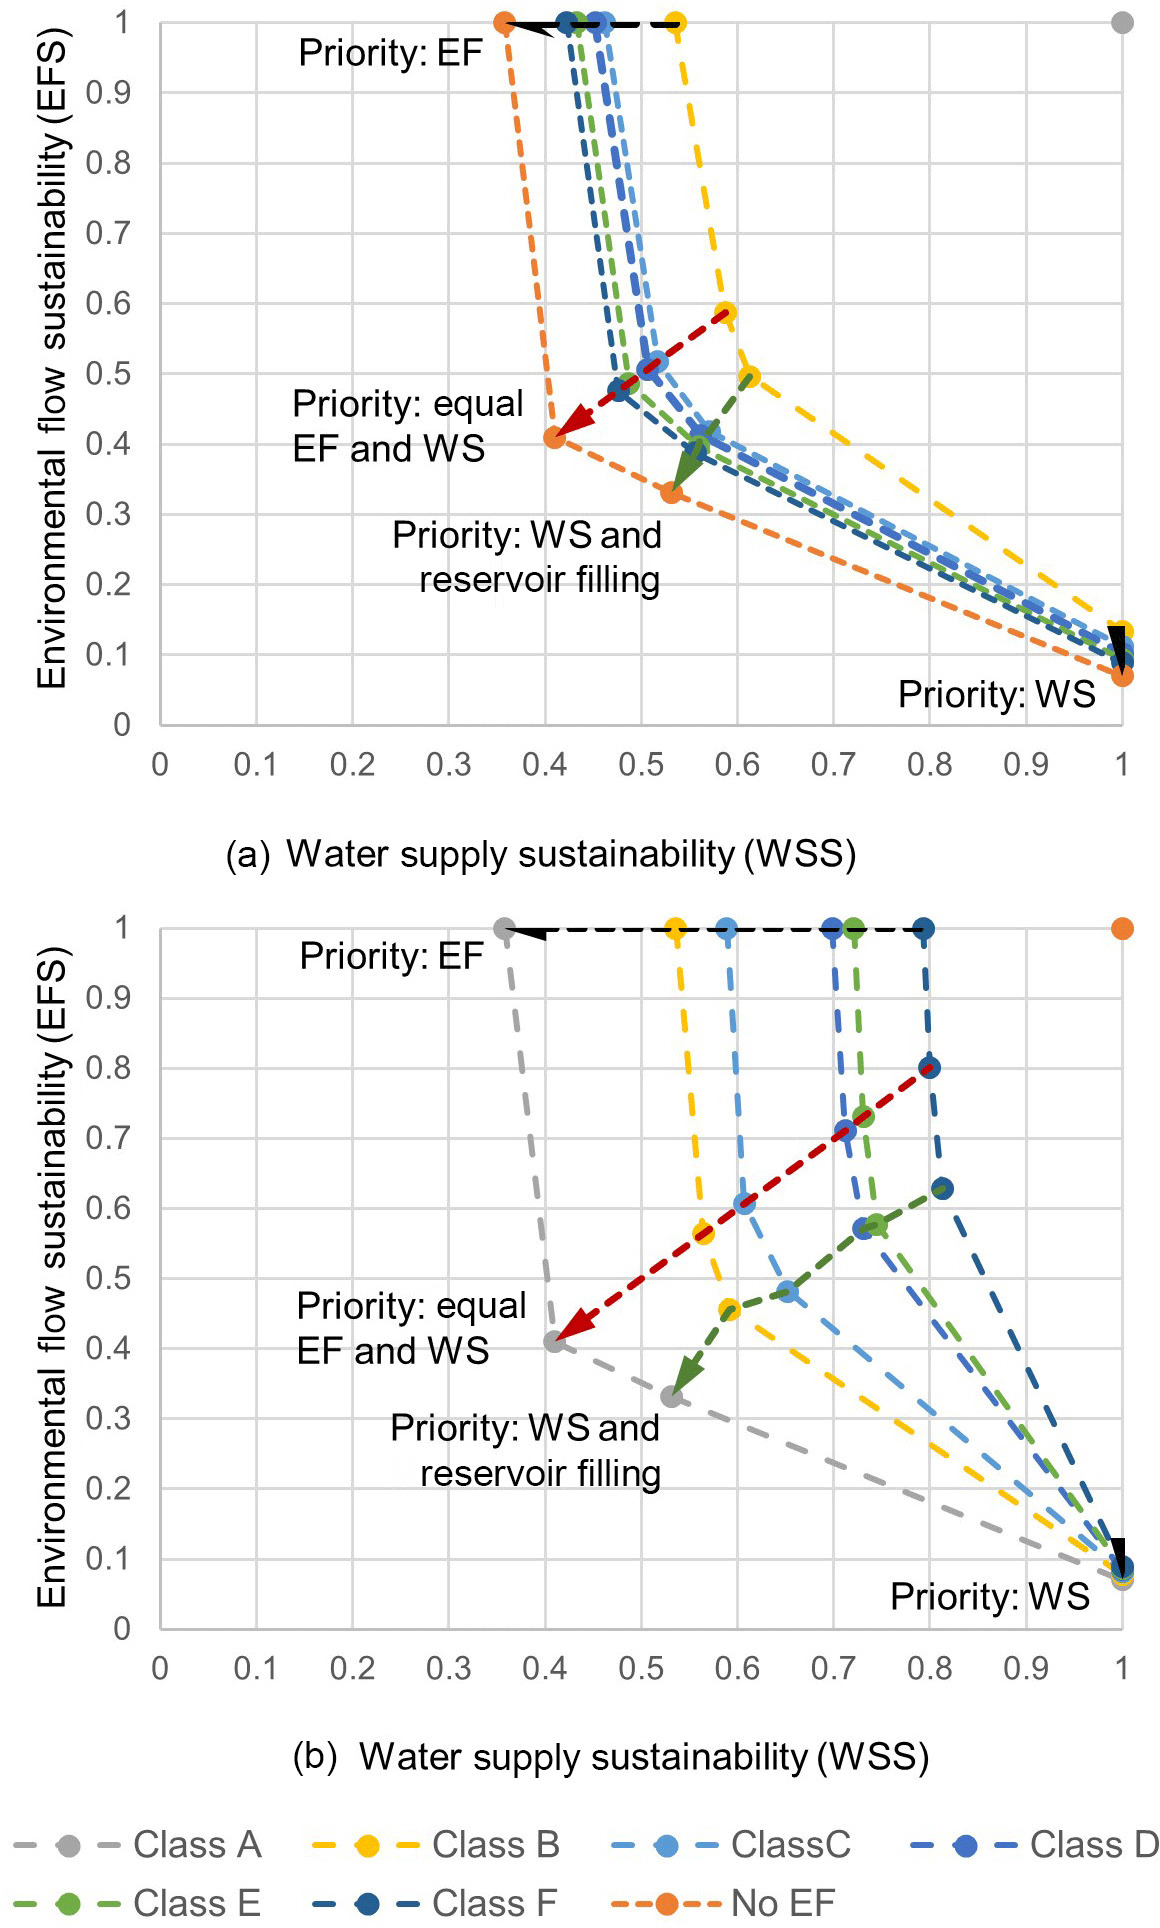
Figure 3Variation of WSS and EFS when increasing levels of yields are extracted while trying to satisfy EF at EMC “A” (a); when increasing levels of EF are released while trying to extract yields at “No EF” level (b) for a storage capacity of 1 MAR with different priorities assigned to water supply and EF demands.
When attempting to compromise the mean annual water supply and EF yields for the entire basin (Mid curve of Fig. 2), for cumulative storage capacities below 1.5 MAR units, the EMC scenario C curve represents a reasonable “middle ground” storage development pathway to be adopted, unless there is a specific need for the river to be at a higher state of protection. However, as storage capacities become larger than 1.5 MAR units, adoption of the EMC scenario B curve is more appropriate. Considering the Mid curve, the theoretical maximum (gross) Safe Yield for the Malwatu Oya basin is about 65–70 % of the MAR.
For any given storage capacity, the performance of the two indicators, EFS and WSS (which assess the “health” of the actual pattern of EF releases and water supply yields withdrawn), depend on the magnitude of the yield withdrawn, and the order of priority assigned to meeting each demand and filling up of the reservoir (Fig. 3). Considering where a compromise is reached between WSS and EFS for 0.4 and 1.0 MAR capacities (Fig. 2), the EMC Scenario C curve represents a reasonable storage development pathway to be adopted for cumulative storage capacities below 1.0 MAR units. For storage capacities above 1.0 MAR units, adoption of the Class B scenario is more appropriate.
Figure 2 illustrates that the maximum achievable yield from a lumped reservoir of a certain capacity is higher than the cumulative yield obtained from a network of distributed reservoirs of the same aggregated capacity. The cumulative yield is maximized when the storage capacity in each sub drainage basin follows a ratio equivalent to the MAR ratio of each sub drainage basin (also observed by Pitman, 1995). The cumulative yield of the entire basin declines with subsequent levels of distribution of reservoirs. When the cumulative Safe Yield curves for the two distributed reservoir configurations were compared with the EMC scenario curves in Fig. 2, it was observed that they closely follow the curves for EMC scenarios F and D respectively up to a reservoir size of 0.5 MAR. This implies that more releases are available at the downstream of the basin as EF, even though no explicit EF releases were made. Therefore, planned distribution of reservoirs in the river network, and limiting abstractions from them to a fraction of the local runoff generated within their individual watersheds is a strategy that can be adopted (subject to other requirements in the basin) to ensure that sufficient environmental flow releases are maintained in the river. It is also possible to identify the appropriate distribution of storage capacity in individual watersheds, and threshold levels of withdrawals to ensure that the entire basin stays on an identified sustainable storage development pathway. The actual reservoir configuration in the Malwatu Oya basin is even more densely distributed than any of the ones examined here. The position of the current cumulative storage capacity and current annual yield (approximately 0.43 and 0.31 MAR units respectively) shown on Fig. 2 also agrees with the finding that higher levels of distribution lowers cumulative yields. The current position is almost coincident with the “Mid” curve (Fig. 2). Although this implies that there is a reasonable quantity of annual EF releases at the downstream end, their temporal and spatial distribution (especially during the dry season) needs to be further investigated.
The objective of this research was to analyse a series of surface storage scenarios, consisting of hypothetical reservoirs of increasing storage capacity, placed at three levels of distribution across the river network, to investigate how an optimum reservoir arrangement (which maximizes water supply yields) under a given EF release scenario may be formulated. It provides tools and approaches to identify “sustainable” storage development pathways and theoretical maximum “safe” yields for whole river basins. Developing storage yield relationships for sub drainage regions (sub watersheds) helps to identify: regions in a river basin having higher surface storage potential; and, the right distribution of storage capacity (and allowable withdrawals) in individual drainage regions, to stay on an identified storage development pathway, which maximizes water supply yields while accommodating targeted EF yields.
When modelling current river flow, all water transfers and available storage capacity within a sub watershed was lumped together in order to reduce model complexity and processing time. Although the model may have not captured the heterogeneity within a sub watershed, it was still able to simulate river flows at sub watershed outlets (the hydrological resolution of our interest) reasonably well. However, use of simulated flow data in subsequent analyses introduces uncertainty into the end results, no matter how well the hydrological models have performed. Therefore, the use of measured flow time series, wherever possible, is recommended in order to reduce this uncertainty. In addition, further research should also investigate the impact of river fragmentation when reservoirs are distributed across the river network.
The daily climate data and monthly flow data used in this study were obtained from the recording gauges of the Meteorological and Irrigation Departments of Sri Lanka respectively. They are currently not publicly available.
The authors declare that they have no conflict of interest.
This article is part of the special issue “Innovative water resources management – understanding and balancing interactions between humankind and nature”. It is a result of the 8th International Water Resources Management Conference of ICWRS, Beijing, China, 13–15 June 2018.
This research was supported by the International Water Management Institute
(IWMI) as part of the CGIAR Research Programs on Climate Change Agriculture
and Food Security (CCAFS) and Water Land and Ecosystems (WLE). The authors would
like to acknowledge the support provided by Madusanka Thilakarathne for
processing the data required by the WEAP model.
Edited by: Zongxue Xu
Reviewed by: two anonymous referees
Hashimoto, T., Stedinger, J. R., and Loucks, D. P.: Reliability, resiliency, and vulnerability criteria for water resource system performance evaluation, Water Resour. Res., 18, 14–20, 1982.
Jayatillake, C. J., Sakthivadivel, R., Shinogi, Y., Makin, I., and Witharana, P.: A simple water balance modelling approach for determining water availability in an irrigation tank cascade system, J. Hydrol., 273, 81–102, 2003.
Loucks, D. P.: Quantifying trends in system sustainability, Hydrolog. Sci. J., 42, 513–530, 1997.
McCartney, M., Rebelo, L.-M., Xenarios, S., and Smakhtin, V.: Agricultural water storage in an era of climate change: assessing needs and effectiveness in Africa, IWMI Research Report 152, International Water Management Institute (IWMI), Colombo, Sri Lanka, 2013.
Panabokke, C. R., Sakthivadivel, R., and Weerasinghe, A. D.: Small tanks in Sri Lanka: evolution, present status and issues, International Water Management Institute (IWMI), Colombo, Sri Lanka, 2002.
Pitman, W. V.: Towards Improved Utilization of South Africa's Water Resources, Proceedings of the Seventh South African National Hydrology Symposium, 4–6 September 1995, Grahamstown, South Africa, 1995.
Rippl, W.: The capacity of storage-reservoirs for water supply, P. I. Civil Eng., 71, 270–278. 1883.
Smakhtin, V. U. and Anputhas, M.: An Assessment of Environmental Flow Requirements of Indian River Basins, IWMI Research Report 107, International Water Management Institute (IWMI), Colombo, Sri Lanka, 2006.
Thomas Jr., H. A. and Burden, R. P.: Operations research in water quality management, Division of Engineering and Applied Physics, Harvard University, Cambridge, MA, USA, 1963.
Vogel, R., Seiber, J., Archfield, S., Smith, M., Apse, C., and Huber-Lee, A.: Relations among storage, yield, and instream flow, Water Resour. Res., 44, W05403, https://doi.org/10.1029/2006WR005226, 2007.
Yates, D., Sieber, J., Purkey, D., and Huber-Lee, A.: WEAP21: A demand, priority, and preference-driven water planning model: 1. Model characteristics, Water Int., 30, 487–500, 2005a.
Yates, D., Purkey, D., Sieber, J., Huber-Lee, A., and Galbraith, H, WEAP21: A demand, priority, and preference-driven water planning model: 2. Aiding freshwater ecosystem service evaluation, Water Int., 30, 501–512, 2005b.