the Creative Commons Attribution 4.0 License.
the Creative Commons Attribution 4.0 License.
 | 05 Jun 2018
Connections between meteorological and hydrological droughts in a semi-arid basin of the middle Yellow River
Binquan Li
Changchang Zhu
Zhongmin Liang
Guoqing Wang
Yu Zhang
Differences between meteorological and hydrological droughts could reflect the regional water consumption by both natural elements and human water-use. The connections between these two drought types were analyzed using the Standardized Precipitation Evapotranspiration Index (SPEI) and Standardized Streamflow Index (SSI), respectively. In a typical semi-arid basin of the middle Yellow River (Qingjianhe River basin), annual precipitation and air temperature showed significantly downward and upward trends, respectively, with the rates of −2.37 mm yr−1 and 0.03 ∘C yr−1 (1961–2007). Under their synthetic effects, water balance variable (represented by SPEI) showed obviously downward (drying) trend at both upstream and whole basin areas. For the spatial variability of precipitation, air temperature and the calculated SPEI, both upstream and downstream areas experienced very similar change characteristics. Results also suggested that the Qingjianhe River basin experienced near normal condition during the study period. As a whole, this semi-arid basin mainly had the meteorological drought episodes in the mid-1960s, late-1990s and the 2000s depicted by 12-month SPEI. The drying trend could also be depicted by the hydrological drought index (12-month SSI) at both upstream and downstream stations (Zichang and Yanchuan), but the decreasing trends were not significant. A correlation analysis showed that hydrological system responds rapidly to the change of meteorological conditions in this semi-arid region. This finding could be an useful implication to drought research for those semi-arid basins with intensive human activities.
- Article
(1108 KB) - Full-text XML
- BibTeX
- EndNote


In recent decades, frequently occurred drought disaster has significant impacts on industrial and agricultural production, human's livelihood and ecological environmental protection (Mishra and Singh, 2010). With the social and economic development and population explosion, water resources shortage has been a worsening problem. Thus, drought has attracted more and more attention from all sectors of society. According to the WMO's statistics, the loss caused by meteorological disaster occupied more than 85 % of the total natural disaster's losses; in which, about 50 % of these meteorological disasters were caused by droughts (Obasi, 1994). China is one of the countries that experienced frequent and serious drought disaster (Li et al., 2017, 2015; Zou et al., 2005). For example, a large-scale drought occurred in 2000 spread to 20 provinces of China, resulting in substantial economic losses. More than 12 provinces of China were affected by the 2009 drought event, and especially in some northern provinces, the drought degree reached an extreme level. In another example, a drought with 100-year return period swept across southwest China during summer 2009 to spring 2010, resulting in a large decrease in most river levels (Lu et al., 2011).
Due to the differences of purpose or target in drought research and the complexity of drought formation cause, there are several drought classifications: meteorological drought, hydrological drought and agriculture drought. Meteorological drought describes water shortage phenomenon caused by the imbalance between precipitation and evaporation during a specific period. In general, water shortage degree (calculated with precipitation) would be used as a measure of meteorological drought because of the accessibility of precipitation data. The popular drought indices calculated by precipitation include continuous rainless days, precipitation anomaly percentage, precipitation Z index, and Standardized Precipitation Index (SPI, McKee et al., 1993), etc. The above single precipitation factor based indices lack the consideration of evaporative demand, and thus may be cannot objectively characterize the drought process (Li et al., 2014). To overcome this limitation in drought calculation, many efforts have been conducted to develop new drought indices by introducing extra influencing factors. For example, the Palmer Drought Severity Index (PDSI) uses readily available temperature and precipitation data to estimate relative dryness (Palmer, 1965), and has been widely used in drought research. Vicente-Serrano et al. (2010) proposed a new meteorological index, Standardized Precipitation Evapotranspiration Index (SPEI), combining the sensitivity of PDSI to changes in evaporative demand and the robustness of multi-temporal nature of SPI. Hydrological drought represents the abnormal water shortage caused by the imbalance among precipitation, surface and sub-surface runoff. It measures the anomaly of river streamflow, and its common indices include anomalous percentage of river discharge, anomalous percentage of reservoir storage, and water resource scarcity index, etc. Vicente-Serrano et al. (2011) developed the Standardized Streanflow Index (SSI) for hydrological drought analysis. It evaluates the water shortage degree of a stream or set of streams in multi-temporal scales. Thus, this index could be an appropriate choice for hydrological drought analysis (Li et al., 2014).
The main objective of this paper is to conduct the connection analysis between meteorological and hydrological droughts in a semi-arid region of the middle Yellow River. The SPEI and SSI were used to represent the meteorological and hydrological indices, respectively, and calculated in a typical basin (Qingjianhe River basin) for the period of 1961–2007. Response of hydrological systems to meteorological conditions would be analyzed for better understanding the regional water resources scarcity.
2.1 Study area
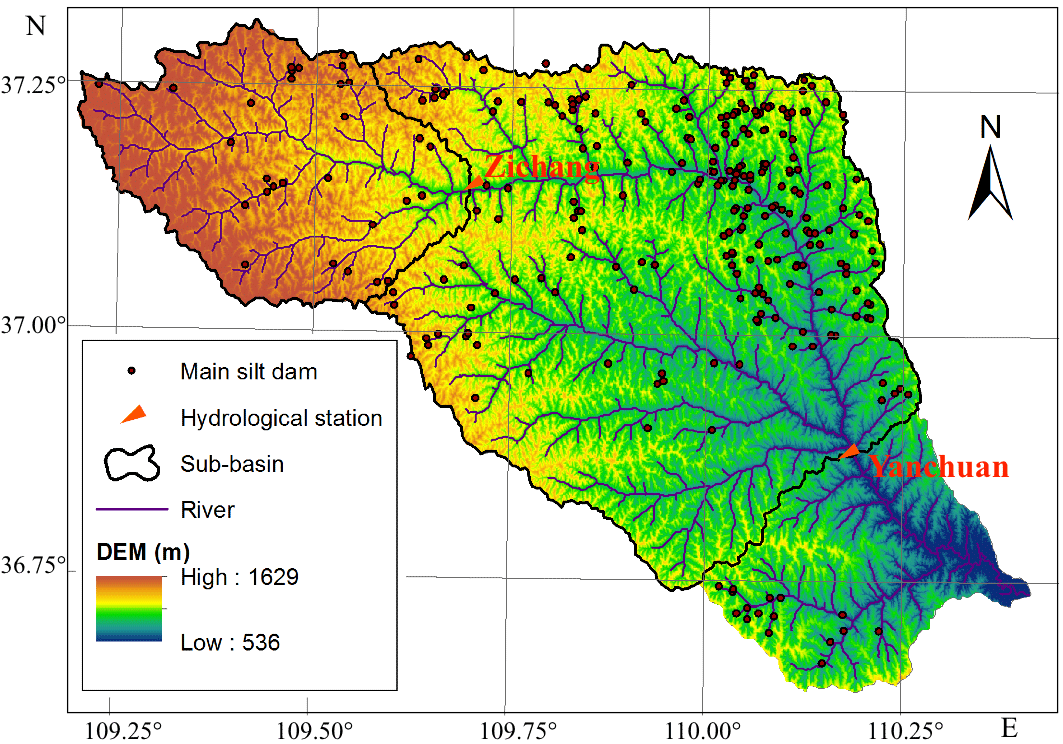
Qingjianhe River basin locates between 109∘12′–111∘24′ E and 36∘39′–37∘19′ N in the middle Yellow River region (Fig. 1). It covers an area of 4078 km2, and its elevations increase from 536 m in the east to 1629 m in the west with an average altitude of 1108 m. Annual mean basin-wide precipitation is 451 mm, but is not evenly distributed in space and time. About 65 % precipitation of annual total amount occurs during the period of July–September. Observed annual streamflow is about 138 million m3 in this basin. There are two hydrological stations located at the mainstream of Qingjianhe River: Zichang and Yanchuan. The cover areas of these two stations were 913 and 3468 km2, respectively. Monthly streamflow data (1961–2007) were collected at these two hydrological stations. Daily precipitation data for the corresponding study period were collected from the 0.25∘ gridded APHRODITE product (Yatagai et al., 2012).
2.2 Drought indices and trend analysis method
Water depict based index, SPEI, could measure the anomaly of the difference between precipitation (P) and potential evapotranspiration (PET) by using monthly precipitation and air temperature (Vicente-Serranto et al., 2010). Thus, the meteorological drought in the study basin was characterized by SPEI that used a three parameter log-logistic probability distribution for P-PET sample fitting. The SPEI values are accumulated to different time scales, and converted to standard deviations with respect to average values. As for the hydrological drought, SSI was used to calculate different time scale streamflow anomaly (Vicente-Serranto et al., 2011). SSI incorporates hydrological processes that determine seasonal loss in streamflow due to the influence of both climate and human use. The calculated SSI value represents an average dry or wet regime in the controlled drainage areas of the hydrological stations. The following drought categories were used for both drought indices (McKee et al., 1993): (a) 2.00 and above: extremely wet; (b) 1.50 to 1.99: very wet; (c) 1.00 to 1.49: moderately wet; (d) −0.99 to 0.99: near normal; (e) −1.00 to −1.49: moderately dry; (f) −1.50 to −1.99: severely dry; and (g) −2.00 and less: extremely dry.
The nonparametric Mann–Kendall (M–K) test (Kendall, 1975; Mann, 1945) was used to detect the trends in time series of meteorological and hydrological factors and drought indices. A positive (negative) value of the M–K test statistic Z signifies an increasing (decreasing) trend. In order to eliminate the effect of significant serial correlation in time series on trend analysis, a trend-free pre-whitening procedure (Yue et al., 2002) was used before applying the M–K test.
3.1 Trend analysis of meteorological factors and streamflow
Trend analyses for precipitation and air temperature were performed for Zichang and Yanchuan sub-basins to understand the evolutions of drought episodes with the effect of climate change. In general, precipitation had a very similar temporal pattern in these two sub-basins, ranging from 254 to 732 mm, during the period of 1961–2007 (Fig. 2a). Annual mean precipitation were 434 and 444 mm for Zichang and Yanchuan sub-basins, respectively. Both sub-basins experienced the decreasing trend of precipitation with the significance at 95 % confidence level. The decreasing rates were −2.11 and −2.37 mm yr−1 for Zichang and Yanchuan sub-basins, respectively. On seasonal scale, only the fall season had the statistically significant decreasing trend in the Qingjianhe River basin. Under the global warming, the basin also showed the remarkable upward trend of annual air temperature in both sub-basins (Fig. 2b). The warming rate was 0.03 ∘C yr−1 for the period of 1961–2007. On seasonal scale, all four seasons experienced the statistically significant warming trend with 99 % confidence level, and winter had the largest warming rate of 0.05 ∘C yr−1.
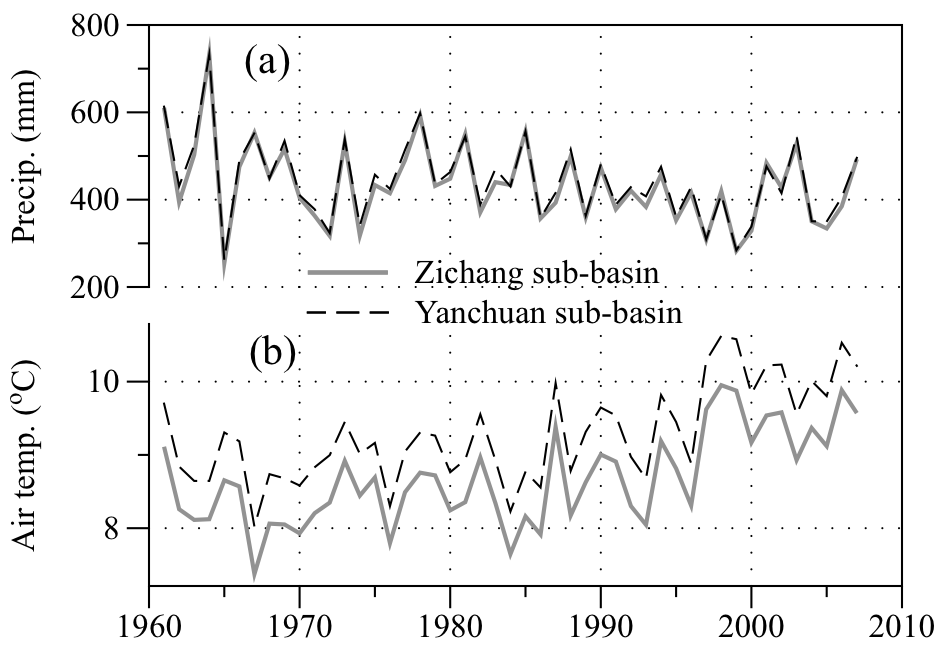
Figure 2Annual changes of precipitation and air temperature for Zichang and Yanchuan sub-basins during the period of 1961–2007.
According to the M–K test results, downward trends (but not significant) were found at both hydrological stations (Fig. 3). It was noted that streamflow at Yanchuan station (Fig. 3b) included all runoff volume from both sub-basins. In theory, significant decrease in precipitation and increase in air temperature were the indicator of the increase of water deficit of the study basin. However, the final trend of streamflow detected in Fig. 3 reflected both natural and human factors. The human activities are mainly manifested as the large-scale constrictions of soil and water conservation measures in the past decades in the middle Yellow River region, greatly reducing the basin runoff generation and the corresponding streamflow (Li et al., 2018).

Figure 3Annual changes of streamflow at Zichang and Yanchuan stations during the period of 1961–2007.
3.2 Calculations of drought indices
Figure 4 shows the evolution of two indices over 3 and 12 months intervals for two sub-basins or hydrological stations during the period of 1961–2007. It was obvious that short timescales (3 months) demonstrated a higher temporal frequency of dryness and wetness episodes for both two indices. Correspondingly, long timescales (12 months) produced the lower temporal frequency and longer duration of dryness and wetness episodes. SPEI showed the similar evolution patterns between two sub-basins, indicating of the consistency of two influencing factors (precipitation and air temperature). Generally, the Qingjianhe River basin experienced a near normal condition during the whole study period. This region mainly had the meteorological drought episodes in the mid-1960s, late-1990s and the 2000s depicted by 12-month SPEI.
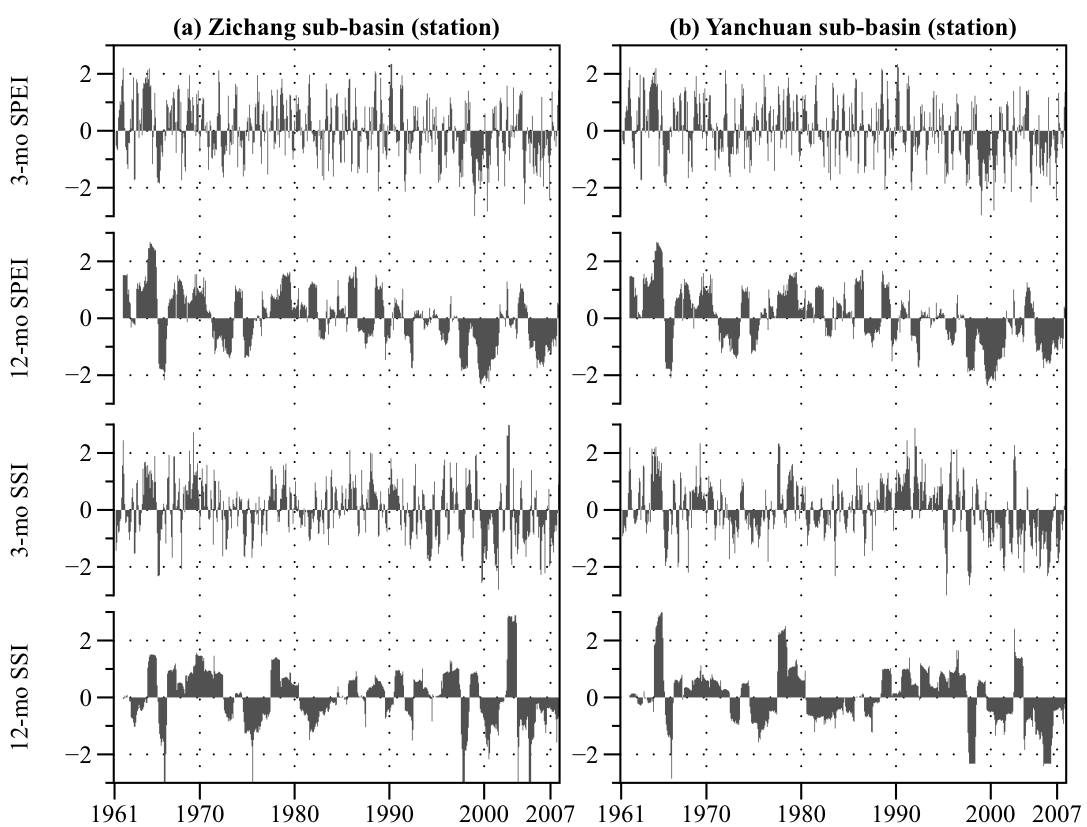
As for the hydrological drought index, the SSI series calculated at Zichang and Yanchuan stations also had the similar temporal patterns, but showed some differences in dryness or wetness magnitude (Fig. 4). According to the 12-month SSI series, alternant dryness and wetness spells could be found at the Zichang station after the year of 1990. However, most years after 2000 experienced drought events (from moderately to severely and even to extremely dry) except for a wet year of 2002. This temporary change to wet condition could also be reflected in the streamflow series (Fig. 3a).
According to the M–K test of 12-month drought indices, SPEI showed the obviously downward (drying) trend with a significance of 99 % confidence level at both Zichang and Yanchuan sub-basins. The drying rates were −0.03 and −0.04 for these two sub-basins, respectively. This drying trend could be well explained by the meteorological trends of Qingjianhe River basin (Fig. 2). The drying trend could also be depicted by the M–K test result of hydrological drought index. However, the downward trends of 12-month SSI were not statistically significant at both upstream and downstream stations (Zichang and Yanchuan).
3.3 Connections between meteorological and hydrological droughts
The correlation analysis was carried out between SPEI and SSI at different timescales (from one to 12 months) for inter-comparison. The time series of Pearson R correlation coefficient could be calculated between two drought index series. As an example, Fig. 5 shows the Pearson R correlation coefficients between SPEI and SSI with 1, 3, 6, 9, and 12 month time scales and different time lags (from one to 12 months). The time lag represents the time for response of hydrological system to climate variable on a basin scale. Results suggested that the correlation between these two drought indices was relatively low (R<0.6). It indicated that the response relationship of hydrological system to precipitation and evaporation was highly nonlinear, even on annual time scale. The main reason should be the influence of intensive human activities (i.e., the increasing constructions of soil and water conservation measures). For example, the local people have constructed 274 main silt dams from 1955 to 2009, with the total water storage of 251 million m3 (see their locations in Fig. 1). These main silt dams controlled more than 25 % of total area of the Qingjianhe River basin. This runoff-retaining function should certainly affect the correlation between climatic factors and hydrological response.
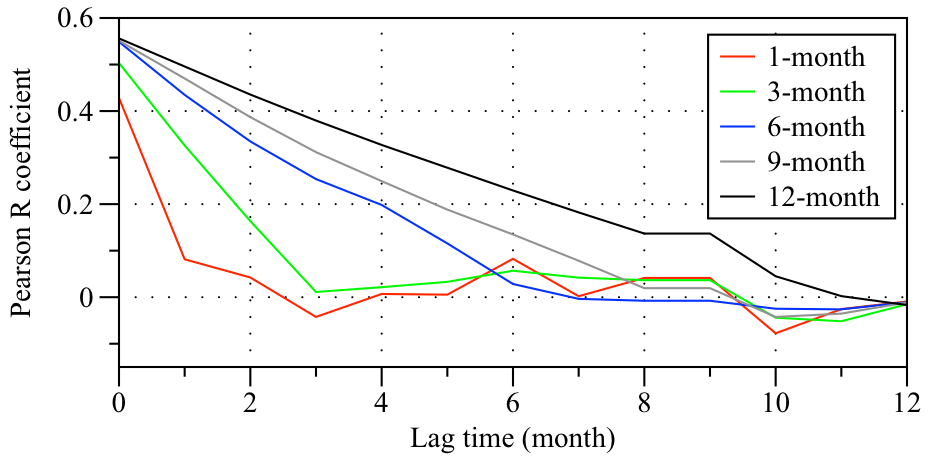
The correlation analysis also suggested that there were obvious increasing tendencies of Pearson R correlation with accumulated timescales in SPEI vs. SSI, with the largest correlation values at zero month time lag. This indicated that, in such small size basins, less than one month was enough for hydrological system response to climate factors.
In this study, two multi-scalar drought indices, SPEI and SSI, were used to characterize the meteorological and hydrological droughts in the Qingjianhe River basin, respectively. Results showed that the Qingjianhe River basin experienced near normal condition during the study period. As a whole, this semi-arid basin mainly had the meteorological drought episodes in the mid-1960s, late-1990s and the 2000s depicted by 12-month SPEI. The drying trend could also be depicted by the hydrological drought index (12-month SSI) at both upstream and downstream stations (Zichang and Yanchuan), but the decreasing trends were not significant.
The correlation analysis between SPEI and SSI with different time lags suggested that, the response relationship of hydrological system to precipitation and evaporation was highly nonlinear due to the effects of intensive human activities. In addition, results indicated that hydrological system respond rapidly to meteorological conditions in this semi-arid region. The nonlinear response of hydrological drought to meteorological drought was caused by both nature and human factors.
The data and code used in this research will be made available upon request; please send request to libinquan@gmail.com (Binquan Li) for data and code.
The authors declare that they have no conflict of interest.
This article is part of the special issue “Innovative water resources management – understanding and balancing interactions between humankind and nature”. It is a result of the 8th International Water Resources Management Conference of ICWRS, Beijing, China, 13–15 June 2018.
This work was supported by the National Key R&D
Program of China (2016YFC0402706, 2016YFA0601501, 2016YFA0601601), National
Natural Science Foundation of China (51509067, 41730750), Special Scientific
Research Fund of Public Welfare Industry of Ministry of Water Resources of
China (201501004), China Postdoctoral Science Foundation (2017T100388), and
Research Funds for Arid Meteorology (IAM201510).
Edited by: Wenchao Sun
Reviewed by: two anonymous referees
Kendall, M. G.: Rand correlation methods, Charles Griffin, London, 1975.
Li, B., Liang, Z., Yu, Z., and Acharya, K.: Evaluation of drought and wetness episodes in a cold region (Northeast China) since 1898 with different drought indices, Nat. Hazards, 71, 2063–2085, 2014.
Li, B., Zhou, W., Zhao, Y., Ju, Q., Yu, Z., Liang, Z., and Acharya, K.: Using the SPEI to assess recent climate change in the Yarlung Zangbo River Basin, South Tibet, Water, 7, 5474–5486, 2015.
Li, B., Liang, Z., Zhang, J., and Wang, Q.: A revised drought index based on precipitation and pan evaporation, Int. J. Climatol., 37, 793–801, 2017.
Li, B., Liang, Z., Zhang, J., Wang, Q., Zhao, W., Zhang, H., Wang, J., and Hu, Y.: Attribution analysis of runoff decline in a semiarid region of the Loess Plateau, China, Theor. Appl. Climatol., 131, 845–855, 2018.
Lu, E., Luo, Y., Zhang, R., Wu, Q., and Liu, L.: Regional atmospheric anomalies responsible for the 2009–2010 severe drought in China, J. Geophys. Res., 116, D21114, https://doi.org/10.1029/2011JD015706, 2011.
Mann, H. B.: Nonparametric tests against trend, Econometrica, 13, 245–259, 1945.
McKee, T. B., Doesken, N. J., and Kleist, J.: The relationship of drought frequency and duration to time scales, Proceedings of the 8th Conference on Applied Climatology, American Meteorological Society Boston, MA, 179–183, 1993.
Mishra, A. K. and Singh, V. P.: A review of drought concepts, J. Hydrol., 391, 202–216, 2010.
Obasi, G. O. P.: WMO's role in the international decade for natural disaster reduction, B. Am. Meteorol. Soc., 75, 1655–1661, 1994.
Palmer, W. C.: Meteorologic Drought, US Department of Commerce, Weather Bureau, Research Paper No. 45, p. 58, 1965.
Vicente-Serrano, S. M., Begueria, S., and López-Moreno, J. I.: A multiscalar drought index sensitive to global warming: The Standardized Precipitation Evapotranspiration Index, J. Climate, 23, 1696–1718, https://doi.org/10.1175/2009jcli2909.1, 2010.
Vicente-Serrano, S. M., López-Moreno, J. I., Beguería, S., Lorenzo-Lacruz, J., Azorin-Molina, C., and Morán-Tejeda, E.: Accurate computation of a streamflow drought index, J. Hydrol. Eng., 17, 318–332, 2011.
Yatagai, A., Kamiguchi, K., Arakawa, O., Hamada, A., Yasutomi, N., and Kitoh, A.: APHRODITE: Constructing a long-term daily gridded precipitation dataset for Asia based on a dense network of rain gauges, B. Am. Meteorol. Soc, 93, 1401–1415, 2012.
Yue, S., Pilon, P., Phinney, B., and Cavadias, G.: The influence of autocorrelation on the ability to detect trend in hydrological series, Hydrol. Process., 16, 1807–1829, 2002.
Zou, X., Zhai, P., and Zhang, Q.: Variations in droughts over China: 1951–2003, Geophys. Res. Lett., 32, L04707, https://doi.org/10.1029/2004GL021853, 2005.