the Creative Commons Attribution 4.0 License.
the Creative Commons Attribution 4.0 License.
 | 05 Jun 2018
Understanding the Impacts of Climate Change in the Tana River Basin, Kenya
Lal Muthuwatta
Aditya Sood
Matthew McCartney
Nishchitha Sandeepana Silva
Alfred Opere
In the Tana River Basin in Kenya, six Regional Circulation Models (RCMs) simulating two Representative Concentration Pathways (RCPs) (i.e., 4.5 and 8.5) were used as input to the Soil and Water Assessment Tool (SWAT) model to determine the possible implications for the hydrology and water resources of the basin. Four hydrological characteristics – water yield, groundwater recharge, base flow and flow regulation – were determined and mapped throughout the basin for three 30-year time periods: 2020–2049, 2040–2069 and 2070–2099. Results were compared with a baseline period, 1983–2011. All four hydrological characteristics show steady increases under both RCPs for the entire basin but with considerable spatial heterogeneity and greater increases under RCP 8.5 than RCP 4.5. The results have important implications for the way water resources in the basin are managed. It is imperative that water managers and policy makers take into account the additional challenges imposed by climate change in operating built infrastructure.
- Article
(779 KB) - Full-text XML
- BibTeX
- EndNote


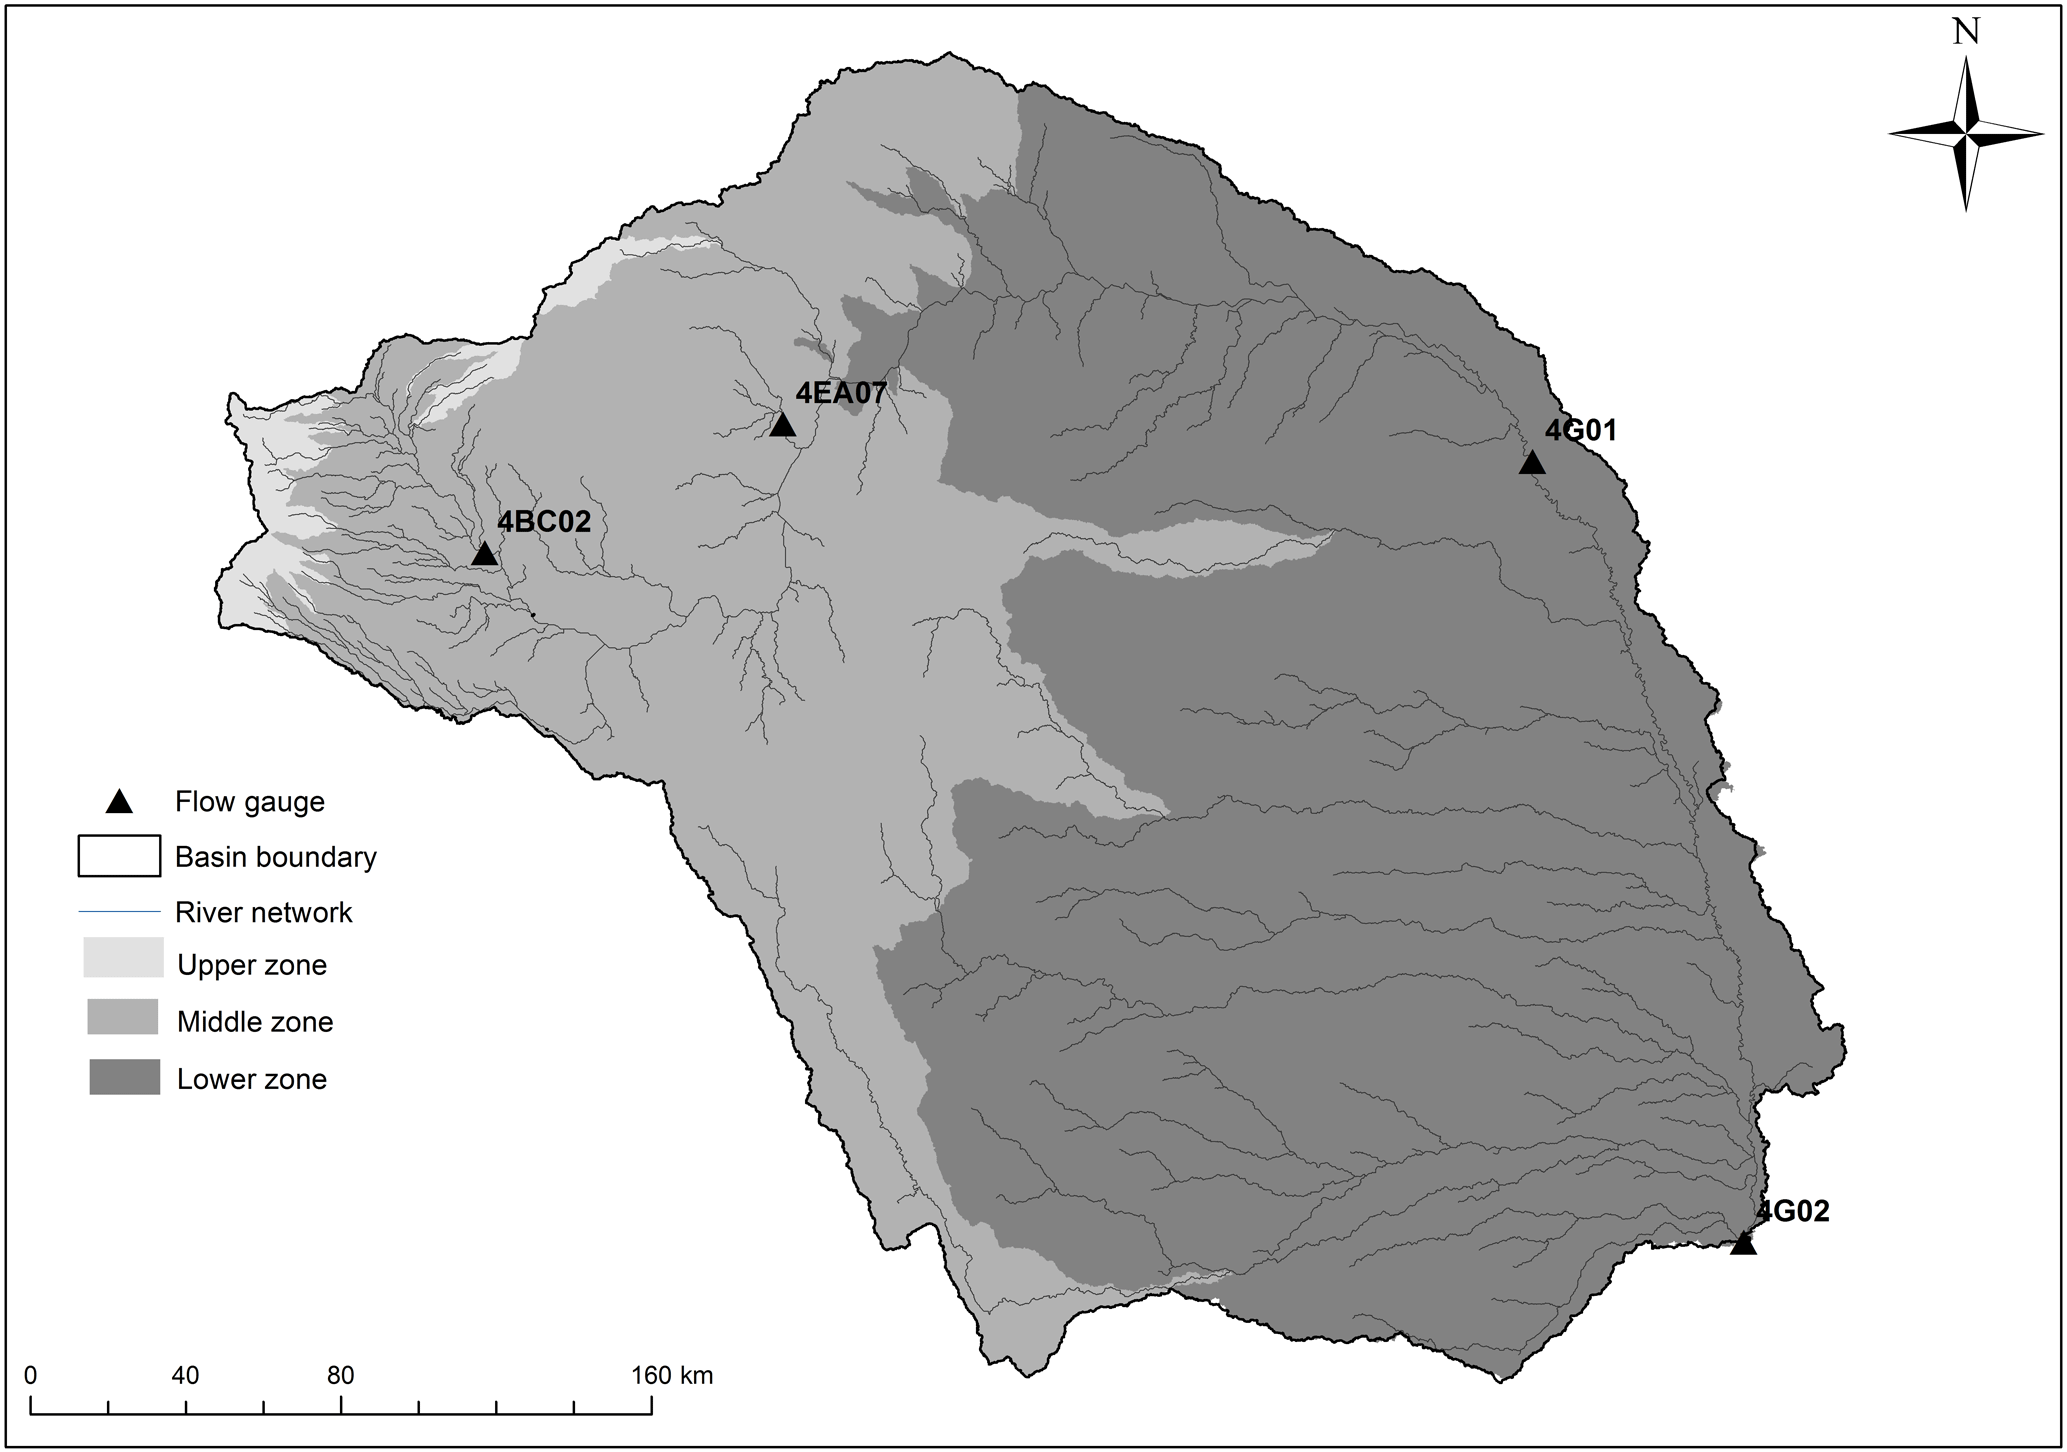
Figure 1Tana River Basin showing three elevation zones, river network and flow gauging stations.
The Tana River plays a prominent role in Kenya. It starts from the Aberdare Mountains, west of Nyeri, Kenya and flows into the Indian Ocean after covering about 1000 km (Fig. 1). The catchment area of the river (83 972 km2) covers 21 % of the Kenya's land area and holds about 18 % of the country's population (Sood et al., 2017). The river basin supplies 80 % of Nairobi's domestic water supply via transfer from the Thika dam (Baker et al., 2015). Approximately 50 % of Kenya's total electricity demand is met by the series of five dams built along the river (Baker et al., 2015). Fisheries and agriculture in the basin provide a major source of food and employment for the people that live in the basin and in other parts of the country. One of the basin's important ecosystems is the Tana Delta at the coast: almost 50 % of the country's freshwater discharge into the Indian Ocean is made up of the flow from the Tana River. The delta was designated as a Ramsar site in 2012 and is home to several endangered species. The basin has two rainy seasons (i.e. bimodal distribution) with the mean annual rainfall of about 648 mm (1983–2011). Approximately 92 % of the rain falls during these wet seasons, which are from March–May, and October–January.
As part of the “Water Infrastructure Solutions from Eco-system Services underpinning Climate Resilient Policies and Programmes” (WISE-UP) project, six Regional Circulation Models (RCMs), simulating two Representative Concentration Pathways (i.e. RCPs 4.5 and 8.5), were used as an input to a hydrological model. Representative Concentration Pathways (RCPs) are greenhouse gas concentration trajectories adapted by the IPCC for its fifth Assessment Report (AR5) in 2014. RCP 4.5 assumes that the GHG emissions will increase till about 2040 and then decline, whereas RCP 8.5 assumes that the emissions will continue to rise throughout the century and represents the worst-case scenario. RCP 4.5 and RCP 8.5 corresponds to 4.5 and 8.5 W m−2 increase in radiative forcing by the year 2100 as compared to pre-industrial values.
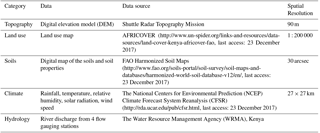
Table 1Input data used in setting up the SWAT model for the Tana River Basin.
The Soil and Water Assessment Tool (SWAT) (Arnold et al., 1998) was used to simulate the hydrology of the basin for current and future scenarios. The model was configured and calibrated for the current situation and then used to determine the possible impacts of climate change on the hydrology of the basin.
SWAT is a publically available rainfall–runoff hydrology and water quality model. The model possesses adequate representation of physical processes governing hydrology and is particularly suitable for application in large river basins. In the SWAT model, a river basin is subdivided into multiple sub-catchments, each sub-catchment consisting of at least one representative stream. The sub-catchments are further divided into hydrologic response units (HRUs), which are lumped land areas within the catchment comprising unique land cover, soil, and slope combinations. For a detailed description of the SWAT model, reference is made to Muthuwatta et al. (2014). Various data sets were accumulated from global and local sources. The major data sets used in this study are listed in Table 1.
Table 2Model performance indicators for four locations in Tana River Basin.
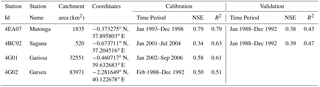
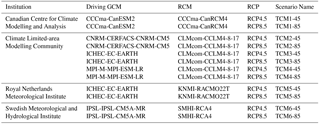
Table 3The climate change scenarios used for the Tana River Basin.
The ArcSWAT interface was used to pre-process the spatial data for the Tana River Basin. The SWAT Calibration and Uncertainty Program (SWATCUP) (Abbaspour, 2011) was used to calibrate the model. The model was calibrated and validated using monthly flow data available at the four locations indicated in Fig. 1. The performance indicators for the model calibration (i.e NSE and R2) are presented in Table 2. The performance indicators, show that the model calibrated well for gauging stations 4EA07, 4G01 and 4G02. These stations are located downstream and represent the larger river basin. The most upstream gauging station (4BC02) did not perform well.
Once calibrated, the SWAT model was run from 1983–2011 to develop a baseline scenario. Multiple climate change scenarios were then run through the SWAT model to determine the impact of climate change on the hydrology of the Tana River basin. In this study, 6 RCMs of the Coordinated Regional Climate Downscaling Experiment (CORDEX: Giorgi and Gutowski, 2016) were used. Data for these RCMs and for each of two Representative Concentration Pathways (RCPs), i.e. RCP 4.5 and RCP 8.5, were used to create 12 CC “scenarios” (Table 3). The model was run for the period 2011 to 2099 and data were analysed for the three periods: 2020–2049, 2040–2069 and 2070–2099. Grid resolution of RCMs range from 25 to 50 km for the African region. Therefore, all six SWAT inputs were downscaled using the methodology described in El-Khoury et al. (2015). The centre of each grid was considered as an independent meteorological station and data were input into the SWAT model. The model assigns the station closest to the centroid of a sub-basin as a representative weather station for that sub-basin and utilizes the corresponding climate data.
Table 4Annual averages of hydrological outputs in the three zones of Tana River Basin for the current scenarios.
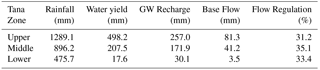
For this study, the Tana Basin was divided into three elevation zones (Fig. 1). Sub-basins with average altitude greater than 2400 m were designated as the “Upper” zone, those with average altitude between 600 and 2400 m were grouped into the “Middle” zone and those below 600 m were grouped into the “Lower” zone. The area in the Upper, Middle and Lower zones are 1514, 29 890 and, 52 568 km2 respectively. In February 2017, stakeholders from institutions with an interest in the basin, including the Kenya Electricity Generating Company, the Ministry of Water and Irrigation, the National Irrigation Board, the Water Resources Management Authority and the Tana and Athi Development Authority, were trained in the use of SWAT and its application to the Tana River Basin.
3.1 Baseline simulation
Four hydrological characteristics – water yield, groundwater recharge, base flow and flow regulation were investigated. Water yield is the total water produced in a catchment that flows out of the catchment. Groundwater recharge is the water percolating beyond the root zone. Base flow is the groundwater contribution to the river flow. “Flow regulation” is the ratio of dry season flow to total annual flow in a stream. The spatial variation of the average annual values (1983–2011) for these hydrological variables and the rainfall are summarized in Table 4.
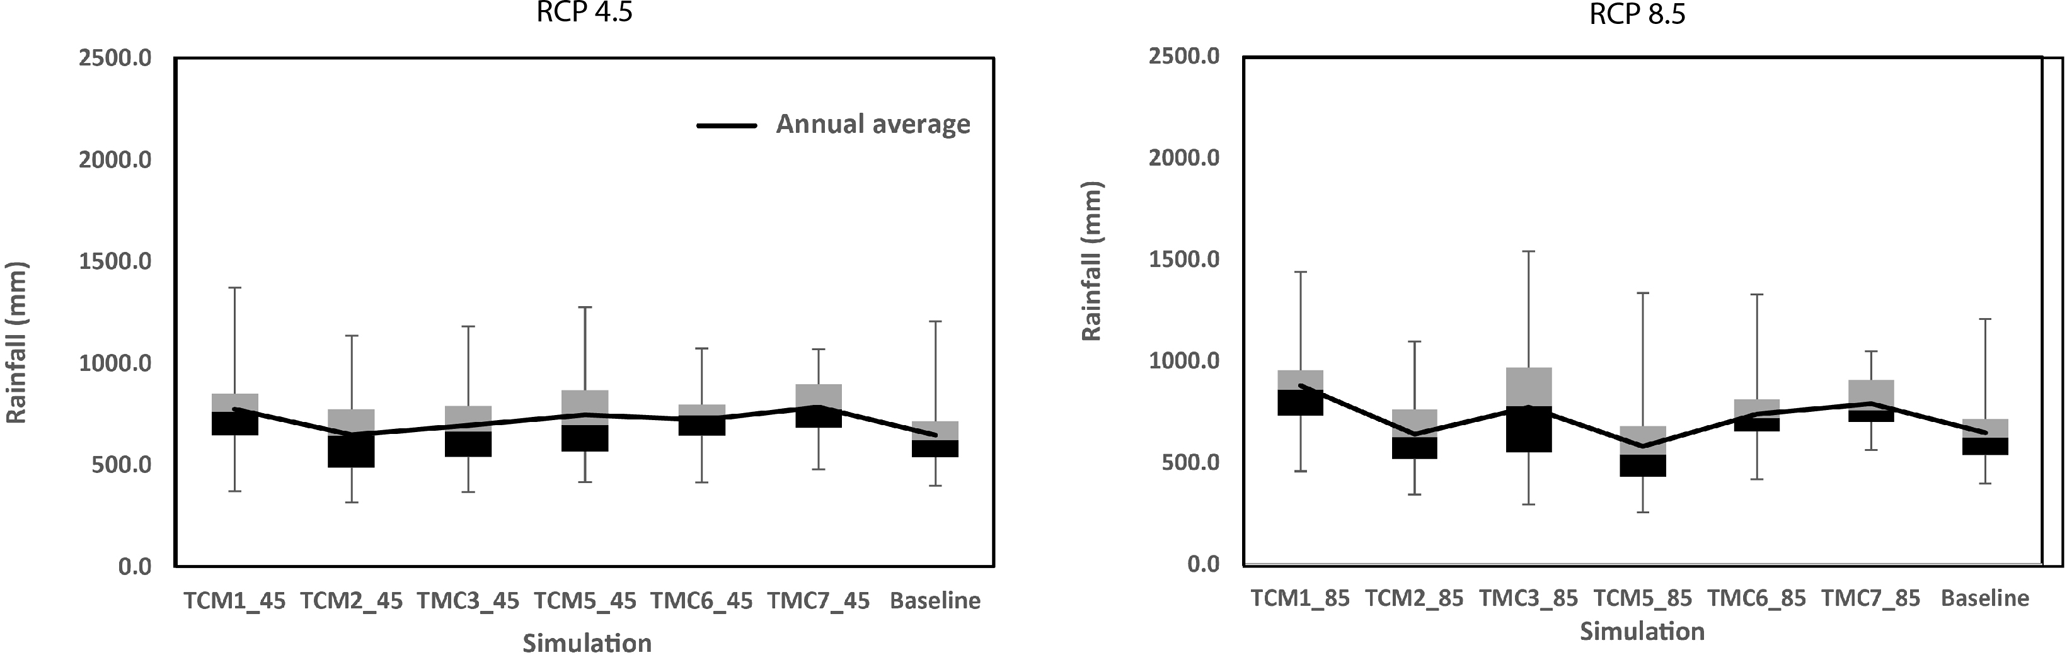
Figure 2Rainfall as annual average for an inter-annual comparison for 2020–2049 and two RCPs.
There is considerable heterogeneity in the response to rainfall throughout the basin, with large differences between the elevation zones. The average annual water yield in the lower zone is only 4 % of the annual rainfall. This compares to 39 % in the upper zone and 23 % in the middle zone. One major reason for higher water yield in the upper zone is topography; the greater slope in the upper zone results in higher runoff than in the middle and lower zones. The annual groundwater recharge in the upper zone is about 20 % of the annual rainfall, it is 19 % for the middle zone and just 6 % in the lower zone. The base flow contribution to water yield is 16 % in the upper zone and 20 % in both the middle and lower zones.
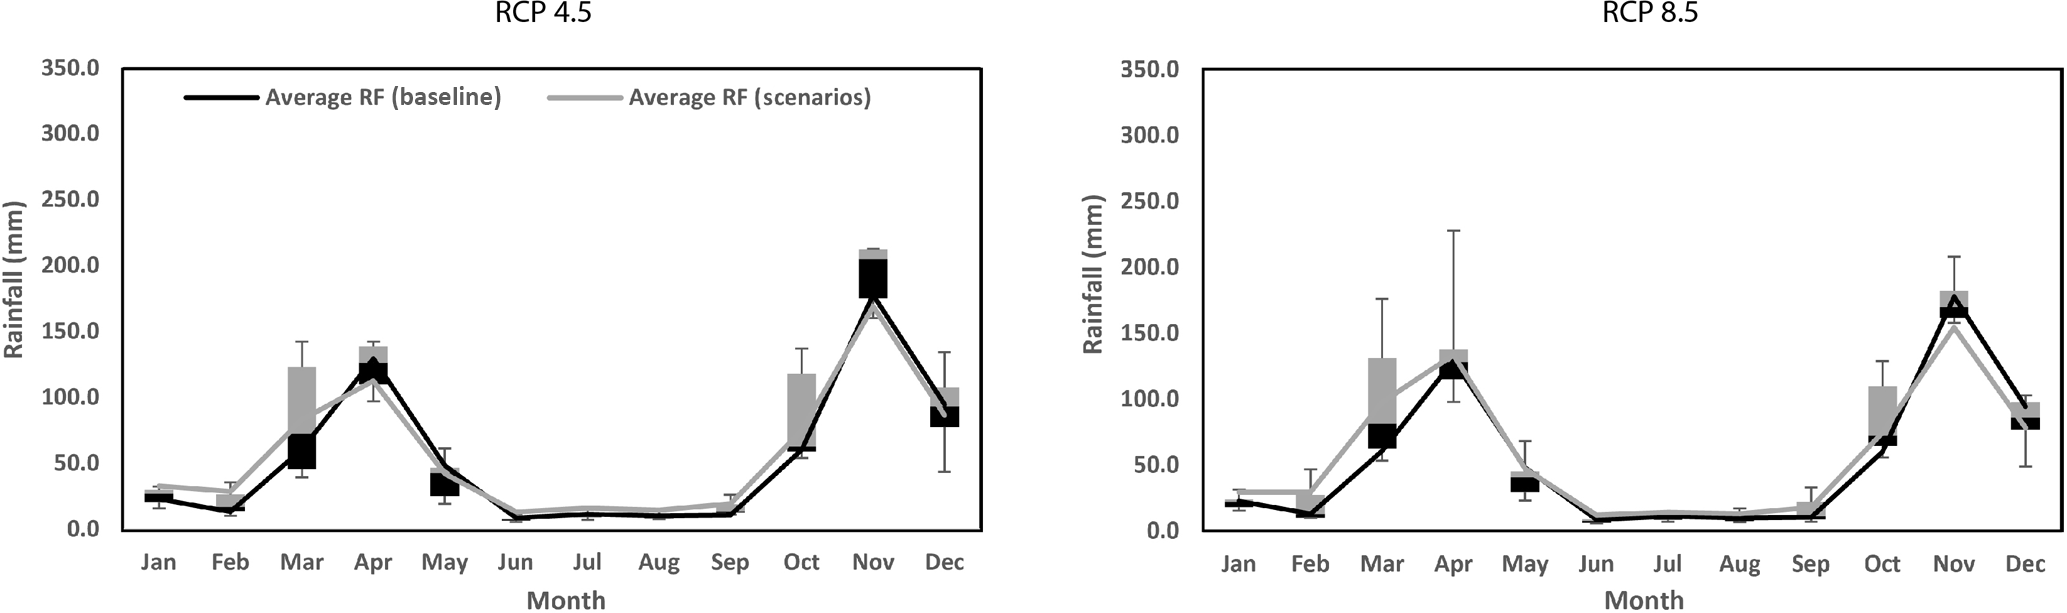
Figure 3Simulated monthly rainfall (averaged across the model ensemble) for 2020–2049 and two RCPs.
3.2 Climate change – Rainfall trends
The results of the annual rainfall for the model simulations indicate that, compared to the baseline, both mean annual rainfall and inter-annual variability increase for both RCPs, with greater increases in RCP 8.5 for all three time periods. Figure 2 presents an inter-year comparison of annual rainfall for the period 2020–2040, two RCPs and six simulations (TCMs). Annual catchment average rainfall in the baseline period is 640 mm divided between two main rainy seasons. It is projected to increase to 787 and 912 mm, with earlier onset of both rainy seasons, by the end of the 21st century under RCP 4.5 and RCP 8.5, respectively.
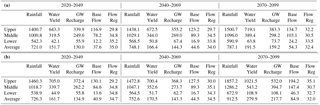
Table 5Impact of CC on rainfall, water yield, GW recharge, base flow and flow regulation (a) average values for all scenarios RCP 4.5; (b) average values for all scenarios RCP 8.5 in mm.
Monthly rainfall, averaged across the ensemble of models (Fig. 3), separately for each RCP, indicate higher extreme values in March and April for RCP 8.5 compared to RCP 4.5 for the period 2020–2049. With the exception of RCP 8.5 for the period 2020–2049, all other periods show a reduction in average rainfall in April and May compared to the baseline. Rainfall in November and December also shows reductions other than the simulated values for the period 2070–2099 under RCP 8.5. These reductions are comparatively higher for RCP 4.5 than in RCP 8.5.
3.3 Climate change – Hydrological characteristics
Table 5 shows average values of rainfall and the four hydrological characteristics for all scenarios for RCP 4.5 and RCP 8.5.The flow generated in all CC scenarios is higher than the average flow generated in the baseline scenario. In general, compared to the baseline scenario, the average flow is higher in all the months in all three time periods with the largest increase in RCP 8.5. Furthermore, the extreme values clearly indicate that, with some exception in the 2020–2049 period, there is greater variability of flow under RCP 8.5 than RCP 4.5. The results also reflect the gradual shift to the earlier onset of rainfall with peak flows moving to earlier in the year.
Of all four variables considered in this study, water yield, groundwater recharge and base flow, increase significantly under both RCPs, across all three-elevation zones. However, flow regulation increases progressively in the middle and lower zones but not in the upper zone during the period 2070–2099. The increases in the hydrological variables are greater for the RCP 8.5 simulations than for RCP 4.5. For instance, for the whole basin, increase of water yield, groundwater recharge and base flow under RCP 4.5 for the period 2070–2099 compared to the baseline are 10.6, 94.8 and 227.9 % respectively. For the same period, respective increases in RCP 8.5 are 197.3, 160.2, and 391.9 %. The overall reductions of flow regulation for the basin are −17.6 and −18.5 % for RCP 4.5 and RCP 8.5 respectively.
The results confirm the findings of other studies that there will likely be a reversal of recent historic trends of declining rainfall. Rather, rainfall is projected to increase across the basin over the remainder of the twenty-first century, with greater increases (up to 43 % by the end of the century) under RCP 8.5 than RCP 4.5. The results also indicate an earlier onset of rainfall for both the long and the short rainy season under both RCPs. A consequence of the increased rainfall is disproportionate increase in flow from the basin.
The impact of climate change on water yield, groundwater recharge, base flow and flow regulation were estimated. The first three variables (water yield, groundwater recharge and base flow) progressively increase under both RCPs, but with greater increases under RCP 8.5 than 4.5. In contrast, natural flow regulation reduces across most of the basin in most future time periods, resulting in increased seasonal variability in flows and potentially larger floods. The reductions in flow regulation are comparable under both RCPs.
Increases in rainfall and flow broadly indicate an improved water resource situation in the future, with opportunities for increasing benefits from built infrastructure (i.e., hydropower generation as well as irrigation and water supply diversions). However, declining natural flow regulation, increased variability, and large increases in the frequency and magnitude of floods pose a significant risk that threatens to undermine development opportunities. Water resources management is likely to be more difficult than under historic climatic conditions. To build resilience, water resource managers need to adapt to changing conditions; increased flows but also greater variability.
Sources of the climate, landuse and soils data used in this study are shown in Table 1. Stream flow data sets used here were obtained from The Water Resource Management Agency (WRMA), Kenya and are not available to the public as far as the authors know. Therefore, the authors cannot provide them. Further, the Tana SWAT model will soon be added to: http://waterdata.iwmi.org/pages/model_inventory.php (last access: 28 February 2018).
LM and AS developed the SWAT model, and NSS and AO have contributed to the data processing and analysis. MM overlooked this work as the project leader. LM prepared the manuscript with contributions from all co-authors.
The authors declare that they have no conflict of interest.
This article is part of the special issue “Innovative water resources management – understanding and balancing interactions between humankind and nature”. It is a result of the 8th International Water Resources Management Conference of ICWRS, Beijing, China, 13–15 June 2018.
This work was undertaken as part of the Water Infrastructure Solutions from
Ecosystem Services Underpinning Climate Resilient Policies and Programmes
(WISE-UP to Climate) project coordinated by the International Union for
Conservation of Nature (IUCN). It was funded by the International Climate
Initiative, Bundesministerium für Umwelt, Naturschutz, Bau und
Reaktorsicherheit (BMUB) (Federal Ministry for the Environment, Nature
Conservation, Building and Nuclear Safety), Germany, with additional support
from the CGIAR Fund Donors and Research Program on Water, Land and Ecosystems
(WLE).
Edited by: Zongxue Xu
Reviewed by: two anonymous referees
Abbaspour, K. C.: SWAT-CUP4: SWAT Calibration and Uncertainty Programs: A user manual, Department of Systems Analysis, Integrated Assessment Modelling (SIAM), Swiss Federal Institute of Aquatic Science and Technology (Eawag), Dübendorf, Switzerland, 2011.
Arnold, J. G., Srinivasan, R., Muttiah, R. S., and Williams, J. R.: Large area hydrologic modeling and assessment Part 1: Model development, J. Am. Water Resour. As., 34, 73–89, 1998.
Baker, T., Kiptala, J., Olaka, L., Oates, N., Hussain, A., and McCartney, M.: Baseline Review and Ecosystem Services Assessment of the Tana River Basin, Kenya. IWMI Working paper 165. International Water Management Institute, Colombo, Sri Lanka, 2015.
El-Khoury, A., Seidou, O., Lapen, D. R. L., Que, Z., Mohammadian, M., Sunohara, M., and Bahram, D.: Combined impacts of future climate and land use changes on discharge, and nitrogen and phosphorus loads for a Canadian river basin, J. Environ. Manage., 151, 76–86, 2015.
Giorgi, F. and Gutowski, W. J.: Coordinated experiments for projections of regional climate change, Current Climate Change Reports, 2, 202–210, 2016.
Muthuwatta, L. P., Sood, A., and Sharma, B.: Model to assess the impacts of external drivers on the hydrology of the Ganges River Basin, IAHS Publ., 364, 76–81, 2014.
Sood, A., Muthuwatta, L., Silva, N., and McCartney, M.: Understanding the hydrological impacts of climate change in the Tana River Basin, Kenya, IWMI Working paper 178, International Water Management Institute, Colombo, Sri Lanka, 2017.