the Creative Commons Attribution 4.0 License.
the Creative Commons Attribution 4.0 License.
 | 05 Jun 2018
Study on the influence on water ecosystem by a lake inflow filtration system
Sushu Wu
Shipei Gao
Xiaodong Hu
Songgan Weng
Liuchao Guo
Lakes play important roles in the economic-social sustainable development. However, due to unreasonable development and urbanization in recent years, lake water pollution and ecological degradation have occurred in China. The improvement of the lake inflow water quality is very important. A filtration system includes Gravel filtering system, Aquatic plant area and Ecological bag area was established. The test river is one of the typical lake inflow river and located in the river network in the Chang Dang lake, China. Water quality, zooplankton and phytoplankton in the inflow river were observed form July to mid-August in order to analyze the general process. The average removal rate of NH3-N (ammonia nitrogen) TN (total nitrogen) and TP (total phosphorus) is 28.33, 25.76 and 24.43 %, respectively. The Pantle-Buck method was used to evaluate the water quality and the B∕T index was used to evaluate the nutrition situation. The B∕T values were reduced by 20 % and the SI pollution index was reduced by 11.8 %. Therefore, a positive effect on the water's ecological restoration was achieved by the filtration system.
- Article
(4497 KB) - Full-text XML
- BibTeX
- EndNote


Lakes play important roles in the nature material circulation and economic-social sustainable development (Jun et al., 2006; Wei et al., 2006; Yang et al., 2008). As a type of important natural resource, it have multiple functions, such as flood diversion and storage, water supply, habitat, biodiversity maintenance, water quality purifying, material production, climate regulation, breeding, shipping, and leisure tourism (Houtven et al., 2014). Lakes are also important guarantees of the ecological environment, by providing the maintenance of regional ecological balances. However, due to unreasonable development of natural resources and urbanization in recent years, lake water pollution and ecological degradation have occurred (Wei and Chuan, 2003). These factors have even affected the drinking water safety, causing a threat to the sustainable use of lake water resources (Hesheng, 2001; Huixia and Jibo, 2011). Lake eutrophication has become the most serious problem of the water environments in economically developed areas. Therefore, effectively governing lake eutrophication has become the focus of the current water environment governance (Cohen et al., 2016; Li et al., 2006; Tian et al., 2006; Wang and Li, 2003).
2.1 Test site
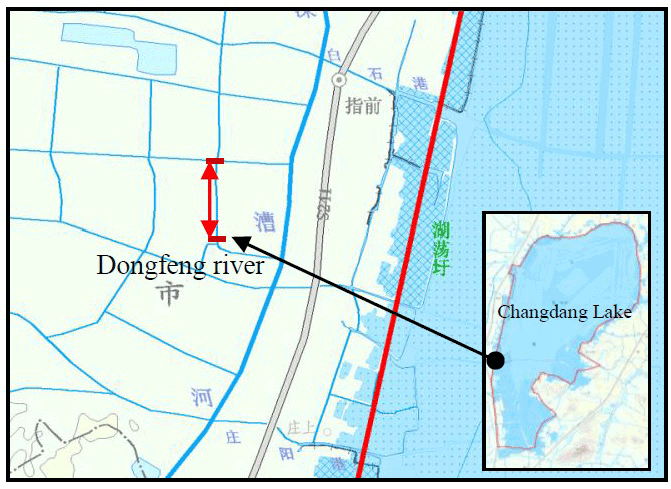
The contaminants are mainly flowing into the lakes through the inflow rivers and the degradation of river flow water pollution is very important to the lake (Du et al., 2017; Naftz, 2017; Jiang et al., 2006; Jiang and Xiao, 2011). The test sites of the ecological filtering system were located in Dongfeng River, one of the typical inflow rivers of Changdang Lake, Jiangsu province, China (Fig. 1). In this study, approximately 150 m of the channel was selected to apply the ecological filtration system.
2.2 Establishment of the ecological filtering system
2.2.1 Gravel filtering system
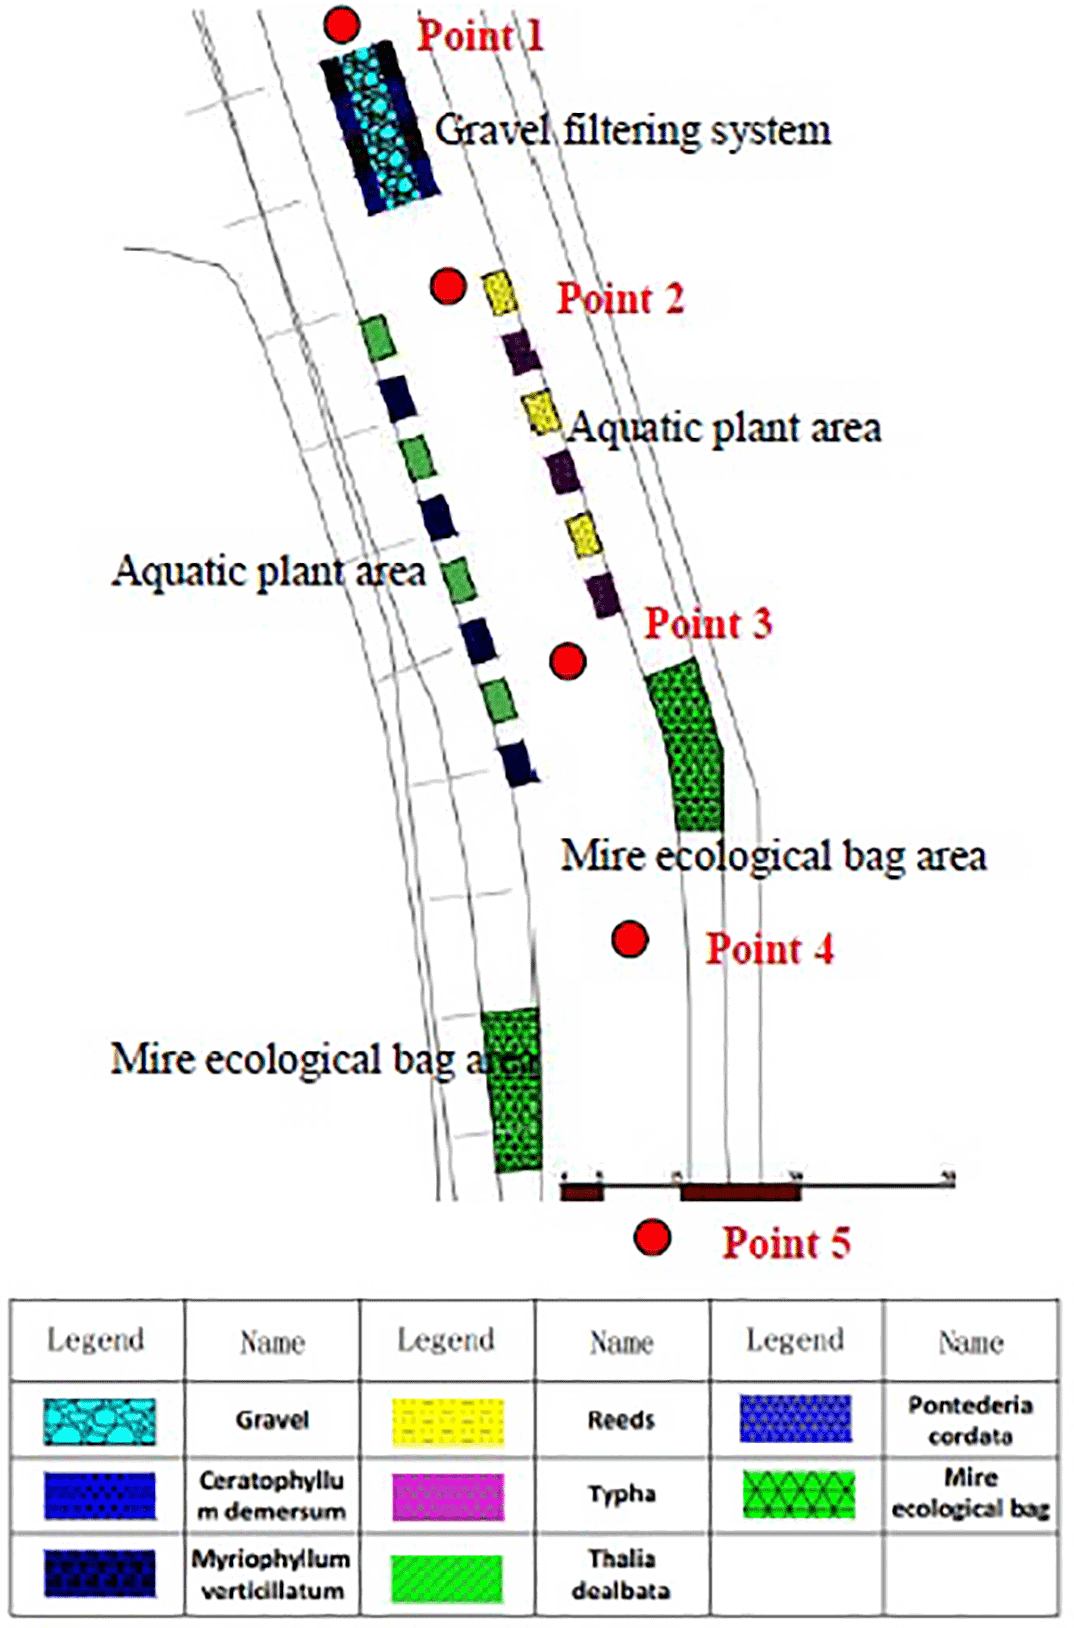
A gravel filtering system was set up at the entrance of the ecological filtering system (Fig. 2). The gravel with particle sizes of 30 to 70 mm was used to pave a three layer section in the center of the channel, and each tile area was 5 m wide × 20 m long. Submerged plants, such as ceratophyllum demersum and myriophyllum verticillatum, were alternatively planted on both sides of gravel areas, and each planting area was 5 m × 2 m, with a total of 8 pieces.
2.2.2 Aquatic plant area
In the downstream of the gravel filtering area, reeds, typha, thalia dealbata, and pontederia cordata were alternatively planted in blocks, with a planting area of 5 m × 3 m for each block, and a block interval of approximately 3 m. At the corners on the land of each block, a clump of iris wilsonii (total of 8 strains) was planted to form a landscape area.
2.2.3 Mire ecological bag area
Mire ecological bags were allocated in the downstream of the aquatic plant area, and a mire bag ecological recovery area was arranged in a block on both sides of the rivers, with each area measuring 7 m × 20 m.
2.3 Sampling and monitoring design
Five sampling points were set in this study's test. These were located in the entrance section center of the ecological filtering system (Point 1); the terminal section center of the gravel ecological filtering system (Point 2); the terminal section center of the plant ecological filtering system (Point 3); the terminal section center of the ecological bag filtering system (Point 4); and the section center 10 m outside the exit of the ecological filtering system (Point 5), respectively. The influences of an ecological filtering system on the quality and ecology of the water were primarily analyzed. The test items included the TP, TN, ammonia nitrogen, permanganate index, flow velocity, water level, and the microscopic examinations of phytoplankton and zooplankton.
The sampling time of this study's test was between 5 June and 5 September, with a weekly sampling frequency schedule, and a total of 13 samplings taken. The total nitrogen, total phosphorus, ammonia nitrogen and permanganate index were measured. The other hydrological data were determined by field instruments. The phytoplankton was collected according to the requirements of the Lake Ecosystem Observation Method for the purposes of classification, identification, and counting during this study's experimental testing process.
2.4 Evaluation of water quality eutrophication
Five parameters were selected, including chlorophyll a (chl a), total phosphorus (TP), total nitrogen (TN), transparency (SD), and potassium permanganate index (CODMn). The calculation equation of the comprehensive nutrition index is shown as follows:
In Eq. (1), TLI (Σ) indicates the comprehensive nutrition state index; TLI (j) represents the nutrition state index of the jth parameter; and Wj indicates the relative weight of nutrition state index of the jth parameter.
When chl a is taken as a basic parameter, then the calculation equation of the normalized relative weight of the jth parameter is as shown below:
where rij is the correlation coefficient of the jth parameter and basic parameter chl a; and m is the number of evaluation parameters.
2.5 Ecological pollution index
Two pollution indexes are used to indicate the water quality by ecological indicators. The Pantle-Buck method was used to evaluate the water quality by phytoplankton and the B∕T index was used to evaluate the nutrition situation by species of zooplankton.
A rotifers indicator B∕T index (Sladeck., 1983) was used to evaluate the nutrition situation of the water quality as follows: (species of brachionus) ∕ T (species of trichocerca).
A Pantle-Buck method (Pantle et al., 1995) was used to calculate the pollution index in order to evaluate the water quality. The equation is shown as follows:
In the equation, SI is the pollution index; s is the algae pollution indication level; and h is the estimated number grade of this type of algae.
3.1 Analysis of the water quality
3.1.1 Changes in the ammonia nitrogen
It can be seen from Fig. 3 that the ecological filtering system in the tested river had a certain intercept of ammonia nitrogen. At the beginning of the ecological filtering system, the intercept rate was quite low, at 18.70 %. However, as time went on, as of 31 July, the intercept rate was found to been increased to 33.03 %. It can be seen that as the self-improvement process of the ecological filtering system progressed, the intercept rate of the ammonia nitrogen was also gradually increased. It was found that, between 7 August and 5 September, the intercept rate of the ammonia nitrogen for the eco ⋅ logical filtering system was maintained at a higher level, with a change range of between 29.46 and 33.33 %. A peak was reached on 5 September, and the ecological filtering system was considered to be stable during this period. As viewed from the perspective of the entire process, the average intercept rate of the ammonia nitrogen was 28.33 %, and reached 29.90 % when the ecosystem's stability was achieved.
As viewed from the perspective of the change laws of the ammonia nitrogen between the points after the stability of ecological filtering system was achieved, the changes between Point 1 (section center 10 m in front of the ecological filtering system's entrance), and Point 2 (terminal section center of the gravel filtering system) were found to be larger than the other points. These results indicated that the gravel ecological filtering system had the most obvious incept effect on the ammonia nitrogen in the entire system. This may have been due to effects of the biomembrane system which was formed by the gravel, and also that the ceratophyllum demersum and myriophyllum verticillatum growing on the gravel absorbed some of the ammonia nitrogen (Kim et al., 2000). The overall inflow water containing ammonia nitrogen in the tested river was classified as a Grade-4 (1.0–1.5 mg L−1) water quality level. In the inflow water which was filtered by the river's ecological filtering system, the overall outflow water reached a Grade-3 (0.5–1.0 mg L−1) quality level.

3.1.2 Changes in the total nitrogen
It can be seen from Fig. 4 that the change laws of intercept rate of the total nitrogen were roughly the same as that of the ammonia nitrogen in the tested rivers. The minimum was found to be 17.50 % at the beginning of the ecological filtering system (12 June), and the maximum was 31.03 % (31 July). During the period from 5 June to 31 July, the intercept rate of the total nitrogen displayed a gradual rise, which indicated that the ecological filtering system of the river channel was continuously being self-improved. During the period from 31 July to 5 September, the intercept rate of the total nitrogen of the ecological filtering system maintained a higher level, and fluctuated between 27.59 and 31.03 %. These results proved that the ecological filtering system tended to be stable during this time, with an average intercept rate of total nitrogen of approximately 28.42 %, which was higher than that of the entire process (25.76 %). The overall intercept rate showed a process of a rise-volatility-stability pattern.
As viewed from the perspective of the stable ecological filtering system, the changes between Point 1 and Point 2 were determined to be larger. Therefore, it could be concluded that the gravel ecosystem played the largest role in the entire system, followed by that between Point 2 and Point 3, and so on, in the plant ecological filtering system.

3.1.3 Changes in the total phosphorus
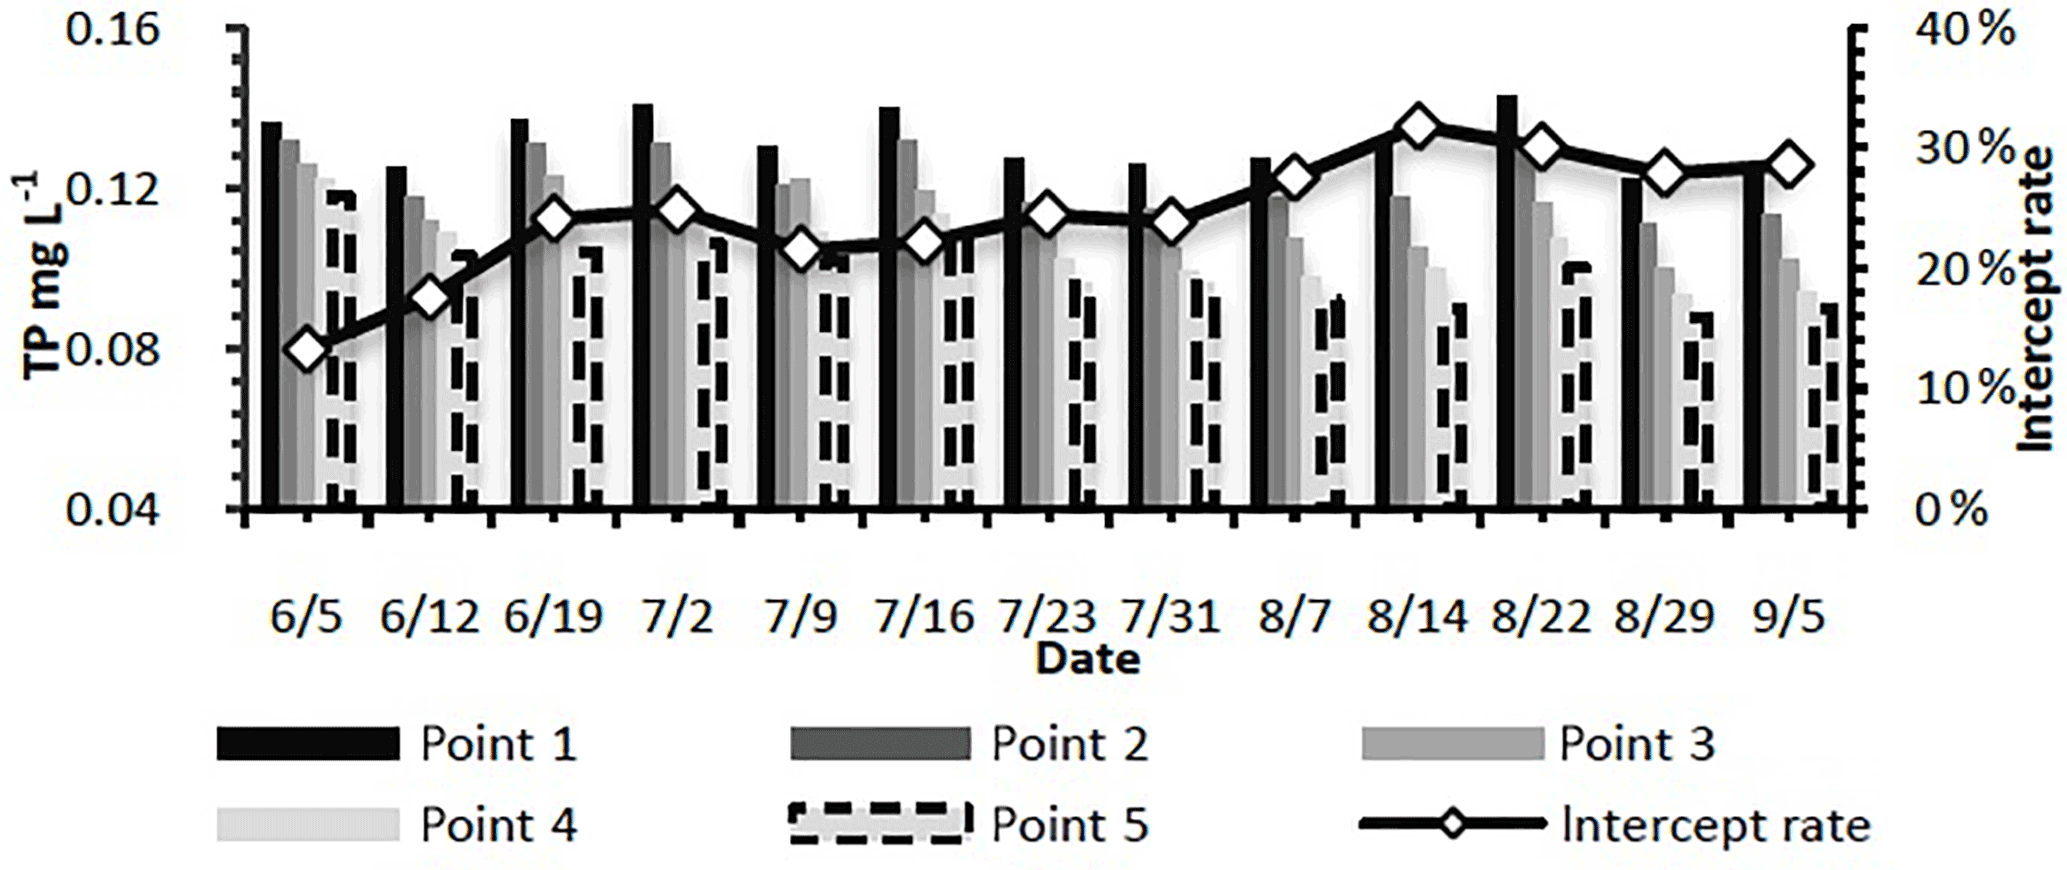
It can be seen from Fig. 5 that the ecological filtering system had a good effect on the interception of the total phosphorus. The minimum of the intercept rate was determined to be 13.24 %, and the maximum was 31.82 %. The overall intercept rate showed a rising process of volatility, and the average intercept rate of the total phosphorus was 24.43 %. In June, due to the ecological filtering system at the early stage being posterior to the establishment, the interception rate of the total phosphorus was found to be lower only due to the intercept effects of the gravel and the absorption of plants and microorganisms, and thereby the intercept was at a lower level. From July to mid-August, the interception rate of the total phosphorus increased in volatility. In terms of the several samplings taken after mid-August, the interception rate of the total nitrogen presented a low-amplitude decrease, while displaying a higher level as a whole. The specific reasons for these results require further study.
As viewed from the perspective of the monitoring data after the ecosystem achieved stability, the total phosphorus degradation between Point 1 and Point 3 was higher, which further proved the previous conclusions, for example that the gravel ecological filtering and plant filtering systems had good effects on the improvements in the water quality. It was determined that biomembranes were formed on the gravel during this period, when the plants grew vigorously to form a barrier in the water, and intercepted and adsorbed insoluble phosphorus pollutants in the water (Xinyan et al., 2006). Also, a portion of the phosphorus was absorbed by plant growth.
3.1.4 Changes in permanganate index
Figure 6 illustrates that the interception of the permanganate index presented a larger volatility, of which the minimum was 6.90 % at the beginning of ecological filtering system, and the maximum reached 20.00 % on 14 August. In terms of the entire sampling period, the interception rate of the ecological filtering system still showed a rising trend, and the average interception rate of the permanganate index was 14.77 %.
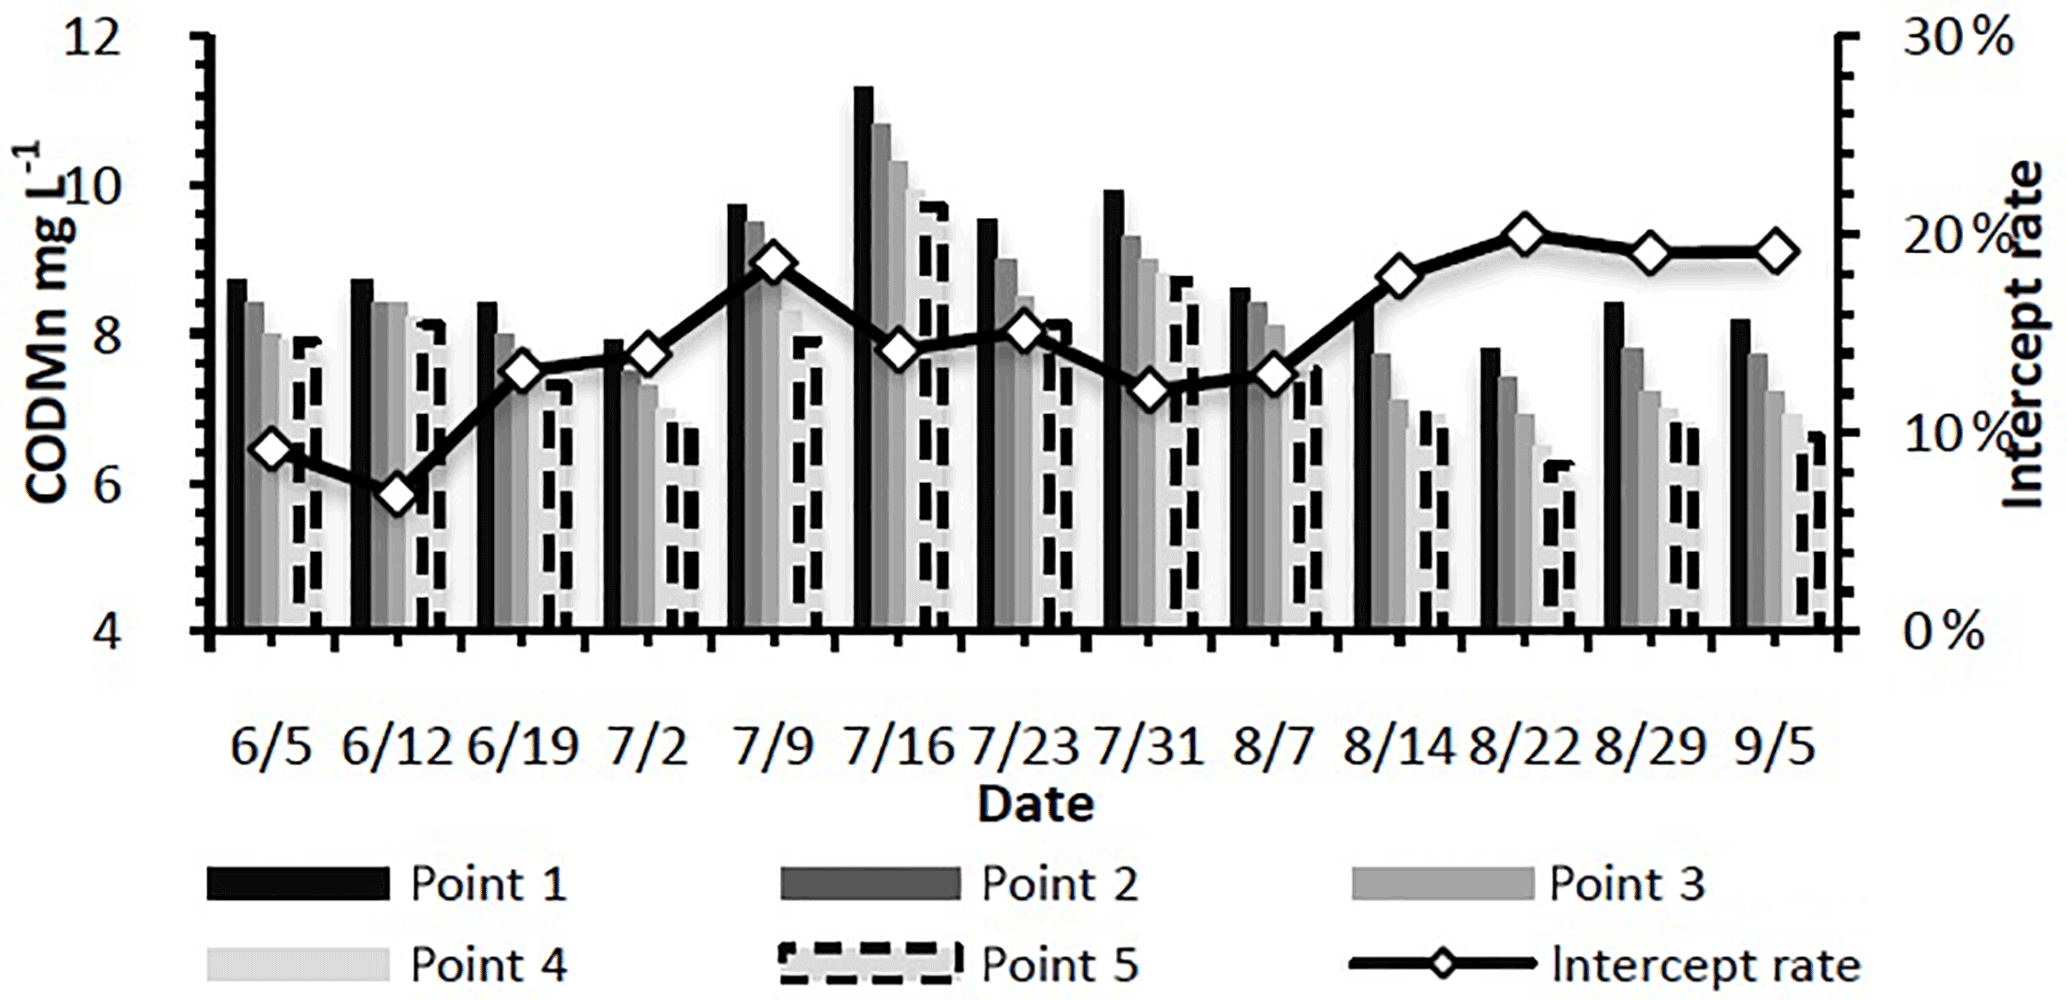
The ecological filtering system had a lower intercept rate of CODMn, mainly due to the fact that the CODMn belonged to the organic matter, was not easily absorbed and used directly by the plants and microbes, and its removal mainly relied on the intercept effect of the biomembranes formed by the gravel and plants. Following the stability of the ecological filter system, the changes between Point 1 and Point 3 were larger, while those between Point 3 and Point 5 were slightly smaller. These results indicated that the gravel and plant ecological systems had a better purification effect on the permanganate index than the regions with the ecological bag filtering system.
3.1.5 Changes in water quality eutrophication
During the three-month duration of the sampling period, the monthly averages of chlorophyll a, total phosphorus, total nitrogen, transparency, and permanganate index from June to July, 2015 were selected in order to calculate according to the calculation equations of the comprehensive nutrition state indices, and to obtain the evaluation results of the nutritional status. The results are shown in Table 1.
Table 1Evaluation results of the outflow water eutrophication in the ecological filtering system.
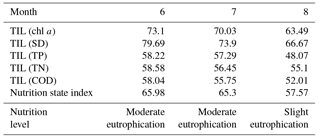
It can be seen that the levels of chlorophyll a, total nitrogen, total phosphorus, and the permanganate index were reduced month by month. Meanwhile, the transparency of the water gradually rose. However, the nutrition state index of water mass gradually declined. Therefore, it was shown that the existence of an ecological filtering system improved the intercept effect of the pollutants, as well as the inflow water quality.
3.2 Changes in the water ecology
3.2.1 Changes in zooplankton
In this study, from June to September 2015, an ecological sampling was carried out in the tested area. According to the quantitative water sample analysis of the zooplankton, the zooplankton species were not found to be reduced in the tested areas. These species included copepod nauplius and copepodite. There were 57 zooplankton species determined during the microscopic examination from June to September. These were made up of 19 species of protozoa, which accounted for 33.3 % of the total species; 25 species of rotifers, which accounted for 43.9 %; 7 species of cladocera, which accounted for 12.3 %; and 6 species of copepods, which made up 10.5 %.
During the period from June to September, the zooplankton species with higher occurrence frequencies in the tested areas were found to include such native animals as histiobalantium, actinophrys, and difflugia globulosa; rotifers, such as keratella cochlearis, brachionus angularis, polyarthra trigla, polyarthra dolichoptera, and trichocerca capucina; cladocera, such as diaphanosoma brachyurum and bosmina coregoni; and copepods, such as mesocyclops leuckarti. In addition, nauplius and copepodite were also determined to have existed. The zooplankton in the tested areas belonged to a cosmopolitanism.
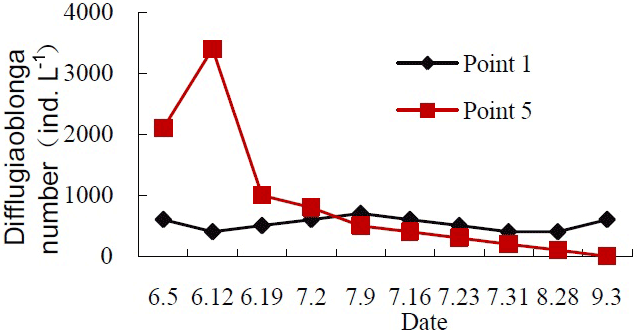
The two sites which were allocated for ecological environment monitoring in the tested areas included Point 1 in the upstream of the tested area, and Point 5 in the downstream of the tested area. Figure 7 illustrates the microscopic difflugiaoblonga number which was determined through quantitative microscopy of the two sites from June to September. As the test river length is 150 m, we assume the temperatures of Point 1 and Point 5 are same, the changes between these two points caused by temperatures are not discussed here.
The B∕T values in the two sites within the tested areas were 2.3 and 1.8 respectively. These results indicated that Point 1 was a eutrophic water mass, and Point 5 was a mesotrophic water mass. It was shown that the establishment of an ecological filtering system played a certain positive role in improving the downstream ecological environment, with a lesser effect on the upstream ecological environment.
3.2.2 Changes in phytoplancton
Within the two sample points of the Changdang Lake tested area, 55 genera and 96 species of phytoplankton were observed. These were dominated by chlorophyta with 28 genera and 52 species; followed by cyanophyta with 11 genera and 13 species; bacillariophyta with 8 genera and 12 species; euglenophyta with 4 genera and 10 species; chrysophyte with 3 genera and 3 species; pyrrhophyta with 3 genera and 3 species; and cryptophyta with 2 genera and 3 species. The dominant species of phytoplankton were chlorella sp., scenedeamus quadricauda and monoraphidium contortum of chlorophyta; cyclotella sp. and melosira granulata var. angustissima of bacillariophyta; pseudanabaena catenata and phormidium sp. of cyanophyta; and crypomonas erosa of cryptophyta. In addition, chlamydomonas sp., pandorina morum and oocystis parva of chlorophyta; and chroomonas acuta of cryptophyta, microcystis aeruginosa, aphanizomenon issatschenkoi and merismopedia minima of cyanophyta also displayed a higher abundance.

It can be seen in Fig. 8 that the phytoplankton abundance was basically equal in two points during the early test period. However, two weeks later, the phytoplankton abundance at Point 5 was lower than that at Point 1 by 29.6 %. As the temperatures rose, the phytoplankton abundance in the two sites showed different degrees of increase. However, those at Point 5 presented a gentle increase trend. The phytoplankton abundance at Point 5 was lower than Point 1 by 50.9 %, which indicated that the aquatic plants at Point 5 caused a certain inhibition in the proliferation of the phytoplankton.
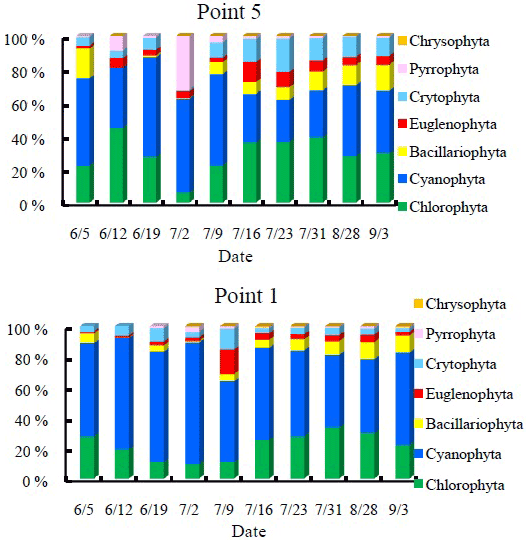
Table 2Nutrition index number and pollution index of the phytoplankton.
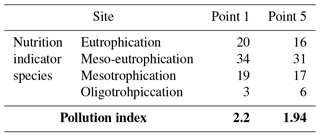
Table 2 shows that the statistical results of the quantities of eutrophic, meso-eutrophic, and mesotrophic indicator species of the phytoplankton at Point 1 were greater than those at Point 5 in the tested areas. Meanwhile, the quantity of oligotrophic indicator species at Point 5 was found to be greater than those at Point 1 by 3 types. As viewed from the perspective of the pollution index, both Point 1 and Point 5 belonged to a meso-eutrophic level. However, the pollution index at Point 5 was reduced by 11.8 % over that at Point 1. These results indicated that the planting of aquatic plant reduced the nutrient concentration in the water mass, inhibiting the quantities and abundances of the eutrophic and meso-eutrophic indicator species to a certain extent, and thereby reducing the water pollution degree. Therefore, a positive effect on the water's ecological restoration was achieved.
In this study, the water quality, zooplankton, and phytoplankton of the ecological filtering system were examined in order to analyze the general degradation process. It was considered that ecological filtering could potentially have a certain improvement effect on the water quality. According to the research regarding the changes in the water's quality and ecology, the ecological filtering system in the Dongfeng River was found to significantly improve the water quality, as well as the inflow water quality. Through the monitoring of the selected indicators, it could be seen that the ecological filtering system of this study displayed purification effects on such pollutants as ammonia nitrogen, total nitrogen, total phosphorus, and permanganate index. The research achievements played an exemplary role in the governance of the inflow water in the Changdang Lake Basin, as well as similar rivers.
Data sets are available upon request by contacting the correspondence author.
The authors declare that they have no conflict of interest.
This article is part of the special issue “Innovative water resources management – understanding and balancing interactions between humankind and nature”. It is a result of the 8th International Water Resources Management Conference of ICWRS, Beijing, China, 13–15 June 2018.
This work was supported by Foundation Research Project of Jiangsu Province
(Grant No., BK20141013) and the Hydraulic Science & Technology Project of
Jiangsu Province (2015033).
Edited by: Depeng Zuo
Reviewed by: two anonymous referees
Cohen, A. S., Gergurich, E. L., Kraemer, B. M., McGlue, M. M., McIntyre, P. B., Russell, J. M., Simmons, J. D., and Swarzenski, P. W.: Climate warming reduces fish production and benthic habitat in Lake Tanganyika, one of the most biodiverse freshwater ecosystems, P. Natl. Acad. Sci. USA, 113, 9563, https://doi.org/10.1073/pnas.1603237113, 2016.
Chen, H. S.: Restoration project of the ecosystem in Tai lake, J. Resources and Environment in the Yangtze Basin, 10, 173–178, 2001.
Du, C. G., Li, Y. M., Wang, Q., Liu, G., Zheng, Z. B., Mu, M., and Li, Y.: Tempo-spatial dynamics of water quality and its response to river flow in estuary of Taihu Lake based on GOCI imagery, J. Environ. Sci. Poll. Res., 24, 28079, https://doi.org/10.1007/s11356-017-0305-7, 2017.
Hesheng, C.: Restoration project of the ecosystem in Tai lake, J. Resour. Environ. Yangtae Basin, 10, 173–178, 2001.
Houtven, G. V., Mansfield, C., Phaneuf, D. J., Haefen, R., Milstead, B., Kenney, M. A., and Reckhow, K. H.: Combining expert elicitation and stated preference methods to value ecosystem services from improved lake water quality, J. Ecol. Econ., 99, 40–52, 2014.
Huixia, J. and Jibo, X.: Eco-remediation of Polluted Rivers: Status Quo and Progress, J. Enviro. Sci. Technol., 34, 138–143, https://doi.org/10.3969/j.issn.1003-6504.2011.03.032, 2011.
Jiang, H. X. and Xiao, J. B.: Eco-remediation of Polluted Rivers: Status Quo and Progress, Environ. Sci. Technol., 34, 138–143, 2011.
Jiang, X. Y., Zhai, J. P., Huang, L., Rong, N.: Experimental study on enrichment of nitrogen and phosphor in several hydrophytes, J. Environ. Protect. Sci., 6, 13–16, 2006.
Jun, L., Liu, C. Q., Xiao, H. Y., Liu, X. Y., Li, Y., and Wang, S. L.: Summer phytoplankton diversity and water quality evaluation in northern part of Taihu Lake, China, J. Ecol. Environ., 15, 453–456, 2006.
Kim, Y. and Kim, W.: Role of water hyacinths and their roots for reducing algal concentration in the effluent from waste stabilization ponds, J. Water Res., 34, 3285–3294, 2000.
Li, J., Liu, C., Xiao, H., Liu, X., and Li, Y. Y.: Summer phytoplankton diversity and water quality evaluation in northern part of Taihu Lake, China, J. Ecol. Environ., 15, 453–456, 2006.
Naftz, D.: Inputs and Internal Cycling of Nitrogen to a Causeway Influenced, Hypersaline Lake, Great Salt Lake, Utah, USA, J. Aquat. Geochem., 23, 199–216, 2017.
Pantle, R. and Buck, H.: Die biologische uberwachung der gewaser und die darstellung ergebinsse, J. Gas und Wasserfach, 96, 604, 1995.
Sladeck, V.: Rotifers as indicators of water quality, J. Hydrobiol., 100, 169–201, 1983.
Tian, W. J., Hao, F. H., Wang, C., and Zhai, J. B.: Ammonia-nitrogen degradation in the typical streams entering Taihu Lake, J. Ecol. Environ., 15, 1138–1141, 2006.
Wang, W. and Li, C. Q.: Stream Corridor and Ecological Rehabilitation, J. Water Resources And Hydropower Engineering, 359, 56–58, 2003.
Wei, T. J., Hao, F. H., Wang, C., and Zhai, J. B.: Ammonia-nitrogen degradation in the typical streams entering Taihu Lake, J. Ecol. Environ., 15, 1138–1141, 2006.
Wei, W. and Chuan, Q. L., Stream Corridor and Ecological Rehabilitation, J. Water Resour. Hydropower Eng., 359, 56–58, 2003.
Xinyan, J., Zhai, J. P., and Huang, L.: Experimental Study on Enrichment of Nitrogen and Phosphor in Several Hydrophytes, J. Environ. Protect. Sci., 6, 13–16, https://doi.org/10.3969/j.issn.1004-6216.2006.06.005, 2006.
Yang, X., Yu, S., Ma, Y., Zhao, Y., Yan, X. J., and Xiu, C. H.: Study on the influence of wetland media on the purifying the micro-polluted raw water, J. Am. Sci., 4, 95–100, 2008.