the Creative Commons Attribution 4.0 License.
the Creative Commons Attribution 4.0 License.
 | 05 Jun 2018
Multiple time scale analysis of sediment and runoff changes in the Lower Yellow River
Kaige Chi
Zhao Gang
Bo Pang
Ziqian Huang
Sediment and runoff changes of seven hydrological stations along the Lower Yellow River (LYR) (Huayuankou Station, Jiahetan Station, Gaocun Station, Sunkou Station, Ai Shan Station, Qikou Station and Lijin Station) from 1980 to 2003 were alanyzed at multiple time scale. The maximum value of monthly, daily and hourly sediment load and runoff conservations were also analyzed with the annually mean value. Mann–Kendall non-parametric mathematics correlation test and Hurst coefficient method were adopted in the study. Research results indicate that (1) the runoff of seven hydrological stations was significantly reduced in the study period at different time scales. However, the trends of sediment load in these stations were not obvious. The sediment load of Huayuankou, Jiahetan and Aishan stations even slightly increased with the runoff decrease. (2) The trends of the sediment load with different time scale showed differences at Luokou and Lijin stations. Although the annually and monthly sediment load were broadly flat, the maximum hourly sediment load showed decrease trend. (3) According to the Hurst coefficients, the trend of sediment and runoff will be continue without taking measures, which proved the necessary of runoff-sediment regulation scheme.
- Article
(1046 KB) - Full-text XML
- BibTeX
- EndNote


Climate changes and human activities have great influence on fluvial geomorphology (Zhang et al., 2006). It is of great importance to understand the sediment and runoff changes for reservoir operation, flood mitigation and fluvial management.
The Yellow River is not only the second largest river of China, but also the second largest river of the world in terms of the sediment load (Kong et al., 2015). Heavily sedimentation resulted in that the river bed of lower yellow river (LYR) is higher than the surrounding lands, which posed a huge flood risk of the residents. Since 2002, a Runoff-Sediment Regulation Scheme (WSRS) has been implemented by the Yellow River Conservancy Commission (YRCC) to reduce the siltation in LYR and transport sediment to sea (Xia et al., 2016). Many researchers tried to analyse the influence of the WSRS. Analysis of the sediment and runoff changes of LYR before WSRS is a critical step for these researches.
Many efforts are devoted to explore the sediment and runoff changes of Yellow River. Liu et al. (2011) analysed the annually runoff and sediment changes of the upper, middle and lower Yellow River from 1950 to 2006. The potential impacts of human activities on the runoff and sediment change in the basin were also discussed in the paper. Kong et al. (2015) analysed the influence of runoff–sediment regulation on the channel scouring and delta maintenance in LYR. Most of these studies were focused on the annually and monthly scale. Causing the most intensive transport processes in rivers occur during the passage of a flood wave. Research on the changes of sediment and runoff at daily and hourly scale, especially for the peak value, is even more important to management practice.
In the research, the sediment and runoff changes of seven stations along LYR from 1983 to 2002 are analysed at multiple time scale. The maximum value of monthly, daily and hourly sediment load and runoff observations were also analysed along with the annually value. The research tried to explore the sediment and runoff changes of LYR before WSRS, and built a foundation for understanding its influences.
2.1 Study area description
The Yellow River originates from the northern Bayan Kala Mountain in the Qinghai Plateau and it through the Huanghuaihai Plain, finally into the Bohai Sea. The total length of the mainstream is 5464 km, the surface of the runoff drop is 4480 m, and the basin total area is 795 000 km2. The downstream reaches in Taohuayu, Zhengzhou City, Henan Province is the Lower Yellow River (LYR), with length of 786 km and catchment area of it is about 23 000 km2, accounting for 3 % of the total drainage area. The total drop of the downstream reaches is 93.6 m with average gradient of 0.12 ‰. The increase of the amount of water accounted for 3.5 % of the Yellow River water. At present, the estuary of the Yellow River is located at the junction of Bohai Bay and Laizhou Bay, it was a new channel shaped by Qingshuigou artificial diversion in 1976 (Yang et al., 2004).
LYR has a wide upper section and a narrow lower section. The reach upstream of Gaocun, with a typical braided channel pattern, is called the braided reach, with a length of 284 km. And the deposition of upside are seriously, the lower section is more stable. The reach lying approximately between Gaocun and Aishan with a channel pattern transitioning from braided to meandering is called the transitional reach, with a length of 184 km, and the reach roughly between Aishan and Lijin with a stable and well-restricted meandering channel pattern is called the meandering reach, with a length of 272 km. Floods in the LYR mainly come from three areas in the middle region. They are Helongjian, Longsanjian and Sanhuajian area. The middle reaches of the Yellow River formed Huayuankou floods. Floods from the upper reaches constitute the base flow of floods in the LYR. In the recent 40 years, the quantity of sediment which transported by flood to the estuary is averaged about 1 billion tons per year (Miao et al., 2010). Heavy sedimentation makes the surface of the Yellow River rise above 2–3 m on both side, even up to 10 m above sea level, which threaten the safety of the people on the coast (Xu et al., 2004). Heavy sedimentation also results in an obvious shrinkage of the main channel with a decrease of flood discharge capacity (Li et al., 2014). The transverse slope of water surface of parts of the Yellow river has already reached 1–2 ‰, which much larger than the vertical drop of 0.14 ‰ (Liu, 2011).
2.2 Data description
The hourly runoff and sediment data of Huayuankou (HYK), Jiahetan (JHT), Gaocun (GC), Sunkou (SK), Aishan (AS), Luokou (LK), and Lijin (LJ), which are the main hydrological stations along the LYR, are adopted in the study. The data is collected from 1980 to 2002. The annually sediment load and runoff are calculated by summing up the hourly data. The maximum value of the monthly, daily and hourly sediment load and runoff are also obtained by statistics of the hourly data.
In this paper, non-parametric Mann–Kendall (MK method) trend test and Hurst coefficient method are used to analysis the sediment and runoff changes of LYR.
3.1 Mann–Kendall trend test
The Mann–Kendall trend test is a rank correlation test between the ranks of observations and their time sequence (Yue et al., 2002). It has been used by many researchers to analyse the trends of precipitation, runoff, temperature, water quality and other elements in time series. The Mann–Kendall test does not require samples to follow a certain distribution (Zhang et al., 2007). It is suitable for non-normal distribution such as hydrology and meteorology. It is a frequently-used time series test method in hydrological and meteorological research (Guo et al., 2010). This method takes the sequence as a prerequisite. And it requires the sequences to be independent and random.
In the Mann–Kendall test, the hypothesis H0 is time-series data (X1…Xn), which are n independent samples with the same distribution of random variables. The alternative hypothesis H1 is a bilateral test. For all k, j≤n, and k≠j, then the distribution of Xk and Xj are not the same. The test statistic S is calculated as follows:
Under the assumption that the data are independent and identically distributed, S is normal distribution. The mean is 0. The variance is . When n>10, the standard normal system variable is calculated by:
t is the range of any given node, and when n>10, Zc converges to a normal distribution and is calculated by:
In the bilateral trend test, at a given alpha significance level, if , rejecting the hypothesis H0, that is, at the significance level of α, the time series data have obvious upward or downward trend. is the standard normal distribution () quantiles, and α is the test's significance level. The degree of the trend can be expressed as Kendall inclination β, which is calculated as follows:
In the formula, 1<j<i<n. When β>0, it means the rising trend, otherwise it means the falling trend.
3.2 Hurst coefficient
Hurst found that the data did not follow the Brownian motion and the normal distribution through the Nile hydrological data, if there was a large amount of water a year, the amount of water in the following year would also tend to be larger. The Hurst coefficient was proposed in 1951. The Hurst coefficient can be used to characterize the persistence or long-term correlation of time series quantitatively.
The Hurst coefficient h means: h<0.5, the sequence is anti-persistent, and the trend of the future is opposite to the trend of the present; h=0.5, it indicates the sequence is random. And the future trend will not be affected by the present; h>0.5, it indicates that the sequence has a positive continuity, the trend of the future change is the same as the current trend; h is closer to 1, it shows that the sequence is more persistent. When h is the closer to 0, the stronger the anti-persistence of sequences.
When 0.5<h<0.719, the degree of variation is low; when 0.719<h<0.839 the degree of variation is middle; when 0.839<h<0.924, the degree of variation is high; when 0.924<h<1.0, the degree of variation is acute (Xie et al., 2008). The time series with long-term correlation in nature are ubiquitous. The Hurst coefficient has been widely used in hydrology, geochemistry, climate, geology and earthquake and other fields.
4.1 Mann–Kendall test analysis
The Mann–Kendall test was used to analyse the changes of the runoff and sediment of the seven hydrological stations, and the Zc of runoff at different time scale is shown in Table 1.
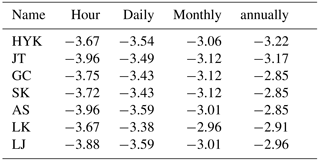
According to Table 1, Zc are far greater than the significance level (α=0.01), which absolute value is 2.56. We can conclude that the runoff of the seven hydrological stations are shown obviously downward trend at different time scale. We can also observe that the Zc is larger in smaller time scale from Table 1, which indicates that the runoff peak value reduced more obviously.
The Kendall inclination β of runoff at different time scale is shown in Fig. 1.
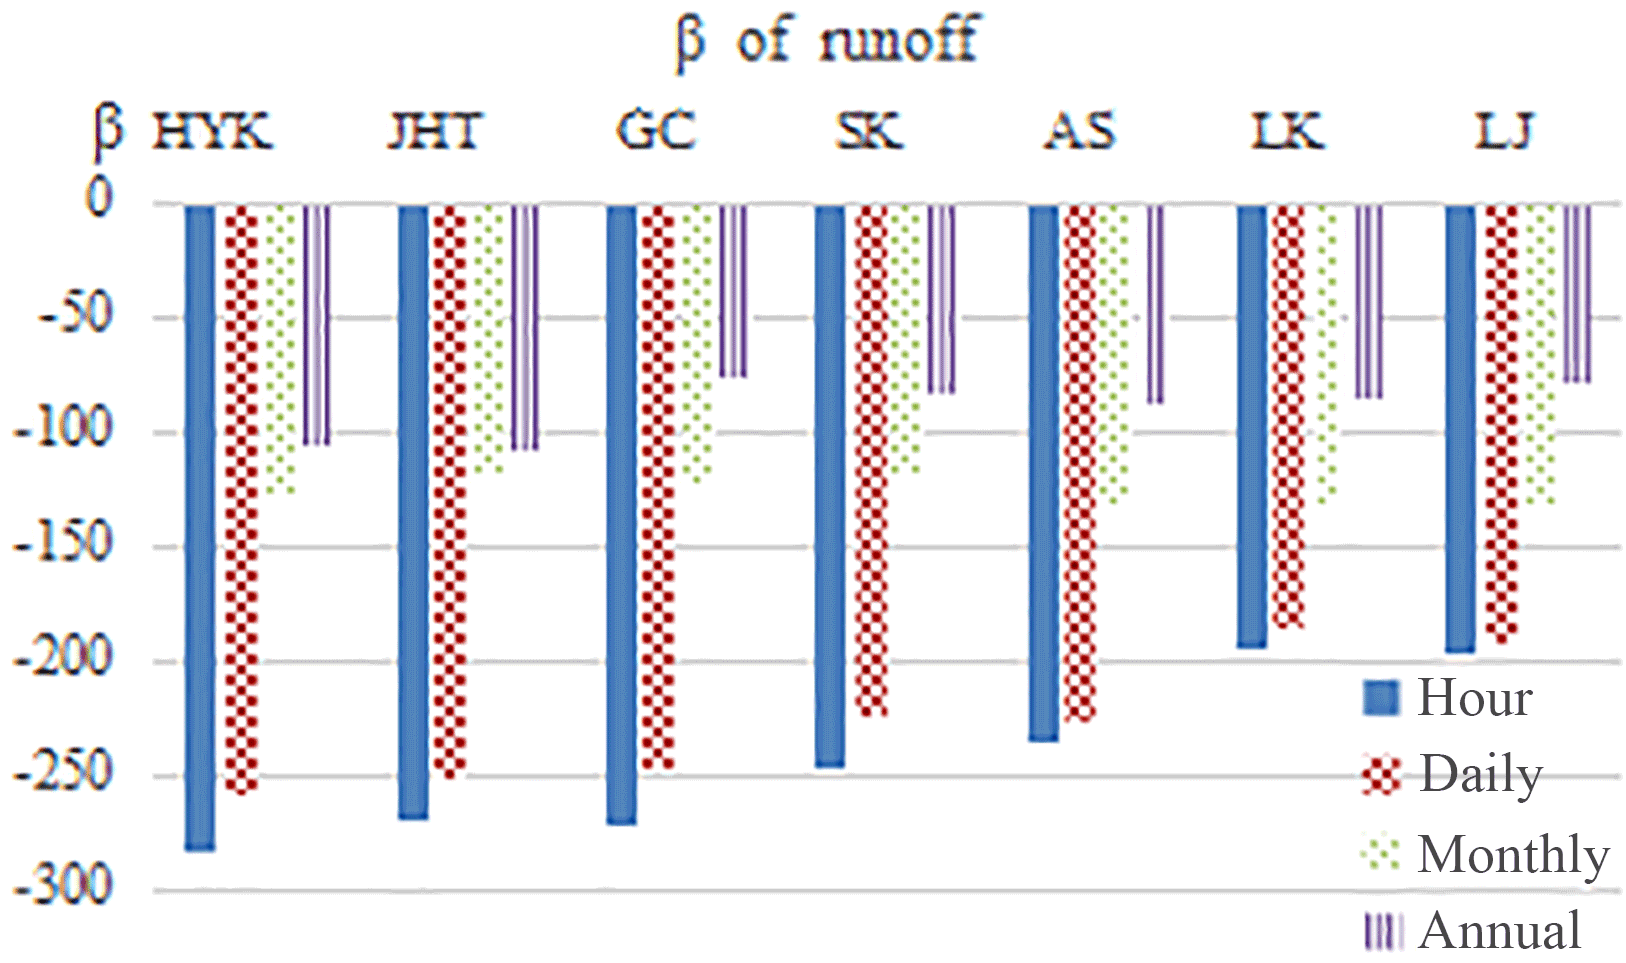
Figure 1β of runoff in different time scale (HYK: Huayuankou; JHT: Jiahetan; GC: Gaocun; SK: Sunkou; AS: Aishan; LK: Luokou; LJ: Lijin).
It can be observed that the trend of the runoff changes at seven stations in the LYR are relatively consistent. Based on the calculated β value, the β of the runoff are all negative which shows that the trends of runoff are all decreasing. Since the middle of 1980s, runoff has decreased significantly, the largest decrease occurred in 2000. These results are consistent with the former research (Yao et al., 2015). In different time scales, at the same horological station, the smaller the scale is, the more obvious changes are, β tends to zero. Among them, the change of HYK Station is the most obvious one, β is −285 in hour scale, however, β turns out to be −106 in annually scale. At the same time scale, decline trends are gradually reduced from upstream to downstream.
The Zc of sediment at different time scale is shown in Table 2.
According to the Zc result (Table 2), , Zc are far smaller than the significance level (α=0.01), which absolute value is 2.56. We can accept the original hypothesis H0 at α=0.01 significance level, there is no clear upward or downward trend in time series data.
The Kendall inclination β of sediment at different time scale is shown in Fig. 2.
It can be observed that although the trend has not reached a significant level, β is always greater than zero (Fig. 2) which means the amount of sediment in the LYR has slightly increased since the 1980s.
Figure 2β of sediment in different time scale (HYK: Huayuankou; JHT: Jiahetan; GC: Gaocun; SK: Sunkou; AS: Aishan; LK: Luokou; LJ: Lijin).
The Zc of upstream hydrological stations are close to the significance level, and the β of HYK and JHT are all greater than 0, which means their trends of sediment are slightly increased. However, the β value of downstream is more complicated, and it does not continue
the trend of upstream, and the β value decreases, even less than 0. This shows that in the flood season, a large amount of sediment are carried by the floodwater from upstream to downstream, resulting an upward trend of sediment in the upstream, However, due to the sedimentation effect, sediment has not been carried into the downstream by floods, which result in there is no trend of increase of sediment in the downstream.
According to the β of sediment in different time scales, we can find that most of the β values of sediment in the LYG over the past 20 years are greater than zero. Take HYK Station as an example, the value of β in each time scale is greater than zero. And the β value decreases in turn from the hour scale to the year scale. At the hour scale, the β of sediment in HYK station is 4.46, however, at the annually scale, the β becomes 1.16. Under different time scales, the scale becomes larger, the β gets smaller, closer to 0.
To sum up, it can be seen from the β value, whether it is in daily scale, monthly scale, or annually scale, the changes of sediment in the LYR in flood season all show the opposite trend of the change of runoff from 1980 to 2003. The trend of the runoff is decreased, the trend of sediment is slightly increased.The trends of different scales are similar. But the smaller the scale is, the more obvious the change will be. The changes of runoff and sediment are the response to the natural factors of climate change and human activities. Relevant studies show that in recent years, except the upstream regions where the trend of precipitation changed over time, in other regions, the annual precipitation series generally show a downward trend and the trend of downstream was more obvious (Xu and Zhang, 2006). In the past 20 years, the runoff into the LYR reduced, this trend is consistent with the trend of precipitation in the Yellow River Basin. But the sediment into the LYR has no obvious increased trend, there is no synchronized phenomenon between runoff sequence and sediment sequence change in the same station of the LYR.
The rapid change of runoff did not result to a response of the sediment. This is due to the factors that affect the change of sediment are multicomponent (Fan and Yang, 2010). The slope cropland in the Yellow River Basin is an important sediment source, rainfall erosion is the main driving force of sediment erosion, so heavy rains in the flood season can lead to the amount of sediment entering the Yellow River increased, while there is a large number of reservoirs built in the Yellow River Basin, which intercept a lot of sediment, has a great effect on reducing the amount of sediment (Xu and Zhang, 2006). Ultimately, the data show that, even the change of the flow rate is obvious increase, sediment deposition in the lower reaches did not show an obvious change.
4.2 Hurst coefficient analysis
Hurst Coefficient revealed the variation on dimension of time series, hence the H values demonstrated whether or not the data sets have changed over time. The Hurst value of runoff at different time scale is shown in Table 3.
Table 3Hurst value of runoff.
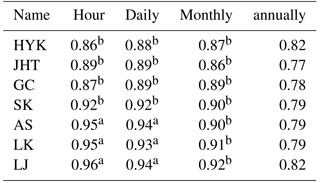
a acute degree, b high degree
HYK: Huayuankou; JHT: Jiahetan; GC: Gaocun; SK: Sunkou; AS: Aishan; LK:Luokou; LJ: Lijin
According to Hurst results of runoff, at the same hydrological station, the time scales get smaller, the Hurst value of the runoff get higher. Take LJ station as an example,at the hour, daily, monthly and annually scale, Hurst values are 0.96, 0.94, 0.92, and 0.82 respectively. At the same time scale, the Hurst value of downstream hydrological stations are higher than these of the upstream hydrological stations, which could prove that the persistence of upstream is higher than that of downstream.
The Hurst value of sediment at different time scale is shown in Table 4. According to the Hurst results of sediment (Table 4), it can be seen that Hurst results of 7 stations in different time scales are all very high ,all of them are greater than 0.8. The future trend of sediment in the LYR exists state persistence and has similar changing characteristics with past features.
Generally, both runoff and sediment series during the flood season correlated well in long term, and the trend of the future changes would be affected by the current regime. The future trend of runoff and sediment are positively related to the past situation, these results are consistent with the study of Yan et al. (2007) and Ma and Li (2008). Of all runoff variations, the moderate and strong alteration appeared in annually scale, monthly scale respectively. And all the sediment series altered sharply and existed significant jump variation.
Table 4Hurst value of sediment.
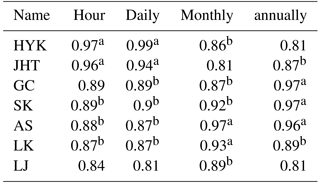
a acute degree, b high degree
HYK: Huayuankou; JHT: Jiahetan; GC: Gaocun; SK: Sunkou; AS: Aishan; LK: Luokou; LJ: Lijin
Based on the sediment and runoff data from 1980 to 2003, the characteristics of runoff and sediment sequence of 7 hydrological stations in the LYR were analysed in detail. Respectively, in the time scale of hour, daily, monthly and annually, using MK test method and Hurst coefficient method to analysis the degree of variation of runoff and sediment. We draw these conclusions as follows:
-
The runoff and sediment of the LYR during 20 years show the different trend, the runoff of seven hydrological stations was significantly reduced, However, the trends of sediment load in these stations were not obvious.
-
The time scale has big effect on the analysis results. In general, the runoff of the seven stations show more obvious trend in smaller time scale. According to the sediment load, the opposite results can be found in different time scale. According to the LK an LJ station, the annually and monthly sediment load were broadly flat, the maximum hourly sediment load showed decrease trend.
-
The changes of runoff and sediment show high persistence without additional measures, which proved the necessary of WSRS.
The data used is the data of China's Yellow River. According to national secret regulations, only for research use and not publicly available.
The authors declare that they have no conflict of interest.
This article is part of the special issue “Innovative water resources management – understanding and balancing interactions between humankind and nature”. It is a result of the 8th International Water Resources Management Conference of ICWRS, Beijing, China, 13–15 June 2018.
This research is supported by one research
programs: National Key Research and Development Program (during the 13th
Five-year Plan) under Grant No. 2016YFC0401309, Ministry of Science and
Technology, PRC.
Edited by: Dingzhi Peng
Reviewed by: two anonymous referees
Fan, H. and Yang, X. Y.: Interannual change characteristics of runoff and sediment load from the mainstream and major tributaries of the Yellow River, J. Sediment Res., 4, 11–15, 2010.
Guo, X. Q., Liu, M. C., Qian, L., and Zhou, W. X.: Evolution regularity of precipitation in the Shiyang River Basin on Mann-Kendall features, Arid Land Geography, 33, 593–599, 2010.
Kong, D. X., Miao, C. Y., Wu, J. G., Jiang, L., and Duan, Q. Y.: Bi-objective analysis of water–sediment regulation for channel scouring and delta maintenance: A study of the lower Yellow River, Global Planet. Change, 133, 27–34, 2015.
Li, W., Fu, X., Wu, W., and Wu, B.: Study on runoff and sediment process variation in the lower Yellow River, Journal of Hydroelectric Engineering, 33, 108–113, 2014.
Liu, G. W.: Geological Basis for the Management of the Lower Yellow River, Sci. China Earth Sci., 41, 1511–1523, 2011.
Ma, J. H. and Li, X. G.: Predictable time and trend analysis of the sediment time series at some control sections along the Yellow River, J. Sediment. Res., 1, 41–45, 2008.
Miao, C. Y., Ni, J. R., and Borthwick, A. G. L.: Recent changes of water discharge and sediment load in the Yellow River basin, China, Prog. Phys. Geogr., 34, 541–561, 2010.
Xia, D., Yu, Z., Xu, B., Gao, M., Mi, T., Jiang, X., and Yao, P.: Variations of Hydrodynamics and Submarine Groundwater Discharge in the Yellow River Estuary Under the Influence of the Water-Sediment Regulation Scheme, Estuar. Coast., 39, 333–343, 2016.
Xie, P., Lei, H. F., Chen, G. C., and Li, J.: A Spatial and Temporal Variation Analysis Method of Watershed Rainfall Based on Hurst Coefficient, Journal of China Hydrology, 28, 6–10, 2008.
Xu, Q. H., Yang, X. L., Zheng, Z. H., Wang, R. J., Ding, X. Y., and Liang, W. D.: Course Change and Course Realignment of the Yellow River, Geography and Geo-Information Science, 22, 77–80, 2004.
Xu, Z. X. and Zhang, N.: Long-term trend of precipitation in the Yellow River basin during the past 50 years, Geogr. Res., 25, 27–34, 2006.
Yan, A. L., Huang, Q., and Wang, Y. M.: Persistence Measure on Runoff Evolution of the Yellow River, Journal of Arid Land Resources and Environment, 21, 27–30, 2007.
Yang, D., Li, C., Hu, H., Lei, Z., Yang, S., Kusuda, T., Koike, T., and Musiake, K.: Analysis of water resources variability in the Yellow River of China during the last half century using historical data, Water Resour. Res., 40, W065021–W0650212, 2004.
Yao, W. Y., Gao, Y. J., An, C. H., and Jiao, P.: Analysis of trend of runoff and sediment load in upper and middle reaches of Yellow River at century scale, Advances in Science and Technology of Water Resources, 35, 112–120, 2015.
Yue, S., Pilon, P., and Cavadis, G.: Power of the Mann–Kendall and Spearman`s rho tests for detecting monotonic trends in hydrological series, J. Hydronaut., 259, 254–271, 2002.
Zhang, J. Y., Zhang, S. L., Wang, J. X., and Li, Y.: Study on runoff trends of the six larger basins in China over the past 50 years, Adv. Water Sci., 18, 230–234, 2007.
Zhang, Q., Xu, C. Y., Becker, S., and Jiang, T.: Sediment and runoff changes in the Yangtze River basin during past 50 years, J. Hydrol., 331, 511–523, 2006.