the Creative Commons Attribution 4.0 License.
the Creative Commons Attribution 4.0 License.
 | 05 Jun 2018
Stability and tilting of regional water cycle over Tarim Basin
Hongquan Zhang
Zhuguo Ma
The Tarim Basin is located upwind of the Gobi Desert where individual deserts have expanded significantly during the last 50 years. In recent history, stable runoff in the Tarim Basin has been observed despite the Lop Nur dry up and dramatic water consumption shift from east to west. This regional water cycle stability is conceptually explained based on the relationship between precipitation and evapotranspiration. The water consumption imbalance is caused by human activities near the river sources, which tilts the humidity profile over the basin. As a result, more water vapour spills from the western part of the basin and causes precipitation to increase in adjacent areas. At the same time, the Westerlies carry the low humidity air mass out of the eastern part of the basin to make the downwind Gobi Desert and surrounding areas drier. Therefore, the observed wetting on the west and drying on the east of northwest China are coupled.
- Article
(10383 KB) - Full-text XML
- BibTeX
- EndNote


During the last 50 years, deserts in northwest China have expanded significantly (Bai et al., 2002). Many residents had to relocate as a result of the ongoing desertification. Considerable precipitation decrease has been observed around the Gobi Desert area (Yang and Zhai, 2005; Guo et al., 2013). Running through the downwind area of the Gobi Desert, the Yellow River discharge rate has dropped more than 70 % (Ren et al., 2015). This regional environmental degradation has also negatively affected the surrounding provinces with frequent sand storms. These dramatic changes in such a short time are very unusual even considering the ongoing global warming process. Understanding the mechanism of this devastating process is crucial to finding solutions for the problem.
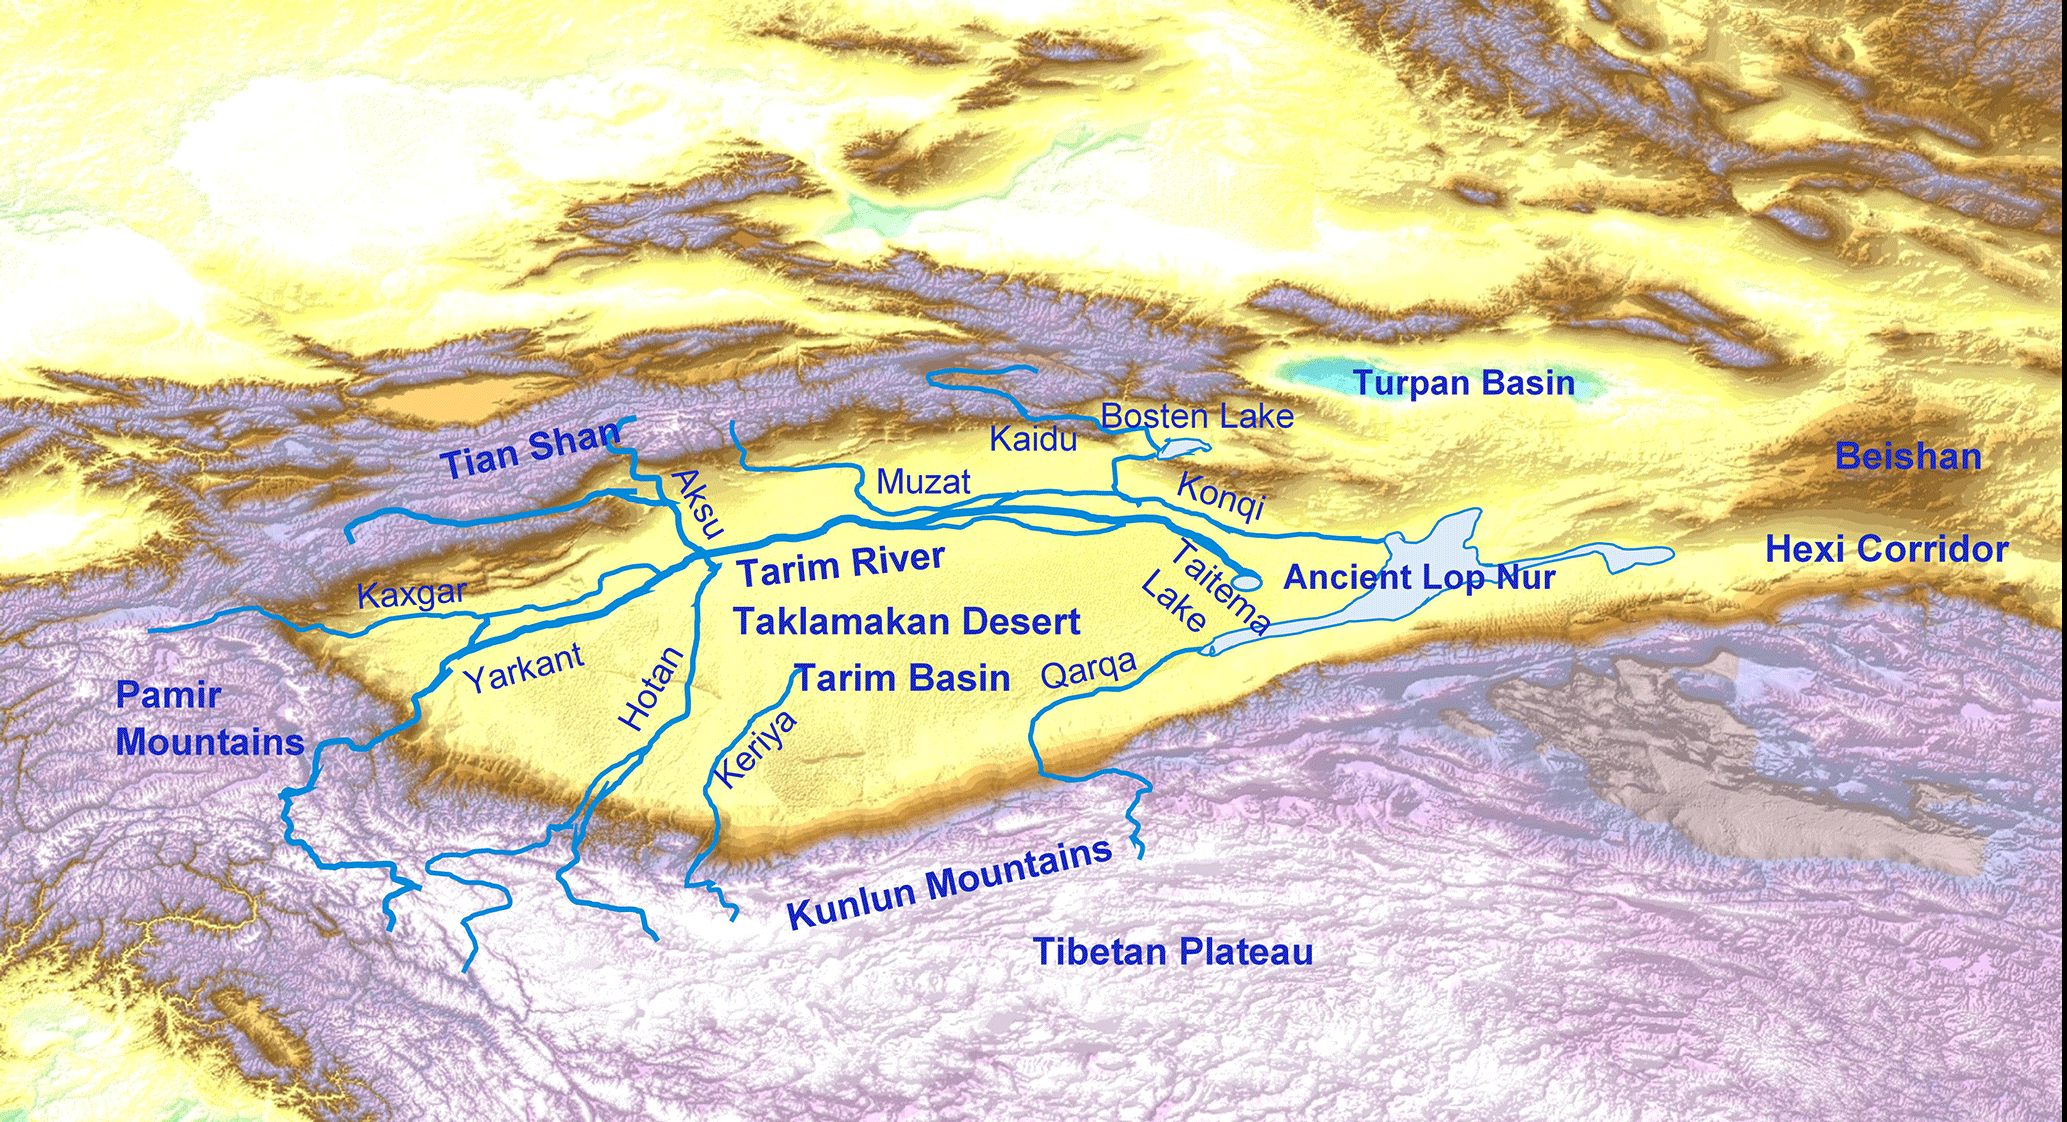
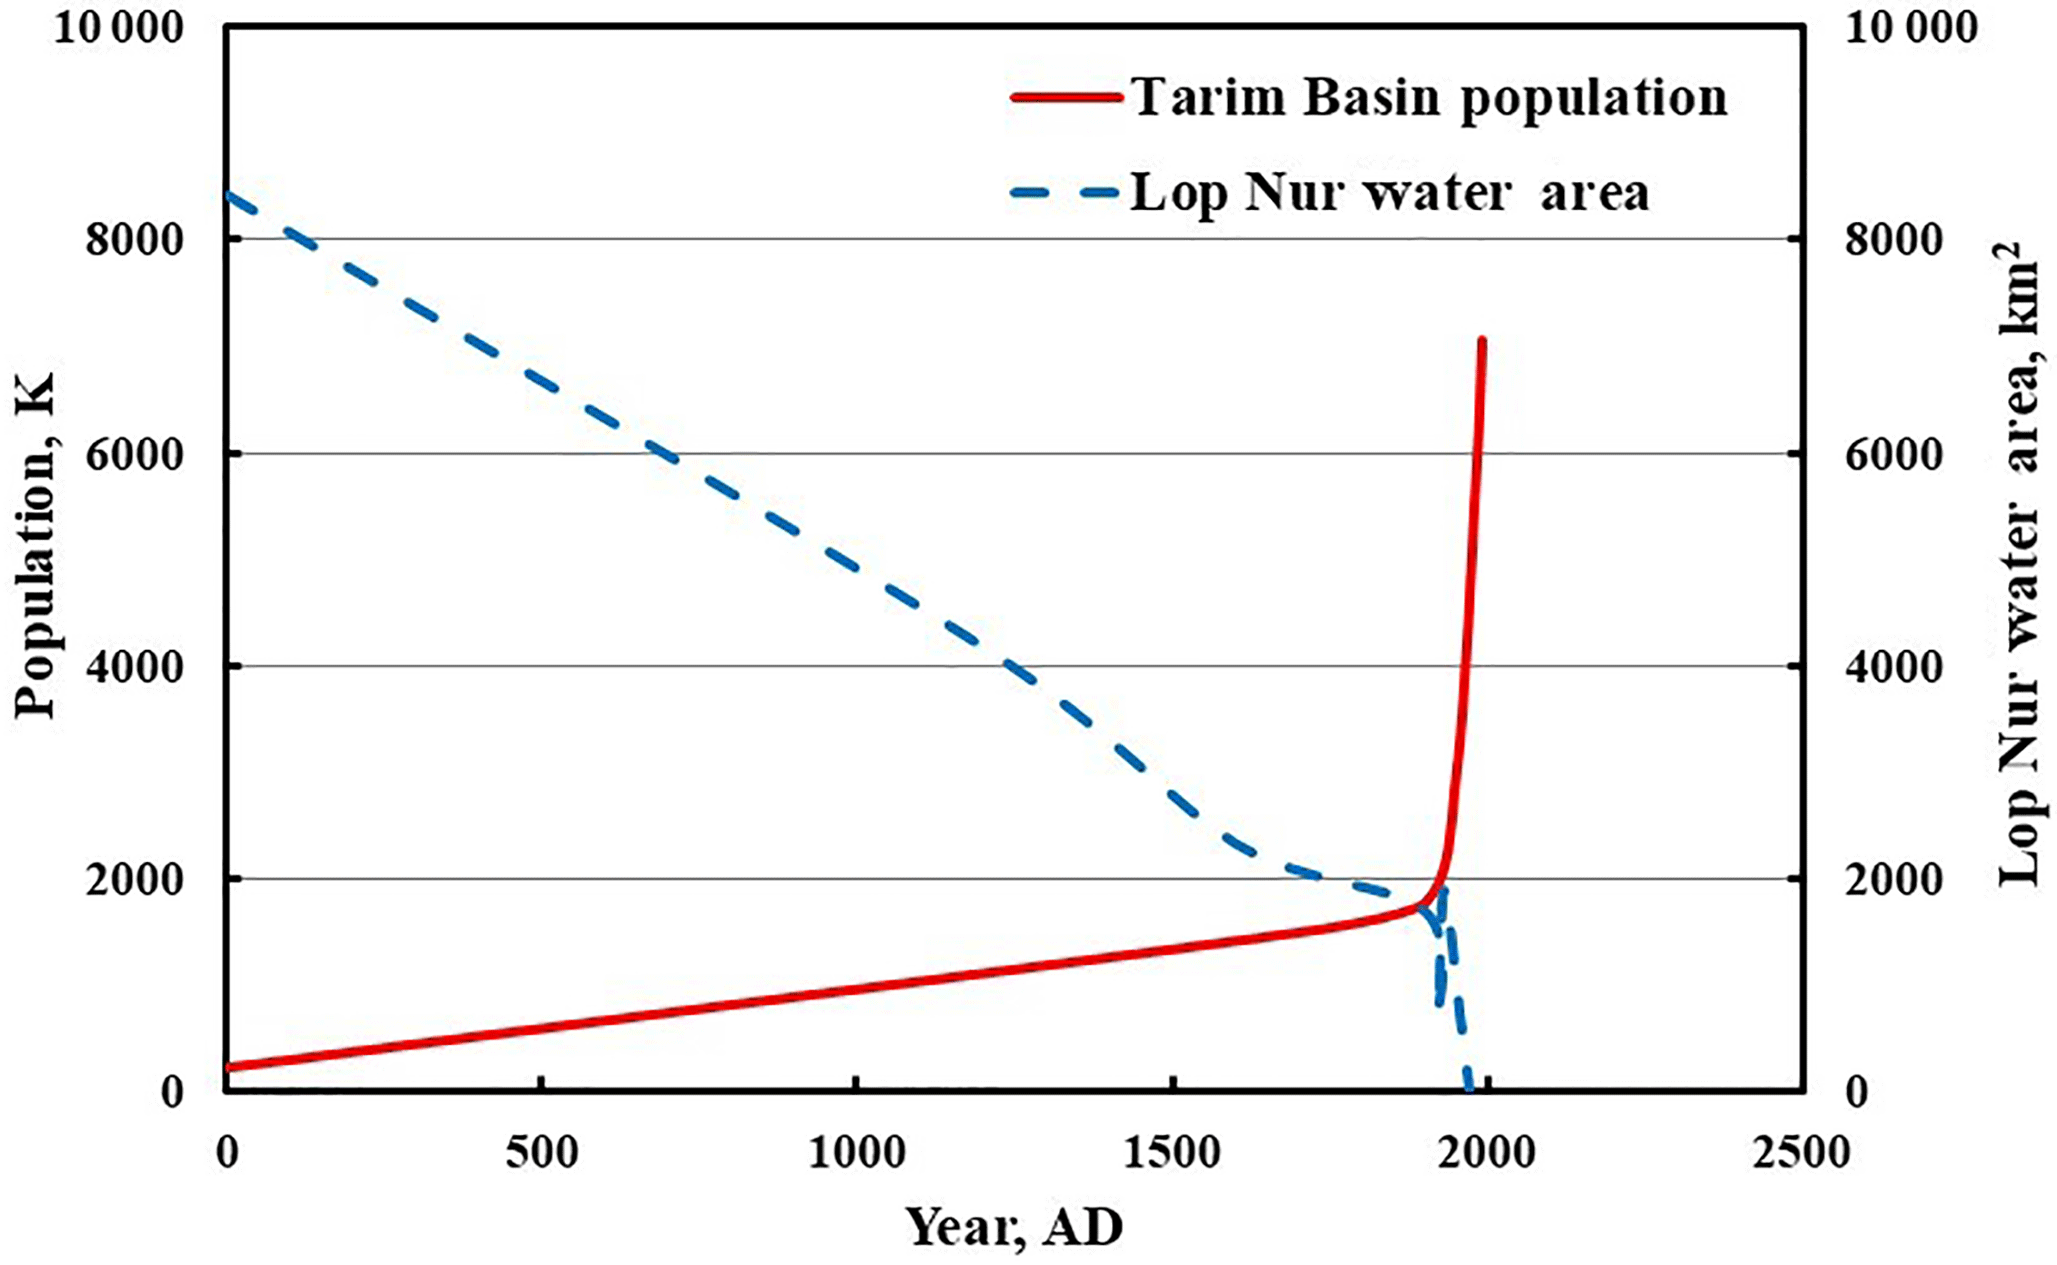
West of the Gobi area, the Tarim Basin (TB) is surrounded by high rise mountain ranges on its southern (Kunlun Mountains and Tibetan Plateau), western (Pamir Mountains) and northern (Tian Shan) sides (Fig. 1). On the eastern side are the much lower Beishan Mountain and the Hexi Corridor. Nine river basins and 114 tributaries in TB provide water for oases. Most tributaries connect to the Tarim River, the only mainstream in the basin flowing 1321 km from west to the Taitema Lake. Before AD 1960, the Tarim River and several other rivers flowed into the terminal lake Lop Nur, which is located at the east end of TB. About 2000 years ago, Lop Nur was described in the ancient Chinese history book “Han Shu” to be as “wide as 150 km, with still water and unnoticeable change through winter and summer”. The estimated water surface area was 8426 km2 (Yuan and Yuan, 1998). From then to 1950, Lop Nur gradually shrank to about 2000 km2 with a basin population increase from 0.23 to 3.03 million. In 1962, it suddenly dried up due to upstream water withdrawals for agricultural irrigation with more than 200 newly constructed reservoirs (Fan et al., 2009).
After 1970, average precipitation has increased about 30 % in the Tian Shan Mountain region and 8 % in the adjacent areas on the Tibetan Plateau (Zhang et al., 2012; Huang et al., 2015). Many believed a “warm-dry” to “warm-wet” climate transition was happening (Shi et al., 2003; Li et al., 2003; Huang et al., 2011; Yao et al., 2013). There were even speculations that this wetting trend would consequentially extend to the eastern areas. Researchers have tried to relate the precipitation increase to large-scale atmospheric circulation and climate changes (Tao et al., 2016; Zuo et al., 2004). However, global warming is believed to result in dry areas becoming drier and wet areas becoming wetter (Trenberth, 2011). Studies show that the precipitation increase has not changed the area around west TB from dry to wet category (Ma et al., 2005; Ma and Fu, 2006). Therefore, the precipitation increase was not due to the area being wetter than normal. It is worth noting that the afore mentioned drying process around the Gobi Desert in the downwind area east of TB has been taking place simultaneously with this wetting trend around the west TB (Song and Zhang, 2003; Yang, 2014). To date, no study has made a connection between these two opposing changes.
Evidently, the shrinkage of the Lop Nur water surface area was due to the population growth in TB over the last 2000 years (as shown in Fig. 2). Since the Lop Nur dry up, water entering the Tarim River has dropped to less than 10 % of the total annual runoff in the basin which is about 39.8 billion m3 year−1 (Fan et al., 2009). Although the main water consumption has shifted to the western half of the basin, the overall runoff from the river sources in TB has not changed (Yang and He, 2003). Many studies have found that the water retreat from the east side was mainly caused by human activities rather than climate change (Chen and Xu, 2004; Hao et al., 2008).
On the opposite side of the globe, the Great Salt Lake in the Great Basin of western USA has shrunk about 50 % since 1847. A recent study reveals that the shrinkage of Great Salt Lake is solely due to consumptive water use by humans (Wurtsbaugh et al., 2016). Despite this shrinkage, the river flow rate ahead of diversions has been very stable over the past 150 years. The study demonstrates that the long-term trend in the lake level would have been flat if water had not been diverted for agriculture, industrial, urban and impounded wetland uses. Thus, water cycle stability appears to be a universal phenomenon occurring in all endorheic basins.
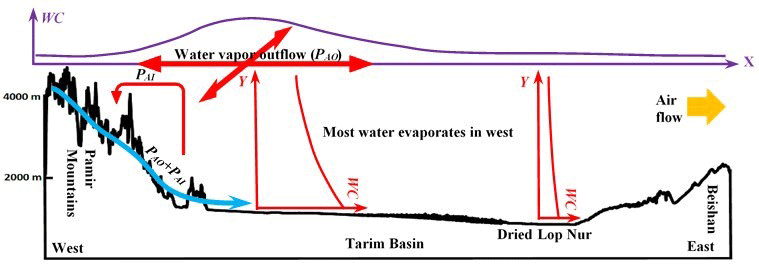
The water cycle stability in TB is governed by the relationship between precipitation and evapotranspiration. Most of the runoff originates from orographic precipitation spillover in the surrounding mountain ranges when atmospheric circulation passes over the TB area. However, most of the evapotranspiration occurs inside the basin during the course of surface water flow. Due to the distance and low humidity, the variation of evapotranspiration does not have a significant impact on precipitation. Assuming all the precipitation is taken away from the basin without any evapotranspiration, the surrounding mountain ranges would still provide a similar (but slightly lower) amount of precipitation (PAO). Surface water evapotranspiration is a water vapour mass transfer process which determines the water concentration (WC) or humidity distribution across the atmospheric boundary layer (Katsaros, 2003). As shown in Fig. 3a, the WC profile from the basin surface to its top would be almost constant if there were no water vapour transfer from ground to atmosphere. At the same time, the average WC profile on the top of the basin would also remain flat because there is no net water vapour outflow from the basin top to the surrounding atmosphere (Bergman et al., 2011).

Figure 3Precipitation in mountain ranges around Tarim Basin and evapotranspiration inside the basin. (a) Assuming all precipitation is taken away without evapotranspiration, humidity in the basin would be low and uniform. (b) In reality, all runoff must be returned to atmosphere as water vapour, and the humidity at the top of the basin is higher than that of the surrounding atmosphere.
In TB, all the precipitation must be returned to the atmosphere through evapotranspiration so that there is no continuous water accumulation in the basin. Assuming evenly distributed evapotranspiration across the basin, WC will be higher on the surface and decrease with the height corresponding to the water vapour mass transfer from surface to the basin top (as shown by the middle red chart in Fig. 3b). On the basin top WC will be higher than that of the surrounding atmosphere in order to facilitate the water vapour outflow from the basin (as shown by the top purple chart in Fig. 3b). There will be a small precipitation increase (PAI) due to the evapotranspiration inside the basin, compared to the assumed no-evaporation case. Therefore, at equilibrium the total average precipitation (PA) and evapotranspiration (EA) in the basin will be the same and equal to . The water vapour outflow from the basin remains the same (PAO).
The relationship between PA and EA in the Tarim Basin is non-linear. If EA is changed from low to high by output (when EA<EAE) and input (when EA>EAE) of surface water, PA must follow the blue curve shown in Fig. 4. The green dot corresponds to the case displayed in Fig. 3a, assuming all precipitation is removed from the basin without any evapotranspiration. The blue dot corresponds to the case displayed in Fig. 3b, when all precipitation evaporates without any water input or output on the basin surface.
External weather systems may temporarily bring large amounts of water into the basin. When the surface evaporable water in the basin is above the equilibrium level, evapotranspiration will be higher due to the increased water evaporation surface. Precipitation will also be higher but its increase is much less than that of evapotranspiration. As a result, EA>PA, and the surface water amount in the system will decrease. Then, evapotranspiration will fall back to its equilibrium value (EAE). If surface water in the basin falls below the equilibrium level due to drought, evapotranspiration will be lower due to the reduced water evaporation surface. Precipitation will also be lower but its decrease is much less than that of evapotranspiration. As a result, PA>EA, and the surface water amount in the basin will increase. Then, evapotranspiration will increase to EAE. This water cycle stabilization mechanism must exist in all endorheic basins.
The water distribution shift in TB is a result of increased water consumption due to population expansion and other developments. When more water is consumed near the water heads by convenience, less water is left for downstream areas. After the Lop Nur dried up, the Tarim River flowed into the Taitema Lake about 200 km west. In 1974, the Taitema Lake also dried up. Since then, the dried-up length of the Tarim River increased continuously and reached 1200 km of the total river length of 1321 km in 2009 (Chen et al., 2009). The majority of the water runoff in TB was consumed in the northwest part of the basin where more oases and population were located (Fan et al., 2001). As a result, the local air humidity became much higher. Since the 1970's, the west TB and surrounding areas have seen precipitation increases (Hu et al., 2002; Shi et al., 2002). At the same time the dry area around Lop Nur in the east part of the basin has expanded significantly. The relative humidity in the Lop Nur area is only about 10 % compared to the basin's average relative humidity about 50 % (Luo et al., 2005; Li et al., 2012). The annual precipitation is about 20 mm compared to 90 mm in the west part of the basin (Shang et al., 2016). The Lop Nur became the driest area in China.

Figure 4Non-linear relationship between precipitation (PA) and evapotranspiration (EA), and basin water cycle stabilization.
As illustrated in Fig. 5, corresponding to the current water consumption imbalance in TB, the water concentration (WC) profiles from basin surface to top are very different in the west and east. In the west, where most runoff evaporates, WC is much higher on the surface and it decreases with height corresponding to the water vapour mass transfer from ground to atmosphere. At the top of the basin west, WC is much higher than that corresponding to an even water distribution shown in Fig. 3b, to drive a greater mass transfer of water vapour from the basin to outside. On the basin east around the dried Lop Nur, there is almost no water evaporation. The WC profile from basin surface to top is low and flat. The humidity on top of the basin east is close to that of the surrounding atmosphere, and the water vapour outflow is small. A recent analysis shows that from 1979 to 2012, there was a large decline of moisture transport out of the basin across the eastern boundary (Ren et al., 2016), which agrees with the effect of humidity tilting after the dry-up of Lop Nur.
As shown in Fig. 6a, TB is surrounded by high rise mountain ranges on its south, west and north sides. Studies show a stable divergence area in west TB which helps diffuse the water vapour outward (Wu et al., 2016; Wang et al., 2006). The water vapour outflow from the basin west increases the precipitation in adjacent areas. Part of the increased precipitation falls in the Aksu River basin and flows back into TB through the Aksu River, increasing its runoff (Chen and Dai, 2009). The local northward wind direction and surface water concentration on the northwest side of TB explain why the precipitation increase is greater in the Tian Shan Mountains than on the Tibetan Plateau.
The shape of TB is like a dustpan with the opening facing the east. The Gobi Desert (encircled by the dashed red line in Fig. 6a) extends from TB to the east with a vague and ever changing boundary. The low humidity air mass from the Lop Nur area is carried out by the west wind to the Gobi Desert areas and makes the environment even drier. Rapid desert expansions occurred in this region following the desiccation of the Lop Nur. The Baidan Jaran desert (the largest on the Gobi Desert) expanded about 80 % from 1970's to 1990's (Bai et al., 2002). The second and third largest deserts in the area, the Tengger desert and Ulan Buh desert, expanded about 16 and 38 % respectively during the same time. These three previously separate deserts connected recently (Liu et al., 2011). Many naturally formed lakes on the Gobi Desert and surrounding areas disappeared or shrank, but lakes on the Tibetan Plateau expanded (Zhang et al., 2013, 2017). The significant air humidity decrease in the upwind Lop Nur area must be responsible for these rapid transitions.
Figure 6b shows the five-year average annual precipitation distribution around TB from January 1955 to December 1959, right before Lop Nur dried up. Figure 5c shows the five-year average annual precipitation distribution in the same area from January 2000 to December 2004, about 40 years after Lop Nur dried up. Clearly, there was a considerable shrinkage of the low precipitation area over TB, but the dry area on the Gobi Desert east of TB expanded significantly at the same time. The large-scale atmospheric circulation cannot provide explanations for the antiphase trends simultaneously occurring in two neighbouring areas, although individual draught and wetness extremes may be correlated to the long distance upstream anomalies (Tao et al., 2014; Borth et al., 2016). These two antiphase changes are obviously coupled. We believe that the root cause is local rather than remote, namely the humidity tilting over TB as a result of the dramatic water consumption shift to west TB is responsible for these opposite changes.
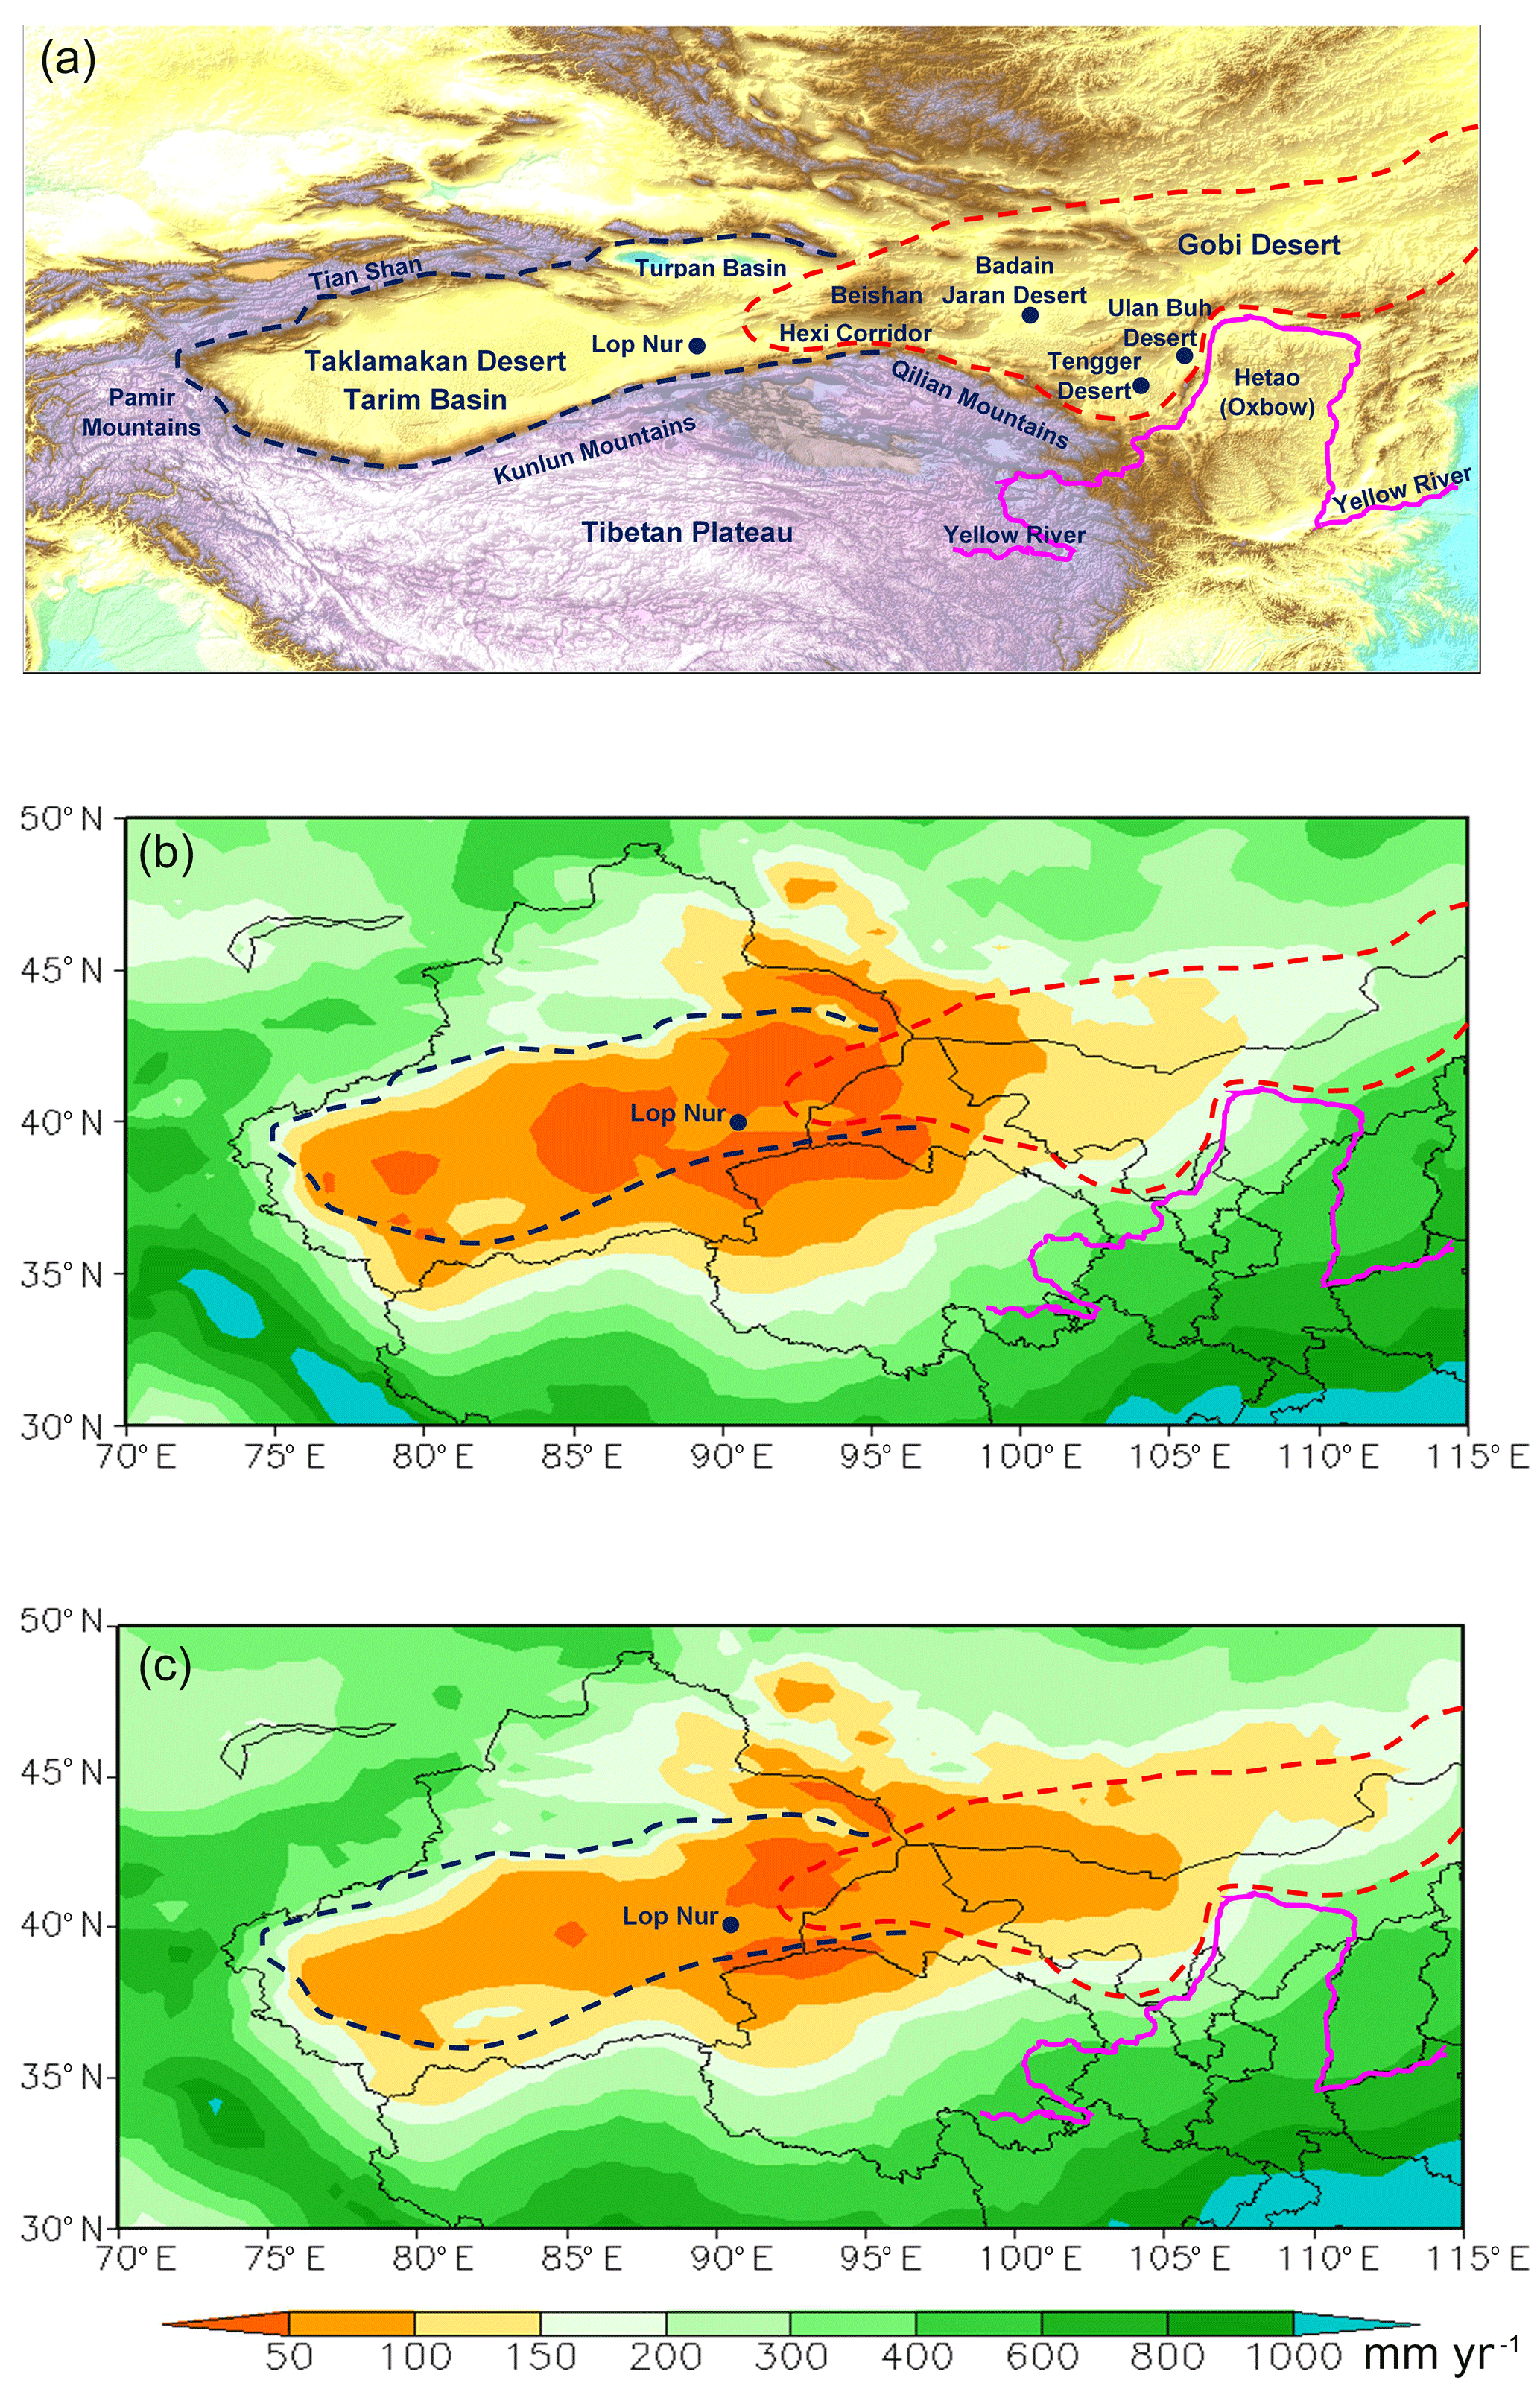
Figure 6Change of precipitation distribution around TB with water consumption shift to west (precipitation data from Climate Research Unit (Harris et al., 2014) (a) Gobi Desert is downwind of Lop Nur. (b) Annual precipitation distribution around TB averaged over January 1955 to December 1959. (c) Annual precipitation distribution around TB averaged over January 2000 to December 2004.
Shown in Fig. 6, the Yellow River Hetao (Oxbow) area serves as the front line of defence against desertification. However, precipitation in this area and adjacent regions dropped about 15 % from 1960 to 2010 (Wang et al., 2015; Zhong et al., 2006; Chen et al., 2008). A significant amount of water was drained from the Yellow River to meet the water deficit for irrigation and other consumptions. During the same time, the Yellow River discharge rate decreased about 47.5 % at the top of the Hetao area, and decreased about 68.9 % after passing the Hetao area (Li et al., 2014; Piao et al., 2010; Ma, 2005). This must have contributed to the Yellow River dry up in its downstream section which started in 1972. Therefore, the significant flow rate decrease and frequent dry-ups of the Yellow River are correlated to the dry-ups of Lop Nur and Tarim River in TB.
The regional water cycle in TB is stable because precipitation mostly originates from the high altitude surrounding mountain ranges. The evapotranspiration inside the basin has an insignificant effect on precipitation. Any water fluctuation in the basin will be drawn back to the balance point. This means that the available water in TB for consumption (evapotranspiration) is almost constant.
With the water consumption shift to the west of TB, the humidity profile over the basin has become significantly tilted. The area around TB on the west has become wetter while the Gobi Desert and its surrounding areas have become drier. These antiphase trends are coupled with the humidity tilting over TB. The precipitation increase around west TB is a moisture holdup which deprives humidity from the air flowing into the eastern Gobi Desert causing rapid expansion of this arid area. Therefore, the solution to the environmental degradation in northwest China is directly related to the water cycle in TB where water distribution must to be rebalanced.
No data sets were used in this article.
The authors declare that they have no conflict of interest.
This article is part of the special issue “Innovative water resources management – understanding and balancing interactions between humankind and nature”. It is a result of the 8th International Water Resources Management Conference of ICWRS, Beijing, China, 13–15 June 2018.
We thank Liang Chen, Ziyan Zheng and Qing Yang for
generating some of the figures.
Edited by:
Andreas Schumann
Reviewed by: two anonymous referees
Bai, M., Shen, J., Pei, H., and Hao, R.: Assessment of climate change impact on desertification, Climatic and Environmental Research, 7, 457–464, 2002.
Bergman, T. L., Lavine, A. S., Incropera, F. P., and Dewitt, D. P.: Fundamentals of heat and mass transfer, USA, John Wiley & Sons, 2011.
Borth, H., Tao, H., Fraedrich, K., Schneidereit, A., and Zhu, X.: Hydrological extrems in the Aksu-Tarim River Basin: Mid-latitude dynamics, Clim. Dynam., 46, 2039–2050, 2016.
Chen, D. and Dai, Y.: Characteristics of northwest China rainfall intensity in recent 50 years, Chinese Journal of Atmospheric Sciences, 33, 923–935, 2009.
Chen, Y. and Xu, Z.: Possible effect of climate change on water resources in Tarim Basin, Science China D, 34, 1047–1053, 2004.
Chen, Y., Chen, N., Zheng, G., Mu, J., Ma, S., Na, L., and Shao, J.: Change of temperature, precipitation and NDVI in recent 45 years in Ningxia, Journal of Natural Resources, 23, 626–634, 2008.
Chen, Y., Ye, Z., Mao, X., Zhang, X., and Luo, J.: Dried-up trend of Tarim River and the countermeasures for mitigation, Arid land Geography, 32, 813–820, 2009.
Fan, Z., Ma, Y., Ji, F., and Wang, R.: Relations between exploitation-utilization of water resources and oasis evolution and ecological balance in Tarim Basin, Journal of Natural Resources, 16, 22–27, 2001.
Fan, Z., Kurban, A., Xu, H., Zhang, Q., and Abdumijiti: Changes of Tarim River and Evolution of Lop Nur, Quaternary Sci., 29, 233–240, 2009.
Guo, H., Li, D., Lin, S., Dong, Y., Sun, L., Huang, L., and Lin, J. : Temperal and spatial variation of precipitation over western China during 1954–2006, Journal of Glaciology and Geocryology, 35, 1165–1175, 2013.
Hao, X., Li, W., Chen, Y., and Li, C.: Indentification of human activity and climate change effects on Tarim River discharge, Prog. Nat. Sci., 18, 1409–1416, 2008.
Harris, I., Jones, P., Osborn, T., and Lister, D.: Updated high-resolution grids of monthly climatic observations – the CRU TS3.10 Dataset, Int. J. Climatol., 34, 623–642, 2014.
Hu, R., Jiang, F., Wang, Y., and Fan, Z.: A study on signals and effects of climatic pattern change from warm-dry to warm-wet in Xinjiang, Arid Land Geography, 25, 194–200, 2002.
Huang, X., Zhang, M., Jia, W. W. S., and Zhang, N.: Variations of surface humidity and its influential factors in Northwest China, Adv. Water Sci., 22, 151–159, 2011.
Huang, X., Li, Y., Feng, J., Wang, J., Wang, Z., Wang, S., and Zhang, Y.: Climate characteristics of precipitation and extreme drought events in Northwest China, Acta Ecologica Sinica, 35, 1359–1370, 2015.
Katsaros, K.: Encyclopedia of Atmospheric Sciences, USA, Elsevier, 2003.
Li, D., Wei, L., Cai, Y., Zhang, C., Feng, J., Yang, Q., Yuan, Y., and Dong, A.: The present facts and the future tendency of the climate change in Northwest China, Journal of Claciology and Geocryology, 25, 135–142, 2003.
Li, E., Mu, X., and Zhao, G.: Temporal changes in annual runoff and influential factors in the upper and middle reaches of Yellow River from 1919 to 2010, Advances in Water Science, 25, 155–163, 2014.
Li, H., Mao, W., Zhao, Y., Wang, M., and Huo, W.: Trends and abrupt changes in surface vapor content over Tarim Basin during the last 50 years, J. Arid Land, 4, 260–270, 2012.
Liu, Y., Wang, X., Zhang, X., and Zhang, B.: Desertification process and its driving forces in the dune-activation region between Badain Jaran and Tegger deserts, Arid Zone Research, 28, 957–966, 2011.
Luo, C., Peng, Z., Liu, W., and Liu, G.: Research on the environmental evolution of Lop Nur in Xinjiang, China, Sciencepaper Online, 2005.
Ma, Z.: Historical regular patterns of the discharge in the Yellow River and the cause of their formation, Chinese J. Geophys.-Ch., 48, 1270–1275, 2005.
Ma, Z. and Fu, C.: Some evidence of drying trend over north China from 1951 to 2004, Chinese Sci. Bull., 51, 2931–2925, 2006.
Ma, Z., Huang, G., Gan, W., and Chen, M.: Multi-scale temporal characteristics of the dryness/wetness over north China during the last century, Chinese Journal of Atmospheric Sciences, 29, 671–681, 2005.
Piao, S., Ciais, P., Huang, Y., Shen, Z., Peng, S., Li, J., Zhou, L., Liu, H., Ma, Y., Ding, Y., Friedlingstein, P., Liu, C., Tan, K., Yu, Y., Zhang, T., and Fang, J.: The impacts of climate change on water resources and agriculture in China, Nature, 467, 43–51, 2010.
Ren, G., Yuan, Y., Liu, Y., Ren, Y., Wang, T., and Ren, X.: Changes in precipitation over northwest China, Arid Zone Research, 33, 1–19, 2016.
Ren, H., Li, G., Cui, L., and He, L.: Multi-scale variability of water discharge and sediment load into the Bohai Sea from 1950 to 2011, J. Geogr. Sci., 25, 85–100, 2015.
Shang, H., Tuohuti, M., Zhang, R., Zhang, T., Zhang, K., Wei, W., Fan, Z., and Chen F.: Annual precipitation reconstruction and analysis in the western edge of Tarim Basin during AD1715-2014, Desert and Oasis Meteorology, 10, 9–17, 2016.
Shi, Y., Shen, Y., and Hu, R.: Preliminary study on signal impact and foreground of climatic shift from warm-dry to warm-humid in Northwest China, Journal of Glaciology and Geocryology, 24, 219–226, 2002.
Shi, Y., Shen, Y., Li, D., Zhang, G., Ding, Y., Hu, R., and Kang, E.: Discussion on the present climate change from warm-dry to warm-wet in northwest China, Quaternary Sci., 23, 152–164, 2003.
Song, L. and Zhang, C.: Changing features of precipitation over northwest China during the 20th century, Journal of Glaciology and Geocryology, 25, 143–148, 2003.
Tao, H., Borth, H., Fraedrich, K., Su, B., and Zhu, X.: Drought and wetness variability in the Tarim River Basin and connection to large-scale atmospheric circulation, Int. J. Climatol., 34, 2678–2684, 2014.
Tao, H., Borth, H., Fraedrich, K., Schnerdereit, A., and Zhu, X.: Hydrological extremes in the Aksu-Tarim River Basin: Climatology and regime shift, Clim. Dynam., 46, 2029–2037, 2016.
Trenberth, K. E.: Changes in precipitation with climate change, Clim. Res., 47, 123–138, 2011.
Wang, K., Jiang, H., and Zhang, H.: Advection and convergence of water vapor transport over the northwest China, Advances in Water Science, 17, 164–169, 2006.
Wang, Y., Xiao, T., Na, L., and Zhu, X.: Variation characteristics of precipitation in Ningxia and its response to heating field over Tibet Plateau, Journal of Arid Meteorology, 33, 574–580, 2015.
Wu, Y., Feng, G., and Li, B.: Interactions of multiple atmospheric circulation drive the drought in Tarim River Basin, Sci. Rep.-UK, 6, 1–7, 2016.
Wurtsbaugh, W., Miller, C., Null, S., Wilcock, P., Hahnenberger, M., and Howe, F.: Impacts of water development on Great Salt Lake and the Wasatch front, s.l.: Watershed Science Faculty Publications, 2016.
Yang, Q. and He, Q.: Interrelationship of climate change, runoff and human activities in Tarim River Basin, Journal of Applied Meteorological Science, 14, 309–321, 2003.
Yang, X. and Zhai, P.: Changes in precipitation intensity frequency and total in Northwest China, Science and Technology Review, 23, 24–26, 2005.
Yang, Y.: Characteristics of precipitation anomalies in the last 50 years in eastern part of Northwest China, Journal of Arid Meteorology, 32, 701–711, 2014.
Yao, J., Yang, Q., Chen, Y., Hu, W., Liu, Z., and Zhao, L.: Climate change in arid areas of northwest China in past 50 years and its effects on the local ecological environment, Chinese Journal of Ecology, 32, 1283–1291, 2013.
Yuan, G. and Yuan, L.: An approach to the environmental changes in Lop Nur history, Acta Geographica Sinica, 53, 83–89, 1998.
Zhang, G., Yao, T., Piao, S., Bolch, T., Xie, H., Chen, D., Gao, Y., O'Reilley, C.M., Shum, C.K., Yang, K., Yi, S., Lei, Y., Wang, W., He, Y., Shang, K., Yang, X., and Zhang, H.: Extensive and drastically different alpine lake changes on Asia's high plateaus during the past four decades, Geophys. Res. Lett., 44, 252–260, 2017.
Zhang, Z., Liu, L., and Tang, X.: The regional difference and abrupt events of climatic change in Tianshan mountains during 1960–2010, Progress in Geography, 31, 1475–1484, 2012.
Zhang, Z., Wang, N., Wu, Y., Shen, S., Zhang, X., and Chang, J.: Remote sensing on spatial changes of lake area in Badain Jaran desert hinterland during 1979–2010, Journal of Lake Science, 25, 514–520, 2013.
Zhong, H., Li, D., and Chen, X.: Study on variation trend of the precipitation in the oxbow area in recent 40 years, Plateau Meteorology, October, 25, 900–905, 2006.
Zuo, H., Lv, S., and Hu, Y.: Variations trend of yearly mean air temperature and precipitation in China in the last 50 years, Plateau Meteorology, 23, 238–244, 2004.