the Creative Commons Attribution 4.0 License.
the Creative Commons Attribution 4.0 License.
Multi-scale fluctuation analysis of precipitation in Beijing by Extreme-point Symmetric Mode Decomposition
Zhipeng Duan
Jing Huang
With the aggravation of the global climate change, the shortage of water resources in China is becoming more and more serious. Using reasonable methods to study changes in precipitation is very important for planning and management of water resources. Based on the time series of precipitation in Beijing from 1951 to 2015, the multi-scale features of precipitation are analyzed by the Extreme-point Symmetric Mode Decomposition (ESMD) method to forecast the precipitation shift. The results show that the precipitation series have periodic changes of 2.6, 4.3, 14 and 21.7 years, and the variance contribution rate of each modal component shows that the inter-annual variation dominates the precipitation in Beijing. It is predicted that precipitation in Beijing will continue to decrease in the near future.
- Article
(1544 KB) - Full-text XML
- BibTeX
- EndNote
Beijing is one of the cities with the most serious water shortage in China. In the context of global warming, the annual precipitation is significantly reduced, which aggravates the water shortage crisis in Beijing. Therefore, studying the changing law of precipitation and the trend of its future development in Beijing has become a central issue of widespread concern. At present, many scholars have done a lot of researches on the variation and evolution of precipitation in Beijing. Zhu et al. (2012) used Empirical Mode Decomposition method to analyze the multi-scale oscillations of the precipitation time series from 1951 to 2009 in Beijing, the results show that the annual precipitation in Beijing will decrease continuously in the short term (Zhu et al., 2012). Through statistical calculations and frequency analysis of precipitation data from 16 rainfall stations in Beijing, Sun et al. (2007) explored the spatial and temporal distribution characteristics of precipitation in Beijing and its changing trend. It is found that continuous drought in Beijing after the 1990s and annual precipitation after 2008 may enter a relatively abundant period (Sun et al., 2007). Wang et al. (2009) analyzed the changes of temperature and precipitation over the past 48 years in Beijing and found that the annual precipitation showed a decreasing trend in both suburban and urban areas. The above research results have analyzed the cycle and variation characteristics of temperature and precipitation in Beijing from different perspectives, which is not only helpful for understanding the process and laws of climate change, but also great significance for the social and economic development of Beijing.
The climate system is a nonlinear, non-stationary, and hierarchical system (Xue et al., 2013). In the traditional trend analysis, large-scale cycles and trend changes are likely to mix together, can not tell the trend of changes or periodic oscillations. Extreme-point Symmetric Mode Decomposition (ESMD) is a locally adaptive time series analysis technique developed in recent years. Compared with the wavelet analysis method, it is free from the constraints of Fourier transform and is very suitable for analyzing non-stationary and nonlinear time series (Xia and Liu, 2017). This paper uses ESMD method to conduct multi-scale analysis of the annual precipitation series from 1951 to 2015 in Beijing, and compares the results with wavelet analysis to provide reference for future precipitation forecast and water resources planning and management in Beijing.
2.1 The basic principle of Empirical Mode Decomposition
The Empirical Mode Decomposition (EMD) method proposed by Huang et al. (1998), which is very suitable for dealing with nonlinear and non-stationary signals. The EMD method separates the fluctuations of different periods from the original signal and finally obtains the trend component. Fluctuations at different scales are defined as Intrinsic Mode Function (IMF). The modal decomposition of the EMD method is as follows:
-
Find all maxima and minima of the sequence x(t), through the cubic spline interpolation, the upper envelope (u1(t)) and the lower envelope (u2(t)) of x(t) are calculated.
-
Calculate the median curve (m1(t)).
-
Subtracting the median curve from the original signal yields the remaining signal.
-
Using h1(t) as a new signal sequence, repeat the above operation until h1(t) becomes a zero-mean process.
-
After the zero-mean process h1(t) is obtained, it is taken as the first IMF component c1(t), It represents the highest frequency component of the original signal.
-
Subtracting c1(t) from the original signal x(t) results in a new signal process r1(t).
-
The sequence r1(t) is taken as the original data, repeat steps (1)–(5) and obtain the sequence c2(t), c3(t), c4(t) and so on. The original signal is finally reconstructed.
Where: The sequence rn(t) is the trend term, representing the average trend of the signal.
2.2 The basic principle of Extreme-point Symmetric Mode Decomposition
The Extreme-point Symmetric Mode Decomposition (ESMD) method is a new development of the EMD method. This method solves the problem of “modal aliasing” in EMD and it has a big advantage in climate data analysis (Wang and Li, 2014). This method is good at finding trends and can separate inter-annual trends and the general trend of climate change in the observed sequence, helping to probe the issue of global warming. And this method can find the anomalous period and frequency band from the decomposition mode, which is good for the research of climate anomaly. The modal decomposition of the ESMD method is as follows:
-
Find all maxima and minima of the sequence X(t), denoted by .
-
Connect all the adjacent poles with line segments and mark the mid-points as , and add the boundary mid-points F0 and Fn at the left and right ends.
-
The interpolation curve L1, …, Lp(p≥1) is constructed by using n+1 midpoints, and calculated the mean curve .
-
The above steps are repeated for the sequence until (ε is the allowable error) or the number of screened times reaches the preset maximum value K, resulting in the first empirical mode M1(t).
-
The above four steps are repeated for the remaining sequences X(t)−M1(t), and the empirical modes M2(t)−M3(t) … are obtained respectively until the remaining sequence R(t) remains only for a certain number of poles.
-
Change the maximum number of screening times K within the defined interval [] and repeat the above five steps. Then calculate the variance ratio σ∕σ0, and draw it with K changes in the map to find the minimum σ∕σ0 corresponding K0. Repeat the above five steps again with K0 as the limiting condition. The last remaining term R(t) is the adaptive global averaging of the sequence X(t).
After decomposition, the original time series X(t) is reconstructed as:
3.1 Study area profile
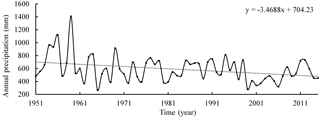
Beijing is located in the northwestern end of the North China Plain, the central Haihe River Basin, the land area of 16 410 km2, is a typical northern temperate semi-humid monsoon climate. The complex and varied topography has created a diversity of weather conditions in Beijing. Summer heavy rainfall and strong convective weather are the main causes of frequent droughts and floods in Beijing. Shown in Fig. 1 for the Beijing 1951–2015 nearly 65 years of precipitation. Among them, the largest precipitation was 1407 mm in 1957, the smallest precipitation was 267 mm in 1965, the average annual rainfall was 589.75 mm, and the rate of linear precipitation decrease is 3.47 mm a−1.
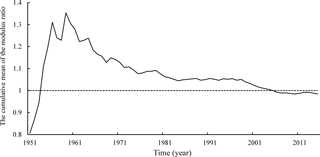
In this study, the annual rainfall data are provided by the National Climate Center of China Meteorological Administration. The data are released after the reorganization and review of the institution, so the reliability of the data can be basically guaranteed. As shown in Fig. 2, plot annual precipitation model ratio coefficient curve in Beijing, and analyze the representativeness of the data. It can be seen from the figure that with the increase of time, the amplitude of the curve is getting smaller and smaller, and when the annual rainfall series is over 50 years, the cumulative mean of the modulus ratio tends to 1, indicating that this series of data has certain stability.
3.2 Multi-scale analysis of precipitation changes
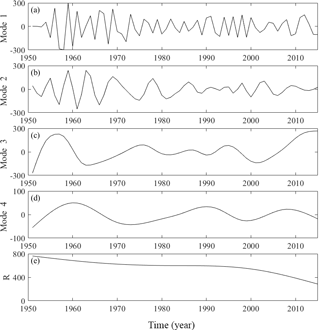
The ESMD method was used to decompose the annual mean precipitation series from 1951 to 2015 in Beijing. The best screening frequency was 26 times when the ratio of variance was the smallest, and 4 modes (Mode 1–4) and a trend margin R, as shown in Fig. 3.
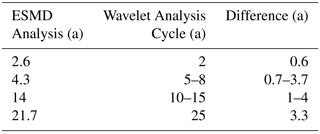
In order to verify the reliability of the decomposition results, this paper synthesize a reconstructed sequence from the decomposed Mode 1–4 and the trend series R, and find that the reconstructed sequence is completely consistent with the original precipitation sequence, indicating that the decomposition result of ESMD method is credible of. In Fig. 3, the four mode components of ESMD decomposition each reflect the oscillations of different characteristic scales inherent in the original sequence, and the influence of signal fluctuation frequency of each scale on the overall characteristics of the original data is represented by the variance contribution rate. The Periodic Diagram Method is used to estimate the average period of each decomposition mode. Table 1 shows the mean period and the variance contribution rate of each modal component. It can be seen that annual precipitation in Beijing has annual variations of 2.6 and 4.3 years, and inter-decadal changes of 14 and 21.7 years. In addition, the main periods of the precipitation time series does not change over time during the study period.
Combined with Table 1 and Fig. 3 quantitative analysis: The precipitation series of 65 years in Beijing contain many time-scale features, and the precipitation changes are mainly determined by the three higher-frequency oscillations of Mode 1–3. Among them, the Mode 1 (Fig. 3a) with a period of 2.6 years has the largest variance contribution rate, reaching 32.47 %. The signal oscillation of Mode 1 is very obvious and indicates the precipitation has a decreasing-increasing cycle change, which basically reflects the alternation of precipitation in Beijing before the 1970s. Mode 2 (Fig. 3b) indicates that there is a 4.3-year periodic change in the precipitation series in Beijing. Its variance contribution rate is about 16.74 %. Throughout the study period, Mode 2 shows that the amplitude of rainfall in Beijing fluctuated greatly before the 1970s and gradually decreased after the 1970s. Mode 3 (Fig. 3c) with a period of 14 years has only a smaller variance contribution rate of Mode 1, about 27.5 %. As can be seen from Fig. 3c, the amplitude changes steadily and fluctuates relatively little in the late 1960s and mid-1990s, but it significantly increased from the early 1950s to the late 1960s and after the 1990s. This shows that the precipitation variation in these two periods is great compared with other periods. Mode 4 (Fig. 3d) with a period of 21.7 years has the smallest variance contribution rate, only 1.37 %. Its amplitude is relatively stable over the entire time span. Comparing Mode 3 with Mode 4 can find that Mode 3 has a wide range of amplitude variations and the amplitude range of Mode 4 is significantly smaller. This indicates that the anomalous precipitation mainly occurs on the time scale of 14 years.The variance contribution rate of trend item R (Fig. 3e) is about 16.74 %. It reflects the overall trend of precipitation in Beijing over the past 65 years. As shown in Fig. 3e, trend item show a non-linear trend of gradual decline over the entire time scale.
3.3 Wavelet analysis and verification
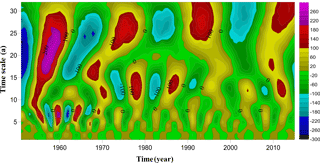
Wavelet analysis is a hot frontier field in recent years because of its special advantages for signal processing, it is widely used in the field of time-frequency structure analysis of weather and climate sequences (Yang and Shu, 2017). This paper uses the Morlet wavelet transform to analyzes the annual precipitation anomaly sequence. Figure 4 shows the real part time frequency distribution of wavelet coefficients of the precipitation anomaly sequence in Beijing in recent 65 years. When the wavelet coefficient is positive, it indicates that the precipitation is relatively large and the greater the value, the more precipitation. When the wavelet coefficient is negative, the precipitation is less than normal.
It can be seen from Fig. 4 that precipitation in Beijing has multi-scale changes of 2, 5–8, 10–15 and 25 years. Throughout the study period, the wavelet coefficients alternated between positive and negative, indicating that the change of precipitation with the alternation of abundance and dryness over time. Table 2 shows the comparison between the wavelet and the ESMD analysis cycle results, the results of the two methods have some differences, and the longer the cycle shows the greater the difference.
As a time-frequency analysis method, wavelet transform is the same as other time-frequency analysis methods, such as short-time Fourier transform and classical spectral estimation, which is based on Fourier transform theory as a basis. There are some limitations, such as the selection of wavelet basis functions, constant multi-resolution and other issues. Compared with the wavelet analysis, the ESMD method based entirely on the characteristics of data changes decomposition and got rid of the shackles of the Fourier transform theory. This method not only has the advantages of multi-resolution wavelet transform, but also breaks through restrictions of the wavelet basis functions, it has strong flexibility and adaptability. The decomposition process of this method is easier than wavelet analysis, and the components can clearly characterize the variation characteristics of signals on different time scales. It is more helpful to explore the inherent laws of things.
ESMD method is a suitable method for analyzing non-linear and non-stationary sequence signals. Applying the ESMD method to climate element time series not only separates the annual and inter-decadal trends, but also separates the general trend of climate change. This study shows that the 65-year precipitation series in Beijing are mainly composed of Mode 1, Mode 2 and Mode 3, indicating that the 2.6-, 4.3-, and 9-year scale oscillations play a major role in the change of the whole sequence. Combining several mode components and the trend term R predicts that the annual precipitation in Beijing will continue to decrease in the next few years.
Under the background of global warming, the influence of natural factors and human activities are superimposed on each other, and the variation of hydrological time series is more complicated. Based on the study of precipitation series in Beijing, this paper shows that ESMD method has better analysis effect on time series of hydrology. However, the current research is only in the initial stage. How to determine the influence factors of each mode component, calculate its weight and finally apply it to the prediction of time series will be the key work in future.
Data are available at: http://cmdp.ncc-cma.net/cn/index.htm. This site requires user registration to download precipitation data.
The authors declare that they have no conflict of interest.
This article is part of the special issue “Innovative water resources management – understanding and balancing interactions between humankind and nature”. It is a result of the 8th International Water Resources Management Conference of ICWRS, Beijing, China, 13–15 June 2018.
This study was financially supported by National Key Projects of China “Water resources efficient development and utilization”
(2017YFC0405900, 2016YFC0402208, 2016YFC0401903) and National Natural Science Foundation of China
(No. 51641901). The author would like to give special thanks to
anonymous reviewers.
Edited by: Dingzhi Peng
Reviewed by: two
anonymous referees
Huang, N. E., Shen, Z., and Long, S. R.: The empirical mode decomposition and the hilbert spectrum for nonlinear and non-stationary time series analysis, Philos. T. R. Soc. A, 454, 903–995, https://doi.org/10.1098/rspa.1998.0193, 1998.
Sun, Z., Feng, S., and Yang, Z.: Precipitation characteristics in Beijing from 1950 to 2005, J. Irrig. Drain. E., 2, 12–16, 2007.
Wang, J. and Li, Z.: ESMD method for climate data analysis, Climate Change Research Letters, 3, 1–5, https://doi.org/10.12677/ccrl.2014.31001, 2014.
Wang, W., Zhang, W., and Cai, X.: Changes of temperature and precipitation in Beijing in recent 50 years, Journal of Arid Meteorology, 27, 350–353, 2009.
Xia, C. and Liu, C.: Conjoint analysis of near-fault multi-pulse ground motion based on wavelet transformation and extreme-point symmetric mode decomposition, Journal of Disaster Prevention and Mitigation Engineering, 37, 697–704, 2017.
Xue, C., Hou, W., and Zhao, J.: Application of set empirical mode decomposition in multi-scale analysis of regional precipitation change and research of climate change response, Acta Phys. Sin., 62, 109–203, 2013.
Yang, Y. and Shu, H.: Small and medium scale of climatic variation characteristics of Baiyin city – Gansu Province, Journal of Arid Land Resources and Environment, 31, 126–131, https://doi.org/10.13448/j.cnki.jalre.2017.155, 2017.
Zhu, L., Chen, Y., and Li, L.: Analysis of precipitation variation trend in Beijing City from 1951 to 2009, Water Resources Protection, 28, 42–46, https://doi.org/10.3969/j.issn.1004-6933.2012.03.008, 2012.


