the Creative Commons Attribution 4.0 License.
the Creative Commons Attribution 4.0 License.
 | 05 Jun 2018
Evaluation of blue and green water resources in the upper Yellow River basin of China
Xiaoxi Gao
Depeng Zuo
Zongxue Xu
Siyang Cai
Han Xianming
The total amount of water resources severely affects socioeconomic development of a region or watershed, which means that accurate quantification of the total amount of water resources is vital for the area, especially for the arid and semi-arid regions. Traditional evaluation of water resources only focused on the qualification of blue water, while the importance of green water was not fully considered. As the second largest river in China, the Yellow River plays an important role in socioeconomic development of the Yellow River basin. Therefore, the blue and green water resources in the upper Yellow River basin (UYRB) were evaluated by the SWAT model in this study. The results show that the average annual total amount of water resources in the UYRB was 140.5 billion m3, in which the blue water resources is 37.8 billion m3, and green water resources is 107.7 billion m3. The intra-annual variability of the blue water and green water is relatively similar during the same period. The higher temperature, the greater difference between the blue and green water. The inter-annual variability of the blue and green water shows that the trends in precipitation, blue and green water have a relatively similar characteristic. The spatial distribution of the blue and green water is characteristic with gradually decreasing from the northwest to the southeast, and the blue water around the main stream is greater than that in the other areas.
- Article
(2880 KB) - Full-text XML
- BibTeX
- EndNote


Water is one of the essential resources for human lives because it is needed for municipal, industrial and agricultural water use, hydropower generation and recreational activities (Lee and Bae, 2015). However, many people lack awareness ofwater conservation. In addition, the improper utilization of water resources and the increasing demand of water for agriculture and industry, the shortage of water resources has restricted the development of human society. Therefore, the importance of water resources should be fully understood in a sustainable development way and the amount of water resources should be scientifically assessed, which are key factors to guarantee the human society healthy and ordered development. However, the traditional evaluation of water resources only considers the surface water and groundwater in hydrologic cycle, namely “blue water” (Shikiomanov, 1997, 2000) and often have ignored the “green water” in hydrologic cycle. Green water flow to the atmosphere through evapotranspiration of grassland, forest and farmland accounts for 65 % of the global precipitation, while traditional blue water resources only occupy 35 % of the global precipitation (Ringersmas et al., 2003). In arid and semi-arid regions, green water plays an essential role in crop production and the provision of ecosystem services (Falkenmark, 1995). Therefore, many studies begin integrating the two types of water into one concept or theoretical framework (Falkenmark and Rockström, 2006; Rockström et al., 2009), it may provide a scientific basis for the planning and management of water resources and optimal utilization of water resources in the water scarce region especially in arid and semi-arid areas.
The concepts of blue and green water were proposed firstly by Falkenmark (1995) at the conference held by the Food and Agriculture Organization of the United Nations (FAO). He thought that the amount of water on the continent is composed of blue water and green water. Blue water is surface runoff formed by precipitation and deep aquifer recharge formed by infiltration, mainly including visible liquid water stored in rivers, reservoirs, lakes, wetlands and shallow aquifers. Green water is the water that infiltrates into the unsaturated soils from precipitation to plant growth and the invisible water flow released to the atmosphere. Afterwards the concept of green and blue water was developed by many other researches (Falkenmark and Rockström, 2006; Schuol et al., 2008a, b; Faramarzi et al., 2009; Liu and Yang, 2010). By definition, blue water is consisted of surface water and groundwater. Green water consisted of green water flow and green water storage. Green water flow is actually evapotranspiration including evaporation from soil and water bodies and transpiration from vegetation. Green water storage is the amount of water in the soil profile at the end of a time period.
The method of estimating blue water is well established, but the blue water is needed to develop. There are many studies about the estimation method of green water (Cheng and Zhao, 2006). The green water resources are estimated based on the water consumption of dry matter produced by the ecosystem and the water demand. For example, Postel et al. (1996) estimated the global non-irrigation vegetation evapotranspiration as the amount of green water resources by using the net primary productivity data; estimating the green water flow of biotic formation based on the factors affecting evapotranspiration, for example, Rockström and Gordon (2001) estimated the green water flow based on the vegetation cover multiply by the evapotranspiration and considering the factor affecting the evapotranspiration; estimating the green water flow by hydrological model, such as Faramarzi et al. (2009) estimated the blue-green water resources of Iranian by using ArcSWAT model, taking into account the impact of reservoir operation and different irrigation conditions on wheat crop yield; coupling hydrological models with vegetation dynamics, biogeography and so on to estimate the green water flow. For example, Y. J. Wang et al. (2009) constructed eco-hydrological models to quantitatively simulate the ecological water consumption of Sanmenxia vegetation and analyzed the water consumption efficiency of different vegetation cover.
As the largest source of water supply in northwest and north China, the runoff of the Yellow River accounts for 2 % of the whole China, but it is responsible for the irrigation of 15 % cultivated land and the water use of 12 % population of China (Lan, 2005). Since the 20th century, the water resources problem in the Yellow River Basin have become more and more serious, including the prominent contradiction between the supply and demand of water resources, the sharp drop in water volume and the frequent interruptions in the lower reaches and so on. It has seriously affected the socioeconomic development of the Yellow River Basin. In order to ensure the sustainable development of water resources in the Yellow River Basin and to ameliorate the local situation of water use, more attention should be pay to the ecological environment in the upper Yellow River Basin. Since Two thirds of the water resources of the Yellow River come from the upper reaches, the water resources issue of the Yellow River should be focused on the upstream. During the past half century, the changes of drought innorthern and even all over Chinasignificantly aggravated, there also occurred rare and serious droughts in the upper reaches region of the Yellow River. Coupled with the adverse effects of human activities, it makes the extremely fragile ecology environment more worse.
Therefore, this paper intends to take advantages of the SWAT model that can directly output the blue and green water to scientifically and reasonably assess the amount of blue and green water resources and its spatiotemporal change in the upper reaches region of the Yellow River. It could make us better understand conversion process of blue and green water and consequently provide useful information for water resource planning and utilizing in other arid and semi-arid regions.
2.1 Study area
The Yellow River Basin is located between 96–119∘ E and 32–42∘ N. The Yellow River rises in Bayan Har Mountan of Qinghai province and goes through the provinces of Qinghai, Sichuan, Gansu, Ningxia, Inner Mongolia, Shaanxi, Shanxi, Henan and Shandong and flows into Sea in Dongying City of Shandong Province with an overall length of 5464km and the drainage area of 795 000 km2. The basin crosses the northeast of the loess plateau and northeast of the Tibetan Plateau,and between 95∘52′–103∘50′ E and 32∘09′–38∘21′ N. The mainstream length of the studied area is 21 199 km, accounting for 38.9 % of the total length of the Yellow River and 61.0 % of the total length of the upper Yellow River basin. The drainage area cover 22.31 km2, accounting for 29.7 % of the total area of theYellow River basin (Fig. 1). The mean annual depth of runoff and precipitation are 147.1 and 426.2 mm respectively (G. Wang et al., 2009).
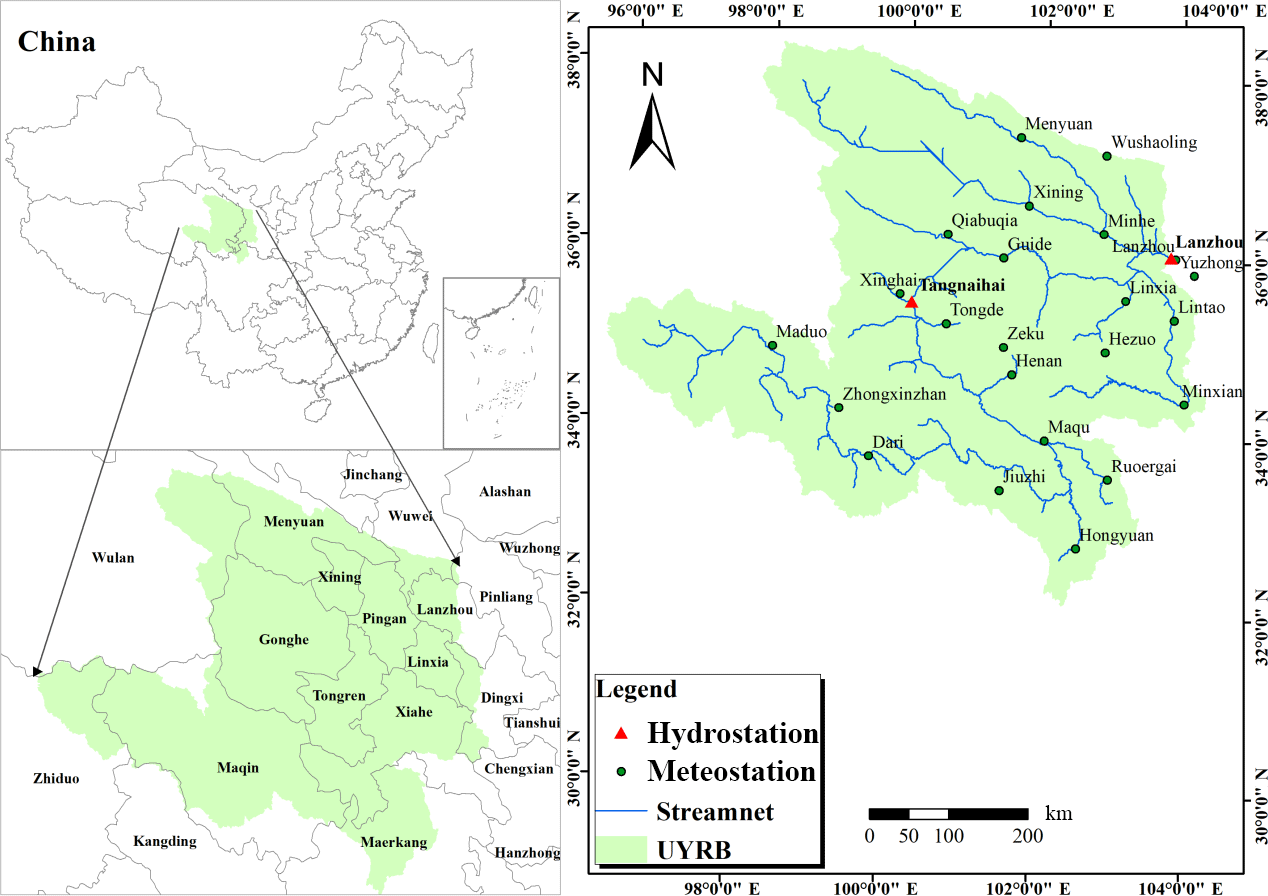
Figure 1Location of the study area and the meteorological and hydrological stations selected.
2.2 Data description
The databases used in this study include Digital Elevation Model (DEM), land-use, soil-type, meteorological and hydrological observed data. DEM with a spatial resolution of 90 m was collected from Geospatial Data Cloud. Based on the DEM extracted by SWAT model according to the location of the Basin export section, the digital river network was generated, and the sub-basins were divided.
A land use map at a scale of 1 : 250 000 was provided by the Data Center for Resources and Environmental Sciences, Chinese Academy of Sciences (RESDC). The original land use was reclassified into 12 different types by merging similar type of land use to match the SWAT land use classification. The land use mainly include forest-evergreen (FRSE), forest-deciduous (FRSD), forest-mixed (FRST), range-brush (RNGB), pasture (PAST) and so on.
A soil property map (1 : 1 000 000) was also obtained from the RESDC. Because the soil property database of SWAT model is based on US information and there was a little difference in grain size partition of soil between US and China, a local soil properties database for the UYRB was established combined with the Soil Plant Atmosphere Water (SPAW) software (Saxton and Rawls, 2006).
Weather input data (daily precipitation, maximum and minimum temperature, relative humidity, wind speed and sunshine hours) were obtained from China Meteorological Data Sharing Services System Network for 24 synoptic stations from 1968 to 1997. The daily solar radiation was calculated by daily sunshine hours with an empirical expression. River discharge data series needed for calibration and validation were obtained from the Yellow River Conservancy Commission (YRCC) for two gauging stations (Tangnaihai and Lanzhou) which have same period with weather data.
3.1 SWAT model
The Soil and Water Assessment Tool (SWAT) is a basin hydrology model developed by the U.S. Department of Agriculture-Agricultural Research Service (USDA-ARS) in the early 1990s to assess the impact of land management practices on water, sediment, and agriculture chemical yield in large, complex watersheds with varying soils, land use, and management conditions over long periods (Zuo et al., 2016).
A watershed is first divided into sub-basin on the basis of the DEM and river and then into multiple hydrological response units (HRUs) based on the unique soils and land use types within the subbasins (Arnold et al., 1998). Due to the variability of spatial-temporal distribution for underlying surface and climatic elements, this SWAT model can improves the simulation accuracy to a certain extent. Hydrological processes can be divided into two phases. The former controls the amount of water, sediment and nutrients that will flow into the main channel at each sub-basin, while the latter controls transport of water, sediment and other substances in channels (Xu et al., 2009).
The preprocessing of the SWAT model input (e.g., watershed delineation, manipulation of the spatial and tabular data) was performed by ESRI ArcGIS10.1 using the ArcSWAT interface (Winchell et al., 2013).
3.2 SUFI-2 algorithm
The sequential uncertainty fitting algorithm (SUFI-2) procedure (Abbaspour, 2011) was used for parameter optimization. In this procedure, all uncertainty sources (parameters, models, measured data, and so on) are displayed onto parameter ranges, which are calibrated to bracket most of the measured data in the 95 % prediction uncertainty (95PPU) (Abbaspour et al., 2007). Overall uncertainty in the output is quantified by the 95PPU calculated at 2.5 % (L95PPU) and 97.5 % (U95PPU) levels of the cumulative distribution of an output variable obtained through Latin hypercube sampling (Zuo et al., 2015). And the P-factor and R-factor are used to measure the goodness of calibration/uncertainty. The P-factor indicates the percentage of data bracketed by the 95PPU band and the R-factor is the average width of the band divided by the standard deviation of the corresponding measured variable (Abbaspour et al., 2007; Yang et al., 2008). Theoretically, the calibration result is perfect when the P-factor is close to 1 and the R-factor is close to 0, so a better balance is needed to find to make both best.
The operation of SUFI-2 algorithm mainly includes:
-
Determine the objective function.
-
Select the parameters that are sensitive to the variables and give the limit of variation.
-
The model performs Latin Hypercube sampling according to the parameter range.
-
Simulating each group of parameters obtained by Latin Hypercube sampling.
-
Evaluate the objective function and calculate the final results.
3.3 Objective functions for model calibration and validation
There are nine types of objective function involved in SWAT. In this paper, two evaluation indexes was used including linear regression coefficient (R2) and Nash efficiency coefficient (Ens) to be as evaluation criteria for parameter optimization.
Nash and Sutcliffe (1970), Where Qm,i is measured value, m3 s−1; Qs,i is simulation value, m3 s−1; Qm,avg is the average of measured value, m3 s−1; Qs,avg for the average value of the simulation, m3 s−1; n is the length of the database.
The R2 represent the consistency of trend for simulated and measured value, the larger the value of R2 indicates the simulation agree better with the measurement. Ensindicates the rate of deviation between the measured value and the simulated value, Ens represents the degree of deviation for simulated and measured value, the value of Ens are closer to 1which indicates the smaller deviation between the measured value and the simulated value when Ens≤0.36, the simulation is considered bad, when 0.36≤Ens<0.75, the simulation is considered satisfied, when Ens≥0.75, the simulation is thought good (Geza and Mccray, 2008).
4.1 The model calibration and validation
According to the DEM of upper reaches of the Yellow River, the catchment area is divided into 89 sub-basins by the SWAT model (Fig. 2).
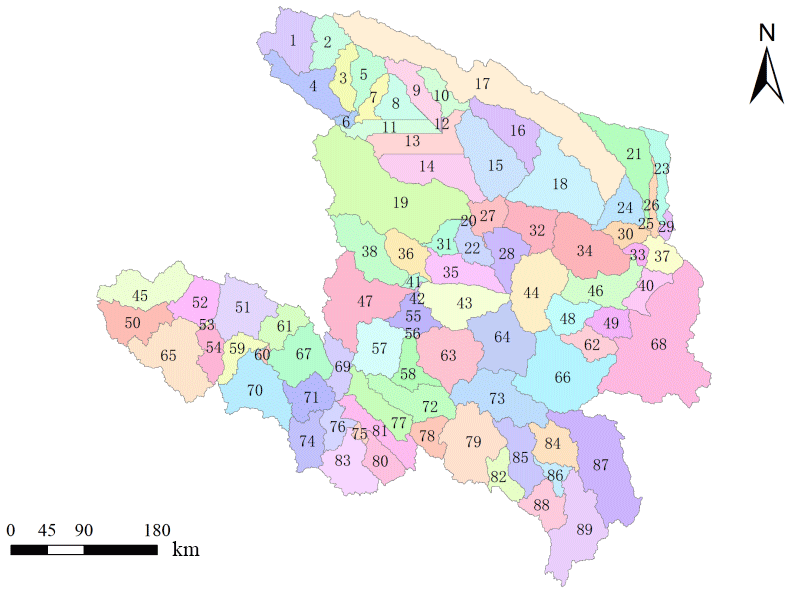
After completing the model specification, the model parameters need to be calibrated and validated to ensure the accuracy of the final results that estimating the blue and green water. The data from 1966 to 1967 were taken as warm-up period. The data from 1968–1982 were used for calibration and from 1983 to 1997 was used for verification purpose. Due to the large number of parameters contained in the SWAT model, 10 parameters that are sensitive to runoff are selected for the calibration and verification based on runoff data. The R2 and Ens are used for evaluating goodness of fit between the simulated and measured values.
The SUFI-2 algorithm is used to calibrate the parameters of model through two main hydrological stations (Tangnaihai and Lanzhou station) at the basin, the hydrographs for the calibration and validation periods are showed in the Figs. 3 and 4 respectively.
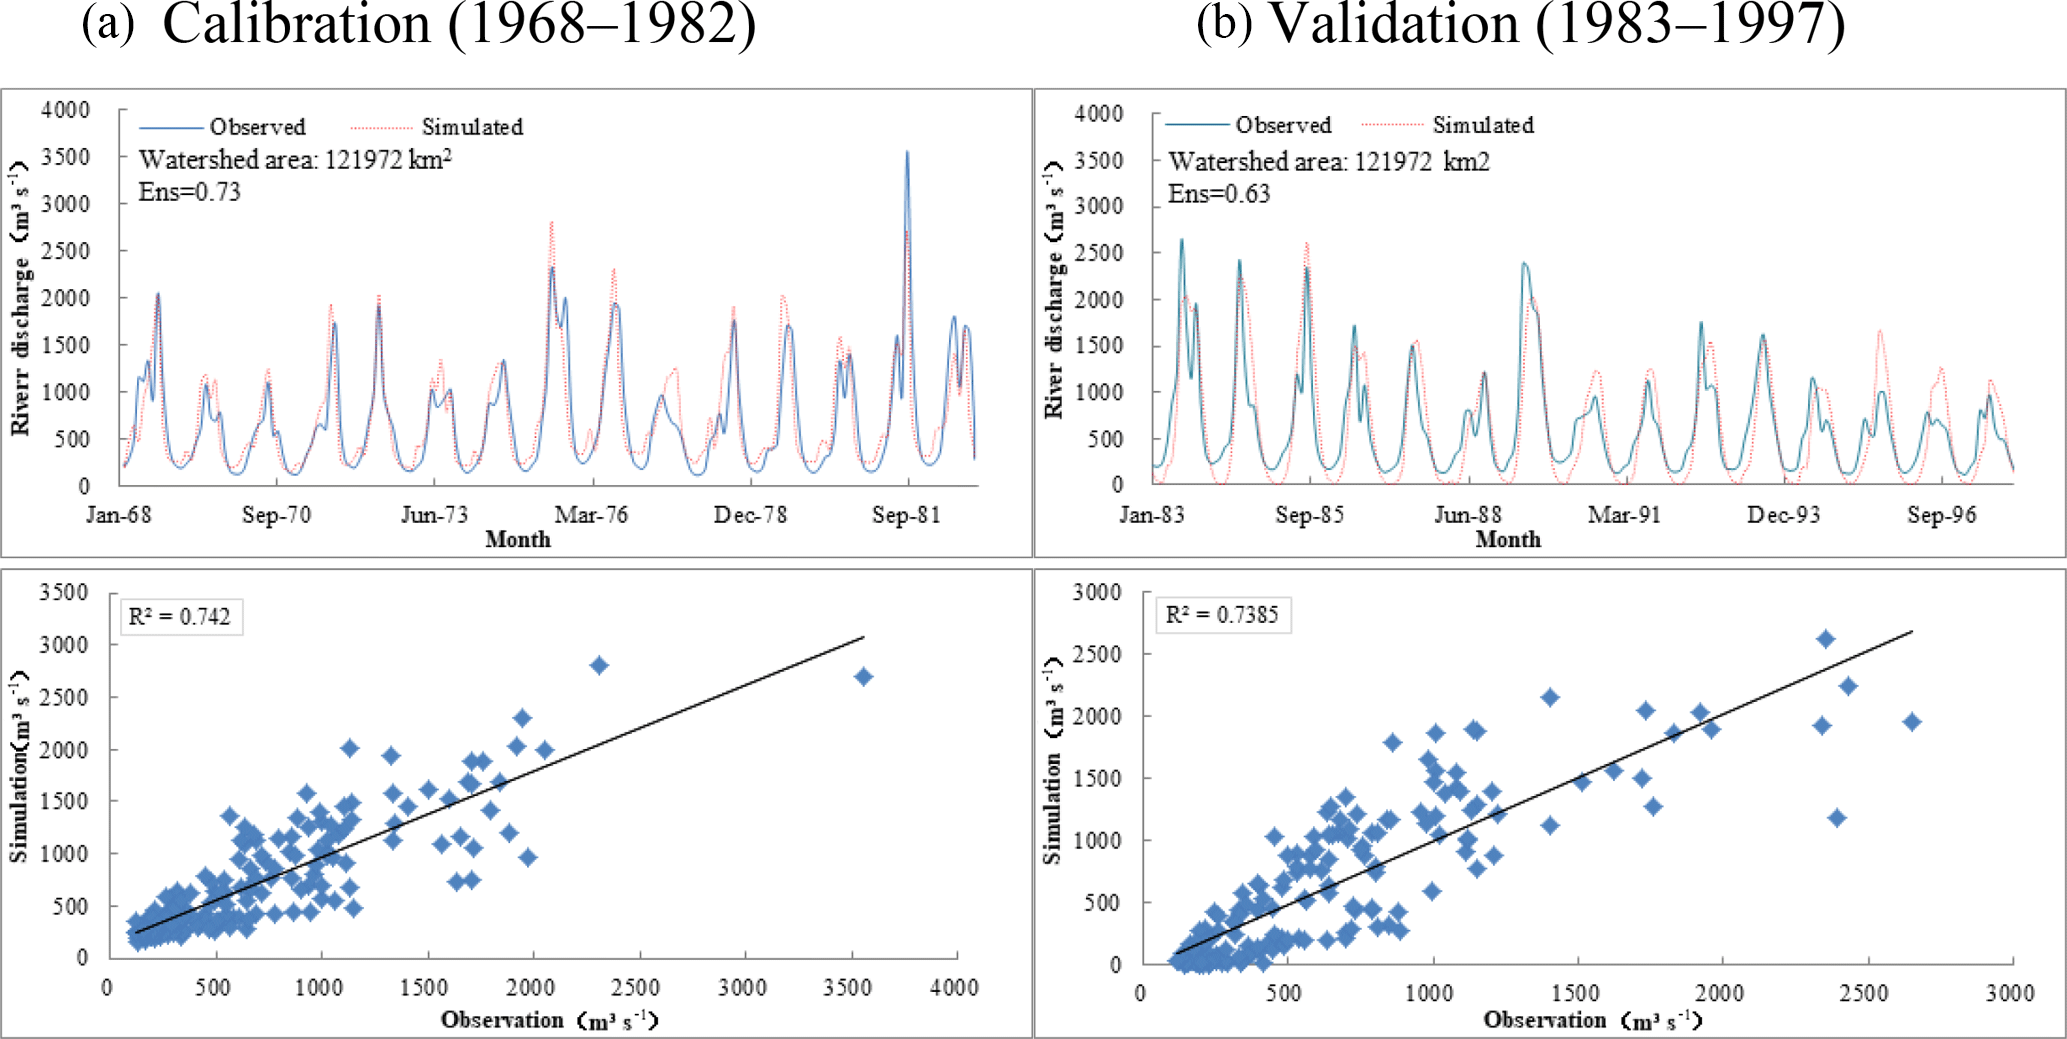
Figure 3Comparison between the measured and the simulated discharges for Tangnaihai hydrometric station. Calibration (a) and Validation (b) are showed.
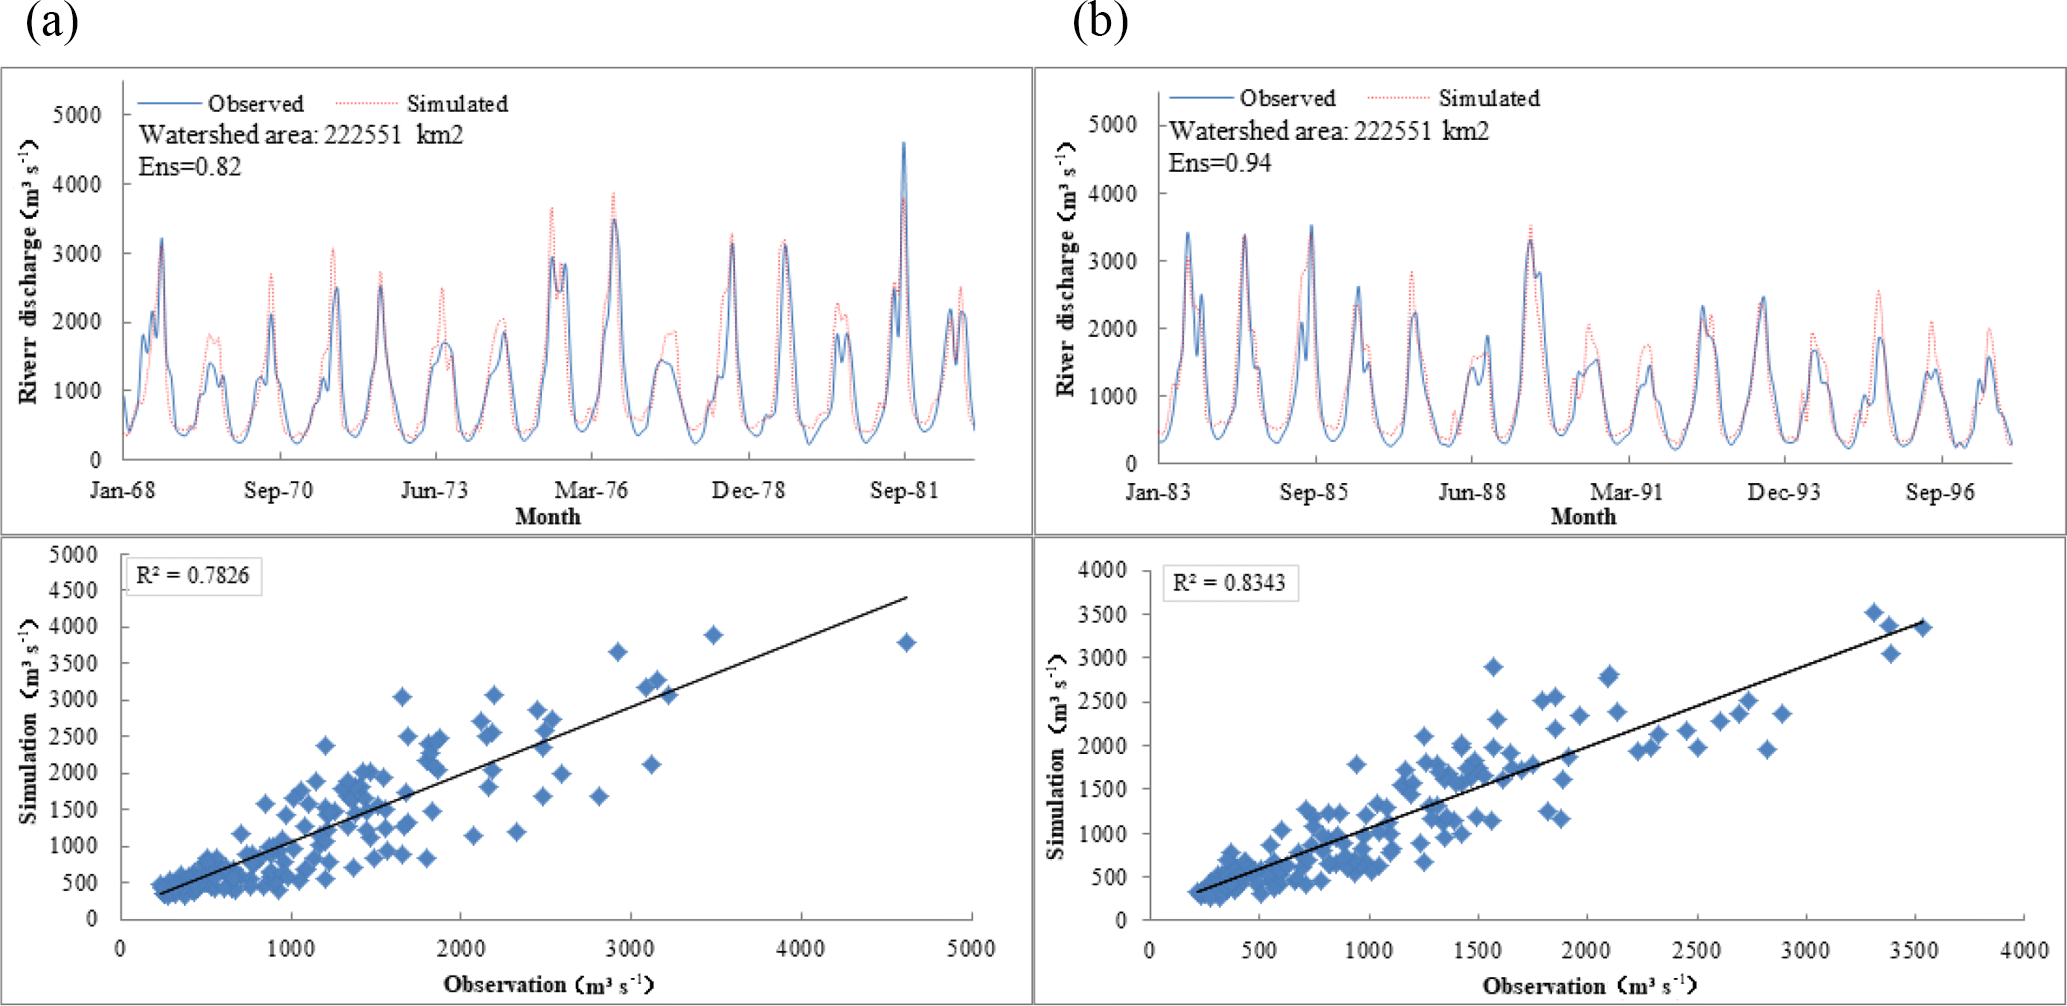
Figure 4Comparison between the measured and the simulated discharges for Lanzhou hydrometric station. Calibration (a) and Validation (b) are showed.
According to Figs. 3 and 4, it can be seen that the trend of the measured value and the simulated value of two main gauging stations is good at the calibration and validation periods, but there is an obvious deflection in the place where appear extremum. And there are some obvious deviation between measured value and simulated value at base flow part in Tangnaihai verification period, which may be related to the parameter of ALPHA_BF in validation period, or because of the self-defect of SWAT model for extremum simulation of runoff.
The calculation of snowmelt runoff in the SWAT model mainly considers the effect of air temperature. The degree-day factor method is suitable for the plain areas with abundant rainfall and flat terrain. However, portions of the study area where the altitude is high, the climate is cold and rainfall is scarce, the snowmelt runoff is not only affected by the temperature, but the topography, climate change and solar radiation also have a great impact on snowmelt runoff. The accuracy of snowmelt runoff simulated by the degree-day factor method of SWAT model is relatively low, which actually gives some errors to the assessment results of blue and green water resources. However, the relative error of the simulation period was −2.35 %, the correlation coefficient was 0.63, and the Nash efficiency coefficient was 0.74, which met the accuracy requirements of model simulation.
On the whole, the simulation accuracy of the model for the validation period is satisfactory that proving it is feasible to use the SWAT model to analyze the blue and green water in the upper Yellow River basin of China.
4.2 Assessment of blue and green water resources
According to output file of the model, the amount of blue and green water (1968–1997) in the upper Yellow River basin of China can be obtained (Table 1). The sum of WYLD and DA_RCHG can be considered as the blue water and the green water is equal to the sum of green water flow and green water storage.
Table 1The amount of the precipitation and the blue and green water from 1968 to1997
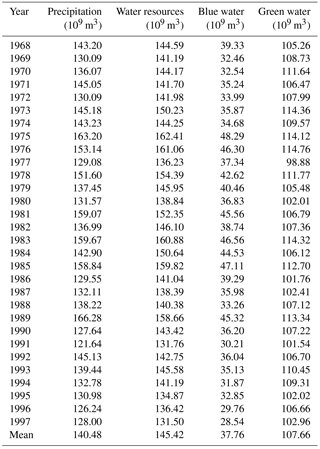
According to Table 1, the average annual precipitation in the upper Yellow River basin of China was 140.48 billion m3, the total amount of blue and green water resources was 145.42 billion m3, of which 37.76 billion m3 was blue water and 107.66 billion m3 was green water. The amount of green water was about 2.85 times the amount of blue water. As a result, the upper Yellow River basin of China has abundant water resources. However, most of the precipitation in the basin is converted into green water because of the influence of regional climate and underlying surface, which cannot be directly used by human beings. As global temperatures rise making the situation worsen in the future. The continuous reduction of blue water resources will inevitably lead to the contradiction among supply and demand of water resources and ecological environment in the basin.
4.3 The temperal variations of blue and green water resources
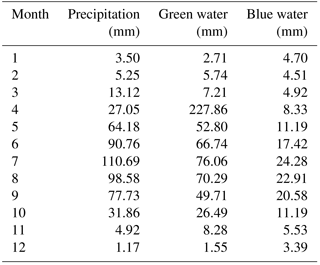
The water quantity of blue and green water can be obtained from the SWAT model output file and the average value of blue and green water resources in each month from 1968 to 1997 had been shown in Table 1. The intra-annual variability of blue and green water was shown in Table 2.
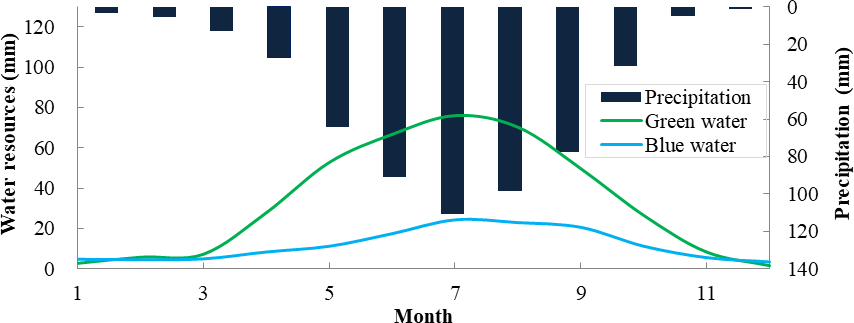
As can be seen from Fig. 5, the amount of blue and green water varies irregularly during the year, and the trend was basically accord with precipitation. The precipitation reached the highest in the flood season (6–8) and the lowest in winter (12–2), showing a process of gradual advance and decline. The blue and green water resource was low in winter, not only connected with less precipitation, but the temperature was also an important factor. With the temperature rising, the difference between the blue and green water became wider and wider with the highest in July. The reason was that the higher temperature, the greater evapotranspiration. Therefore the summer precipitation was mainly consumed by evapotranspiration.
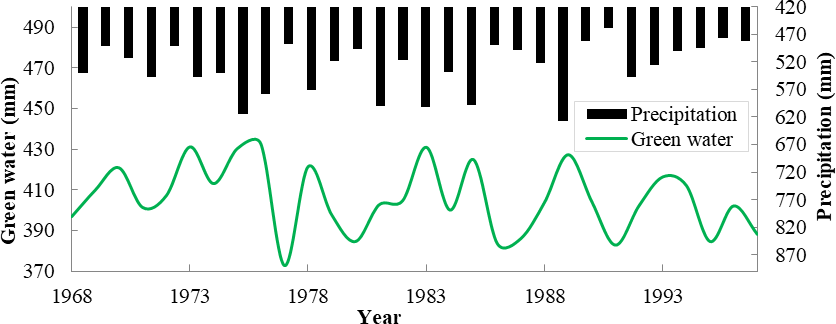
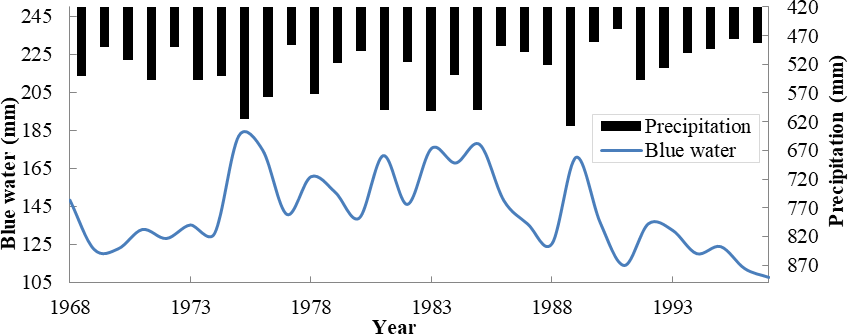
By calculating the annual precipitation and blue and green water resources from 1968 to 1997, the intra-annual variation of precipitation and blue water and green water were got and shown in Figs. 6 and 7.
As can be seen from Figs. 6 and 7, the inter-annual variation of precipitation, blue water and green water were basically the same. Where the years with large variation of precipitation, the change of the blue and green water are also large, forming trough and crest. There is a typical phenomenon that more precipitation during 1975 and 1989 and more blue and green water during the period, indicating the change of blue and green water were closely related to precipitation. In addition, the change of blue water in some years lagged behind that precipitation. One cause may be that the evaporation is relatively small during each precipitation in a year, cumulative processes are the major factors behind the phenomenon.
4.4 The spatial patterns of blue and green water resources
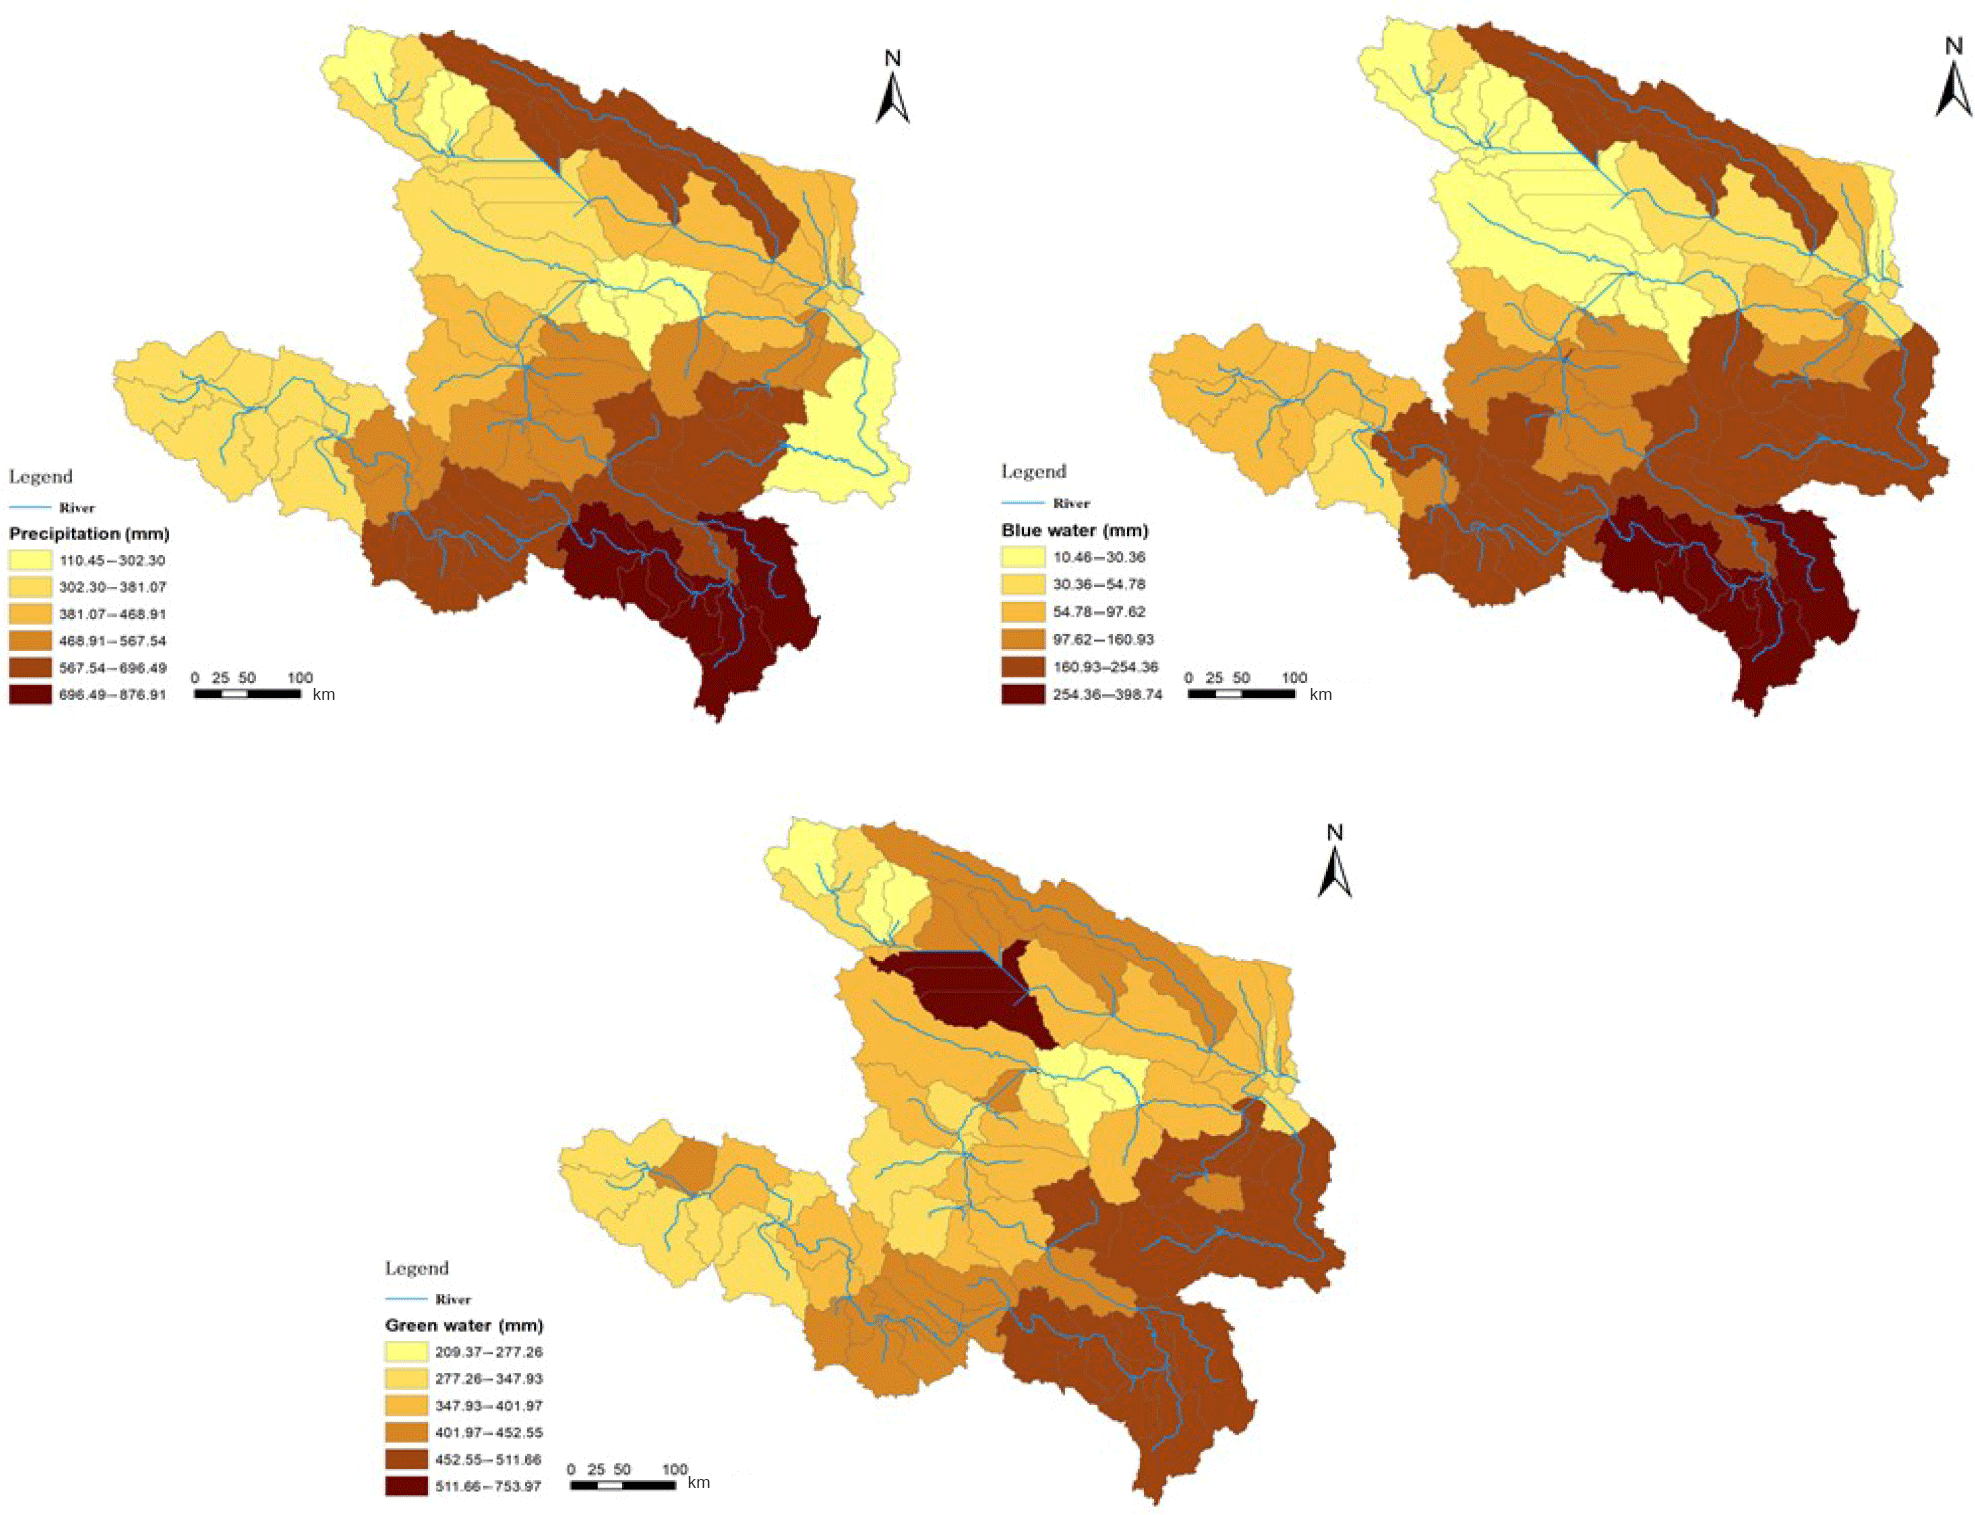
Through neatening the output files of SWAT model, the average annual precipitation (1968–1997) of precipitation, blue and green water at 89 subbasins can be obtained. The ArcGIS10.1 was used to express the spatial distribution of precipitation, blue and green water (Fig. 8).
The spatial distribution of precipitation, blue and green water were shown in Fig. 8. The Fig. 8 illustrates that mean annual precipitation was about 300 and 700 mm in the northwest and southeast of study area respectively, and showing a decreasing trend from southeast to northwest. Most of the green water comes from the actual evapotranspiration, so the green water is closely related to the distribution of precipitation in the basin. The spatial distribution of green water and precipitation are basically the same. Because of the existence of Qinghai Lake in the northwest of Qinghai Province, large quantity of green water evaporates from water surface. The spatial distribution of blue water is consistent with the precipitation and green water. The reason for the result is closely related to the underlying surface conditions in the basin. The southeastern of basin is distributed mainly over Hongyuan County, Zoige County and Aba Prefecture in Sichuan Province. There are much swamps and wetlands and the temperature is higher compared with other regions at the same latitude, resulting in a large amount of precipitation and evaporation in the region. At the same time, the upper Yellow River basin is located in inland basin of northwest China where far away from the oceans, making it hard to be affected by warm wet air current of Pacific Ocean, coupled with the impact of global warming, making increase of growing season for vegetation, in addition the vegetation coverage increases from the southeast to the northwest, which is another reasons for the decrease of green water from southeast to northwest.
The assessment on spatial and temporal distribution of blue and green water was evaluated in the upper Yellow River basin of China, the major conclusions obtained in this study are as follows:
-
The mean annual (1968–1997) precipitation of the upper basin of the Yellow River was 140.481 billion m3, and the sum multi-year mean of blue and green water was 145.425 billion m3, which was 3.85 times of the blue water that traditional evaluation of water resources. The annual average of blue and green water were 37.764 and 107.661 billion m3 respectively, and green water accounts for 77 % of the total water resources, indicating that green water resources are the main part of the total water resources, while the upper basin of the Yellow River are located in arid and semi-arid area, so it is essential to evaluate the blue water and green water together for mitigating contradiction of water resource supply and demands. At the same time, water shortage in the Yellow River Basin can be improved by implementing green water management in the basin, reducing ineffective evaporation and surface runoff, and increasing downstream water yield.
-
The variation within the year for blue and green water and precipitation were similar, showing the highest in the flood season (6–8) and the lowest in winter (12–2). The dissipation of green water increases in pace with the temperature rise, and the gap between green water and blue water is also gradually increasing with the temperature rise. The green water in summer is the main component of the total green water throughout the year, while in winter, the green water is low because of low temperature.
-
The inter-annual variation (1968–1997) of blue and green water and precipitation showed a similar tendency, and the years with large precipitation, the blue and green water are also generally larger, demonstrating the precipitation is the dominant factor for blue and green water.
-
The spatial distribution of green and blue water and precipitation are basically the same in the whole upper reaches of the Yellow River which present decreasing trend from southeast to northwest. The amount of blue water in the basin is between 10.46–398.74 mm, and the blue water around the main stream is greater than that in the other areas. In addition, the sub-basins with large precipitation also have abundant blue water resources.
Digital elevation Model (DEM) was collected from Geospatial Data Cloud (http://www.gscloud.cn/; International Scientific & Technical Data Mirror Site, 2003), and the weather input data were obtained from China Meteorological Data Sharing Services System Network (http://data.cma.cn/; CMDC, 2018). Land use map and soil property map were obtained from the Data Center for Resources and Environmental Sciences, Chinese Academy of Sciences (RESDC), and runoff data was collected from Yellow River Institute of Hydraulic Research, but these data required to reproduce these findings cannot be shared at this time due to legal or ethical reasons.
The authors declare that they have no conflict of interest.
This article is part of the special issue “Innovative water resources management – understanding and balancing interactions between humankind and nature”. It is a result of the 8th International Water Resources Management Conference of ICWRS, Beijing, China, 13–15 June 2018.
This study is jointly supported by the National Natural Science Foundation of
China (Grant No. 91647202), the National Key Research and Development Program
of China (Grant No. 2017YFC1502703), and the Major Science and Technology
Program for Water Pollution Control and Treatment (Grant No. 2017ZX07302-04).
Edited by: Yangbo Chen
Reviewed by: two anonymous referees
Abbaspour, K. C.: SWAT-CUP, SWAT Calibration and Uncertainty Programs, Swiss Federal Institute of Aquatic Science and Technology, Eawag, Duebendort, Swizerland, p. 103, 2011.
Abbaspour, K. C., Yang, J., Maximov, I., Siber, R., Bogner, K., Mieleitner, J., Zobrist, J., and Srinivasan, R.: Modelling hydrology and water quality in the pre-alpine/alpine Thur watershed using SWAT, J. Hydrol., 333, 413–430, https://doi.org/10.1016/j.jhydrol.2006.09.014, 2007.
Arnold, J. G., Srinivasan, R., Muttiah, R. S., and Williams, J. R.: Large area hydrologic modeling and assessment part I: Model development, J. Am. Water Resour. Assoc., 34, 73–89, https://doi.org/10.1111/j.1752-1688.1998.tb05961.x, 1998.
Cheng, G. D. and Zhao, W. Z.: Green water and its research progresses, Adv. Earth Sci., 21, 221–227, 2006.
CMDC (China Meteorological Data Service Center): Dataset of daily climate data from Chinese surface stations ffor global exchange (V3.0), available at: http://data.cma.cn/ (last access: 13 April 2017), 2018.
Falkenmark, M.: Coping with water scarcity under rapid population growth, Conference of SADC Ministers, Pretoria, 1995.
Falkenmark, M. and Rockström, J.: The New Blue and Green Water Paradigm: Breaking New Ground for Water Resources Planning and Management, J. Water Res. Pl., 132, 129–132, 2006.
Faramarzi, M., Abbaspour, K. C., Schulin, R., and Yang, H.: Modelling blue and green water resources availability in Iran, Hydrol. Process., 23, 486–501, https://doi.org/10.1002/hyp.7160, 2009.
Geza, M. and Mccray, J. E.: Effects of soil data resolution on SWAT model stream flow and water quality predictions, J. Environ. Manage., 88, 393–406, 2008.
International Scientific & Technical Data Mirror Site: Computer Network Information Center, Chinese Academy of Sciences, SRTMDEM 90M, available at: http://www.gscloud.cn (last access: 1 March 2017), 2003.
Lan, Y. C.: Review on Impact of Climate Change on Water Resources System in the Upper Reaches of Yellow River, Advances in Climate Change Research, 64, 310–313, 2005.
Lee, M. H. and Bae, D. H.: Climate Change Impact Assessment on Green and Blue Water over Asian Monsoon Region, Water Resour. Manag., 29, 2407–2427, 2015.
Liu, J. and Hong, Y.: Spatially explicit assessment of global consumptive water uses in cropland: Green and blue water, J. Hydrol., 384, 187–197, 2010.
Nash, J. E. and Sutcliffe, J. V.: River flow forecasting through conceptual models part I – A discussion of principles, J. Hydrol., 10, 282–290, 1970.
Postel, S. L., Daily, G. C., and Ehrlich, P. R.: Human Appropriation of Renewable Fresh Water, Science, 271, 785–788, 1996.
Ringersmas, J., Batjes, N. H., and Dent, D. L.: Green Water: Definitions and Data for Assessment, Wagening, ISRIC-World Soil Information, 2003.
Rockström, J. and Gordon, L.: Assessment of green water flows to sustain major biomes of the world: Implications for future ecohydrological landscape management, Physics & Chemistry of the Earth Part B Hydrology Oceans & Atmosphere, 26, 843–851, 2001.
Rockström, J., Falkenmark, M., Karlberg, L., Hoff, H., Rost, S., and Gerten, D.: Future water availability for global food production: the potential of green water for increasing resilience to global change, Water Resour. Res., 45, 142–143, 2009.
Saxton, K. E. and Rawls, W. J.: Soil Water Characteristic Estimates by Texture and Organic Matter for Hydrologic Solutions, Soil Sci. Soc. Am. J., 70, 1569–1578, 2006.
Schuol, J., Abbaspour, K. C., Srinivasan, R., and Yang, H.: Estimation of freshwater availability in the West African sub-continent using the SWAT hydrologic model, J. Hydrol., 352, 30–49, https://doi.org/10.1016/j.jhydrol.2007.12.025, 2008a.
Schuol, J., Abbaspour, K. C., Yang, H., Srinivasan, R., and Zehnder, A. J. B.: Modeling blue and green water availability in Africa, Water Resour. Res., 44, 212–221, 2008b.
Shikiomanov, I. A.: Comprehensive Assessment of the Freshwater Resources of the World: Assessment of the Water Resources and Water Availability in the World, Stockholm, Sweden, World Meteorological Organization, 1997.
Shikiomanov, I. A.: Comprehensive Assessment of World Water Resources, Water Int., 25, 11–32, 2000.
Wang, G., Zhang, J., He, R., and Wang, Y.: Variation and Trends Detection of Precipitation and Temperature in the Upper Reaches of Yellow River, J. Arid Environ., 23, 77–81, 2009.
Wang, Y. J., Yang, S. T., Liu, C. M., Dai, D., Zheng, D. H., and Zeng, H. J.: The analysis on the pattern of eco-water use of vegetation and the availability of green water in Sanmenxia area of Yellow River, Geogr. Res., 10, 503–510, 2009.
Winchell, M., Srinivasan, R., Di Luzio, M., and Arnold, J. G.: ArcSWAT interface for SWAT2012-User's guide, Blackland Research Center, Texas Agricultural Experiment Station and Grassland, Soil and Water Research Laboratory, USDA Agricultural Research Service, Temple, Tex, 2013.
Xu, Z., Wang, G., Deng, J., Bao, W., Wu, C., Ren, L., Liu, Z., Liu, B., Xu, W., Yang, Y., Yang, J., Li, Z., Li, H., Li, F., Cheng, J., Chen, X., Zheng, B., Hu, T., Yao, W., Mei, Y., Xie, Z., and Cai, S.: Hydrological Model, Beijing, Science Press, 2009 (in Chinese).
Yang, J., Reichert, P., Abbaspour, K. C., Xia, J., and Yang, H.: Comparing uncertainty analysis techniques for a SWAT application to the Chaohe Basin in China, J. Hydrol., 358, 1–23, https://doi.org/10.1016/j.jhydrol.2008.05.012, 2008.
Zuo, D., Xu, Z., Peng, D., Song, J., Cheng, L., Wei, S., Abbaspour, K. C., and Yang, H.: Simulating spatiotemporal variability of blue and green water resources availability with uncertainty analysis, Hydrol. Process., 29, 1942–1955, 2015.
Zuo, D., Xu, Z., Yao, W., Jin, S., Xiao, P., and Ran, D.: Assessing the effects of changes in land use and climate on runoff and sediment yields from a watershed in the Loess Plateau of China, 544, 238–250, https://doi.org/10.1016/j.scitotenv.2015.11.060, 2015.