the Creative Commons Attribution 4.0 License.
the Creative Commons Attribution 4.0 License.
 | 05 Jun 2018
Analysis of vegetation condition and its relationship with meteorological variables in the Yarlung Zangbo River Basin of China
Xianming Han
Depeng Zuo
Zongxue Xu
Siyang Cai
Xiaoxi Gao
The Yarlung Zangbo River Basin is located in the southwest border of China, which is of great significance to the socioeconomic development and ecological environment of Southwest China. Normalized Difference Vegetation Index (NDVI) is an important index for investigating the change of vegetation cover, which is widely used as the representation value of vegetation cover. In this study, the NDVI is adopted to explore the vegetation condition in the Yarlung Zangbo River Basin during the recent 17 years, and the relationship between NDVI and meteorological variables has also been discussed. The results show that the annual maximum value of NDVI usually appears from July to September, in which August occupies a large proportion. The minimum value of NDVI appears from January to March, in which February takes up most of the percentage. The higher values of NDVI are generally located in the lower elevation area. When the altitude is higher than 3250 m, NDVI began to decline gradually, and the NDVI became gradual stabilization as the elevation is up to 6000 m. The correlation coefficient between NDVI and precipitation in the Yarlung Zangbo River Basin is greater than that with temperature. The Hurst index of the whole basin is 0.51, indicating that the NDVI of the Yarlung Zangbo River Basin shows a weak sustainability.
- Article
(1837 KB) - Full-text XML
- BibTeX
- EndNote


As an important natural resource, vegetation is an indispensable part of the living environment of mankind. Vegetation coverage is closely related with meteorological factors. By means of the transfer of water vapor, climate change is adapted by vegetation and characterized to some extent. At the same time, the global water cycle, biochemical cycle and energy balance are affected by vegetation, which have had a profound impact on ecosystem changes. Meteorology and hydrology are connected by vegetation as well. Vegetation index plays an important role in evaluating vegetation status information such as vegetation coverage, growth vigor and biomass. Normalized Difference Vegetation Index (NDVI) is an indicator of vegetation growth status and vegetation spatial density (Nouri et al., 2017), which can well characterize the dynamic changes of vegetation. NDVI is widely used in the fields of meteorology and hydrology. Many studies have explored the relationship between NDVI and meteorological elements in different regions (Chen et al., 2016; Guo et al., 2017; Karkauskaite et al., 2017; Lumbierres et al., 2017; Riihimäki et al., 2017). Bing et al. (2014) found that the vegetation grown has been positively influenced by the rainfall and precipitation both in moving tracks of gravity center and time-lag effect especially for the growing season. The NDVI lower areas was mainly located in the lower altitude regions (Yu et al., 2017).
As the largest outflowing river in southwest China, the Yarlung Zangbo River Basin is located in the hinterland of the Qinghai-Tibet Plateau. Its elevation is very large, its vegetation and ecological environment are very fragile and is an important geographical barrier in China. Therefore, the stations in the Yarlung Zangbo River Basin are sparse, so the remote sensing is particularly important for the study. Salameh et al. (2017) analyzed the change of surface water storage of the Ganges-Brahmaputra river basin over the period of 1993–2007 through remote sensing, and found that the dataset of SWS is valuable for hydrological and climate modeling studies. Cai et al. (2017) build a model of TRMM (tropical rainfall measuring mission) precipitation spatial-temporal downscaling for higher temporal-spatial resolution rainfall data production in the data scarce Yalung Zangbo River basin. Yang et al. (2011) found that there is a significant positive correlation between NDVI and precipitation in the Yarlung Zangbo River Basin.
The analysis of vegetation condition and its relationship with meteorological variables in the Yarlung Zangbo River Basin of China is of great significance to the development of water energy and the protection of nature in the trans-boundary rivers (Li et al., 2015; Lv et al., 2014; Peng et al., 2014; Zhang et al., 2015). At the same time, the research on vegetation status of the Yarlung Zangbo River Basin also helps to further protect the ecology of the study area. However, there is not a comprehensive and detailed assessment of the spatial and temporal changes of vegetation in the Yarlung Zangbo River basin during the past 17 years. The aim of this paper is to discuss this issue. The main objectives of this study are to: (1) make a thorough inquiry about vegetation condition changed with temporal and spatial variation; (2) discuss the trend of vegetation change in the future Yarlung Zangbo River Basin; (3) quantify the effect of relationships with meteorological variables in the Yarlung Zangbo River Basin.
2.1 Study area
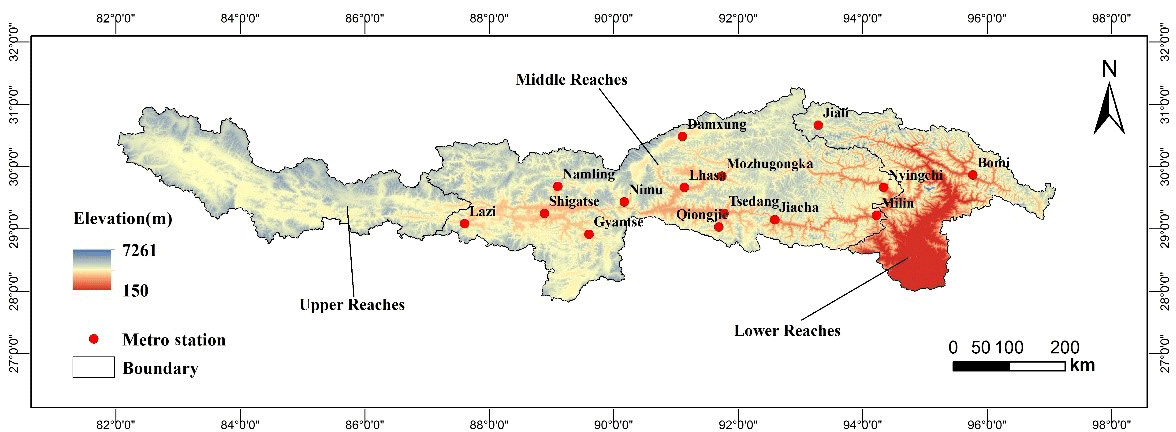
The Yarlung Zangbo River Basin (Guo et al., 2017), extending from longitude 82∘0′ to 97∘1′ E and latitude 27∘8′ to 31∘2′ N, is located in the southern part of Tibet Autonomous Region, China (Fig. 1). The basin originates from the Gyimah Yangzon Glacier in the north of the Himalayas, known as the Maquan River. Most of the watershed is above 3000 m in altitude. The basin consists of arid areas, semi-dry and semi-humid regions and humid areas, from the Gyimah Yangzon Glacier in the upper stream to the valley in the downstream. The basin is long and narrow in the east-west direction, short in the north-south direction, whose south is the Himalayas and north is the Gangdise Mountains and the Nyainqentanglha Mountains. A big bend is located in the downstream area (Huang et al., 2013). The average annual precipitation in the basin is from 300 to 500 mm, which is very different in spatial distribution and uneven during the year. Hydrological and meteorological stations are mainly located in the midstream and downstream, whose distribution is inhomogeneous, so the basin is a lack of data area.

2.2 Data description
The quality-controlled NDVI remote sensing product (MOD13A3) is selected in this study, obtained from the observation of MODIS (Moderate Resolution Image Spectroradiometer) data provided by NASA, spanning 17 years (February 2000 to December 2016). MOD13A3 is the third-level product, based on the secondary product, corrected the edge distortion (Bowtie effect) produced by the sensor imaging process. The spatial resolution of the product is 1 km × 1 km while the time resolution is monthly. The larger the value, the better the vegetation coverage. The data was processed into GEO TIFF format by MRT software and processed by ArcGIS projection splicing. using maximal synthesis method. The DEM (Digital Elevation Model) of the Basin is provided by SRTM (Shuttle Radar Topography Mission), and the projection is longitude and latitude one, which is transferred to ALBERS projection by ArcGIS. The spatial resolution of the data DEM is 90 m. The meteorological data used to calculate the relationship between meteorological elements and NDVI in this paper include monthly precipitation and average temperature, both from Climatic Data Center, National Meteorological Information Center, China Meteorological Administration (http://data.cma.cn/).
Table 1Persistence of monthly NDVI in the Yarlung Zangbo River Basin.
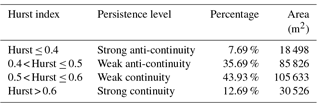
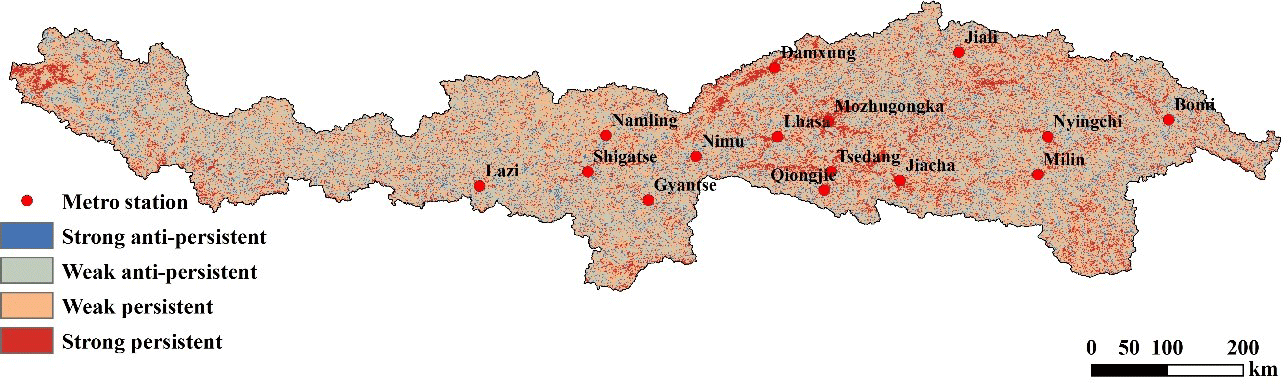
Figure 5The spatial distribution of Hurst index of monthly NDVI in the Yarlung Zangbo River Basin.
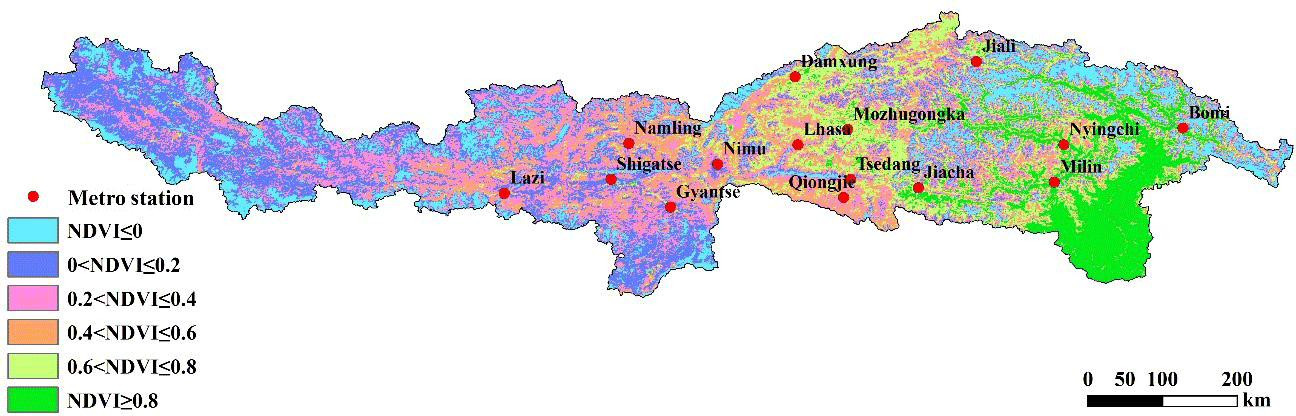
Figure 6Spatial distribution of NDVI during the growing season of 2002 in the Yarlung Zangbo River Basin.
3.1 Correlation analysis
Partial correlation coefficient (Linn et al., 1969) is a research method adopted when examining the correlation between multivariate variables, a measure of the direct linear correlation between two variables under the control of other variables. The definition of the first-order partial correlation coefficient can be estimated as:
where r12−3 is the relationship between the first variable and the second variable in the case of the third variable; r12 is the correlation between the first variable and the second; r13 is the correlation between the first variable and the third variable; r23 is the correlation between the second variable and the third variable; the closer r12−3 to 1, the higher the partial correlation coefficient.
3.2 Trend analysis
The Hurst exponent (Feng et al., 2009) based on R∕S analysis is an effective method to quantitatively describe the long-term dependence of time-series information. It was first proposed by Hurst, a British hydrologist, whose basic principle is:
Given a time series for any positive integer , define the mean sequence:
Accumulated deviation:
Max Difference:
Standard deviation:
If could established in the time series, , the Hurst phenomenon exist, Hurst index (H) can be obtained in the fitted log-log plot (lnτ, lnR∕S) by the least square method. When 0.5 < H < 1, it indicates that the time series is a continuous sequence, which means the trend of the future is consistent with the past trend, and the closer to 1, the stronger the continuity; When H= 0.5, it shows that the time series is a random sequence, that is, the trend of the future has nothing to do with the past trend; When 0 < H < 0.5, it shows that the time series has the anti-persistence. And the closer H is to 0, the stronger the anti-sustainability.
4.1 Seasonal variation of NDVI
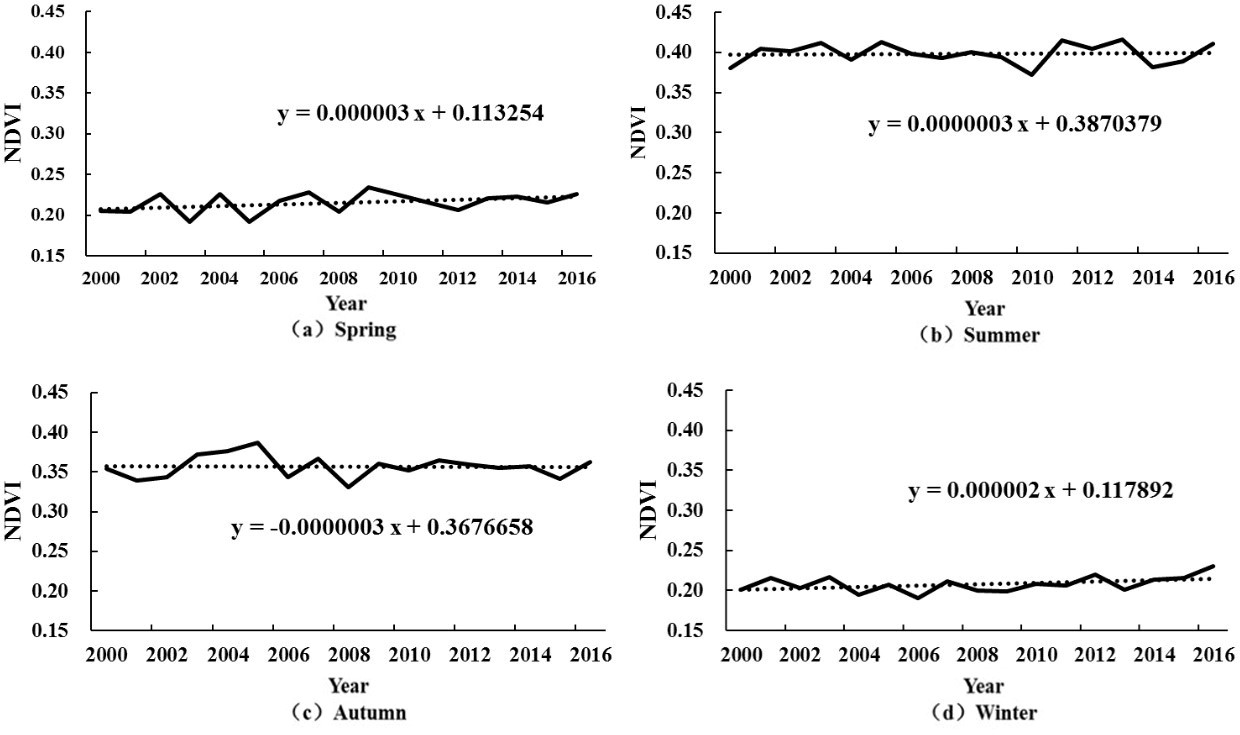
In order to show NDVI in different seasons, seasonal variation of NDVI in the Yarlung Zangbo River Basin is shown in Fig. 2 according to the season of spring (March–May), summer (June–August), autumn (September–November) and winter (December–February).
As can be seen from Fig. 2, the NDVI value reached the maximum in summer, with an average of 0.399, while the minimum occurred in winter, with an average of 0.208. In summer, it reached a maximum of 0.416 in 2013 and reached a minimum of 0.372 in 2010. Followed by the autumn, with an average NDVI of 0.357. The NDVI showed a slow upward trend between 2000 and 2005, reaching a maximum of 0.387 in 2005 and then fluctuating down to reach a minimum of 0.330 in 2008, NDVI value remained at about 0.350 after 2009. The NDVI values in spring and winter were relatively small, with an average of about 0.21. The NDVI values in autumn showed a downward trend, which was −0.0003 %/10a. NDVI values in spring, summer and winter increased with 0.003 %/10a, 0.0003 %/10a and 0.002 %/10a, respectively.
4.2 Inner-annual variation of average NDVI
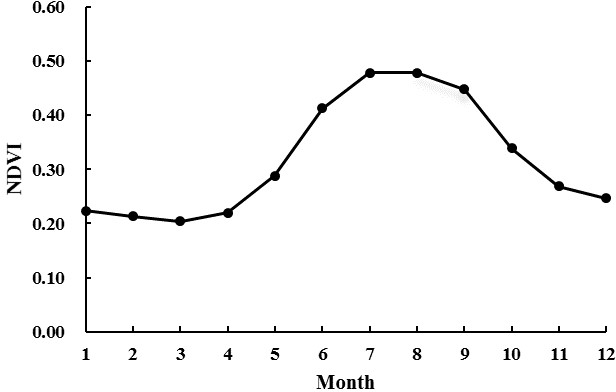
To reveal the law of inner-annual variation of average NDVI, The NDVI values during the study period (2000–2016) were transformed to 12 months. It is clear that NDVI values change greatly with time (Fig. 3).
From Fig. 3, the monthly NDVI value increased first and then decreased with the change of the month. From January to March, the NDVI value basically maintains at around 0.215 and reaches the minimum value of 0.205 in March, then steadily increased until reaching its maximum in July. Although the NDVI values dropped in August and September, they still maintained a relatively large NDVI value of 0.479 and 0.449 respectively. After September, the NDVI value declined more obviously. The average annual NDVI was 0.320.
4.3 Monthly variation of NDVI
Before further trend analysis, the relationship of NDVI in a long time series should be researched. The statistical analysis of NDVI values in monthly and annual scale during the study period (2000–2016) in the Yarlung Zangbo River Basin was carried out. The results are shown in Fig. 4.
As shown in Fig. 4, NDVI generally shows an upward trend, with an increase rate of 0.002 %/10a (p < 0.001), indicating that the vegetation coverage in the Yarlung Zangbo River Basin has been slowly improving over the past 16 years. The maximum annual NDVI occurred from July to September, of which more appeared in August. The minimum appeared in January to March, of which more occurred in February. From 2000 to 2005, the overall trend from 2010 to 2013 showed an upward trend. From 2006 to 2009, the trend from 2014 to 2015 showed a downward trend.
4.4 The spatial distribution of Hurst index of monthly NDVI
The above analysis shows that the NDVI changes in the Yarlung Zangbo River Basin have obvious periodicity. Therefore, it is necessary to study the persistent of the NDVI changes in the Yarlung Zangbo River Basin. The Hurst index is calculated by the monthly grid point of NDVI. The spatial distribution is shown in Fig. 5, and the statistical results are shown in Table 1.
Figure 5 illustrating that the distribution of Hurst index has some spatial differences. There is a strong continuity in Lhasa River basin and the upper reaches of the basin. The Hurst index of the whole basin is 0.51, which shows a weak persistence in the Yarlung Zangbo River Basin. As shown in Table 1, the ratio of weak persistence is the largest, reaching 43.93 %, and the drainage area is 105 633 km2. The second is weak anti-persistence, with an area of 85 826 km2 accounting for 35.69 %. The strong persistent area and strong anti-persistent area account for the smallest proportion, accounting for 12.69 and 7.69 % respectively.
4.5 NDVI spatial distribution characteristics
From 2000 to 2016, the average NDVI of the growing season in the Yarlung Zangbo River was 0.407, and the NDVI in the growing season of 2002 was 0.407. Therefore, the spatial distribution of NDVI in the growing season was selected as a typical year, as shown in Fig. 6.
From Fig. 6, the NDVI values downstream NDVI values of Millin and Bomi stations are higher than 0.6, and the NDVI values in the river basin upstream of Lazi during the growing season are still less than 0.4, indicating that the NDVI high value areas are mainly distributed in the middle and lower reaches of the Yarlung Zangbo River Basin, especially in the lower reaches. However, due to the high altitude in the upper reaches, snow and ice don't thaw and the rare vegetation grows through a whole year in many areas.
4.6 Distribution of NDVI along the elevation
To obtain the distribution of NDVI along elevation, the relationship between the elevation of the Yarlung Zangbo River Basin and the NDVI value was statistically analyzed with an index of 250 m. The result is shown in Fig.7.
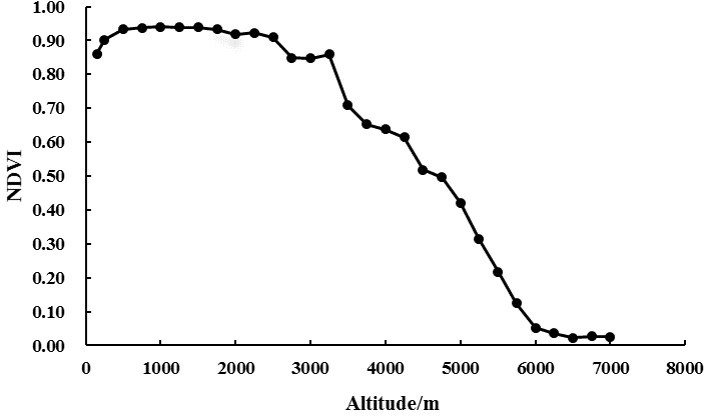
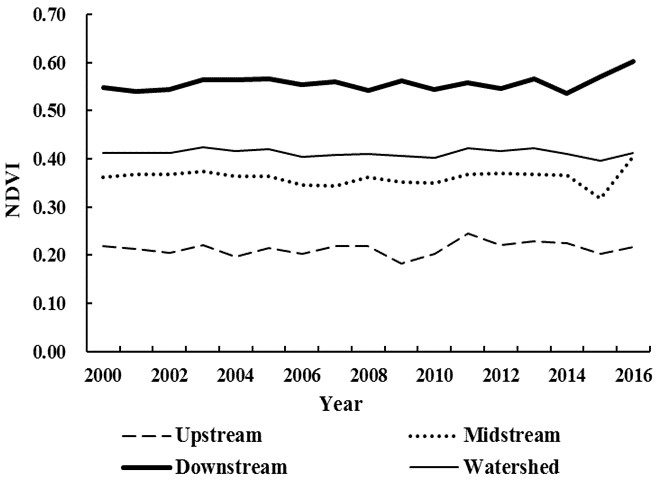
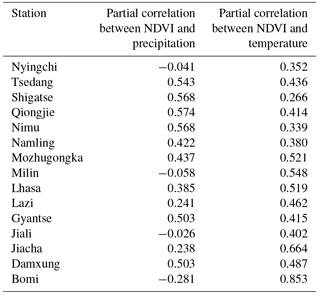
Table 2Correlation analysis of NDVI and meteorological factors in the Yarlung Zangbo River Basin.
As can be seen from Fig. 7, a distinct feature is shown that higher the altitude, smaller the NDVI value. The middle and low altitude areas are the high value areas of NDVI. At the altitude of 1000–2500 m, the NDVI values are basically the same, about 0.913. Above 2500 m, the NDVI value began to decline, showing a sharp decline after more than 3000 m. When the altitude is above 6000 m, the NDVI value is only about 0.029, and the NDVI values remain unchanged as the altitude increases.
4.7 Distribution of NDVI in sub-basins
Through consultation with experts and access to the relevant papers (Chen et al., 2015), the Yarlung Zangbo River Basin can be divided into upper, middle and lower reaches. The upstream is the wide valley area above the Lazi prefecture in Shigatse. The midstream is valley while the downstream is located in the Pai town of Milin district. The mean NDVI values in sub-basins are calculated respectively. The results are shown in Fig. 8.
From Fig. 8, the annual value of NDVI shows the order of lower, middle and upper reaches. It is obvious that this is related to the elevation difference of the sub-basins. Vegetation is rarely grown above the snow line and at the edge of the valley. Due to uneven terrain and elevation distribution, the vegetation distribution in the Yarlung Zangbo River Basin is uneven, the average value of NDVI in the Yarlung Zangbo River Basin is 0.41. The average NDVI values in the upper, middle and lower reaches are 0.21, 0.36 and 0.55 respectively.
4.8 The relationship between meteorological elements and NDVI
In order to explore the relationship between regional NDVI and meteorological elements in the study area of the Yarlung Zangbo River Basin, this paper uses the ArcGIS to extract the average NDVI of the region centered around each meteorological station with a radius of 1.5 km. The trend of data of NDVI, temperature and precipitation were removed, then the partial correlation coefficients between NDVI and temperature and precipitation were calculated respectively. The results are shown in Table 2.
Table 2 shows that the correlation between NDVI and air temperature is about 0.465 (0.266–0.853), while the partial correlation coefficient between NDVI and precipitation is 0.281 (−0.281–0.574), which has passed the test of 5 % significant level. Therefore, the partial correlation coefficient between NDVI and temperature in the Yarlung Zangbo River Basin is greater than the correlation coefficient with precipitation, indicating that vegetation growth in the Yarlung Zangbo River Basin is more affected by temperature than precipitation.
This study investigated the distribution of vegetation in the Yarlung Zangbo River Basin in the Tibet Autonomous Region of China during the period from 2000 to 2016. The spatial and temporal distribution pattern of vegetation was analyzed by Hurst exponent method using the MODIS remote sensing data and monthly precipitation and temperature data. The correlation with NDVI between precipitation and temperature was analyzed using partial correlation coefficient method. Major conclusions can be summarized as follows:
-
the NDVI value decreases with increasing altitude. At the altitude of 1000–2500 and 6000–7000 m, the NDVI values are basically remain unchanged. Reasons may be further discussed in combination with botany.
-
The annual value of NDVI shows the order of downstream, whole basin, middle reaches and upstream, with the average NDVI of 0.41 in the Yarlung Zangbo River Basin and 0.21, 0.36 and 0.55 of the upper and lower reaches respectively. It can be inferred that this is related to the characteristics of underlying surface in sub-basins
-
The correlation analysis between vegetation and meteorological elements in the Yarlung Zangbo River Basin shows vegetation growth is more affected by temperature than precipitation.
-
The mean Hurst index of the whole basin is 0.51, which shows that the NDVI in the Yarlung Zangbo River Valley shows a weak sustainability. The ratio of weak persistent to weak anti-persistent is the largest.
The results obtained in this study would provide more evidence and useful reference for study about vegetation in the Yarlung Zangbo River Basin.
The raw data required to reproduce these findings are available to download from http://data.cma.cn/ and https://modis.gsfc.nasa.gov/. The processed data required to reproduce these findings cannot be shared at this time as the data also forms part of an ongoing study.
The authors declare that they have no conflict of interest.
This article is part of the special issue “Innovative water resources management – understanding and balancing interactions between humankind and nature”. It is a result of the 8th International Water Resources Management Conference of ICWRS, Beijing, China, 13–15 June 2018.
This study is supported by the Natural Science Foundation of China (Grant
No. 91647202).
Edited by: Dingzhi Peng
Reviewed by: Liqun Sun and one anonymous referee
Cai, M., Lv, Y., Yang, S., and Zhou, Q.: TRMM precipitation downscaling in the data scarce Yarlung Zangbo River Basin, Journal of Beijing Normal University, Natural Science, 1, 111–119, 2017.
Chen, B., Li, H., Cao, X., Shen, W., and Jin, H.: Vegetation Pattern and Spatial Distribution of NDVI in the Yarlung Zangbo River Basin of China, Journal of Desert Research, 1, 120–128, 2015.
Chen, B., Li, H., Cao, X., and Tang, H.: Dynamic Changes in Vegetation Coverage in the Yarlung Zangbo River Basin Based on SPOT – VGT NDVI, Mountain Research, 2, 249–256, 2016.
Feng, X., Luo, L., and Feng, Z.: Hurst index experiment on precipitation change trend and mutation of China in the near 50 years, Arid Land Geography, 6, 859–866, 2009.
Guo, B., Zhou, Y., Wang, S., and Tao, H.: The relationship between normalized difference vegetation index (NDVI) and climate factors in the semiarid region: A case study in Yalu Tsangpo River basin of Qinghai-Tibet Plateau, J. Mt. Sci., 11, 926–940, https://doi.org/10.1007/s11629-013-2902-3, 2014.
Guo, B., Jiang, L., Ge, D., and Shang, M.: Driving Mechanism of Vegetation Coverage Change in the Yarlung Zangbo River Basin under the Stress of Global Warming, Journal of Tropical and Subtropical Botany, 3, 209–217, 2017.
Guo, J., Hu, Y., Xiong, Z., Yan, X., Li, C., and Bu, R.: Variations in Growing-Season NDVI and Its Response to Permafrost Degradation in Northeast China, Sustainability, 9, 551, https://doi.org/10.3390/su9040551, 2017.
Huang, W., Wang, G., Wang, A., Cao, S., and Cao, K.: The morphology of the Yalung Zangbo River in the Great Canyon Region and its implications, Geological Bulletin of China, 1, 130–140, 2013.
Karkauskaite, P., Tagesson, T., and Fensholt, R.: Evaluation of the Plant Phenology Index (PPI), NDVI and EVI for Start-of-Season Trend Analysis of the Northern Hemisphere Boreal Zone, Remote Sens., 9, 485, https://doi.org/10.3390/rs9050485, 2017.
Li, H., Li, Y., Shen, W., Li, Y., Lin, J., Lu, X., Xu, X., and Jiang, J.: Elevation-Dependent Vegetation Greening of the Yarlung Zangbo River Basin in the Southern Tibetan Plateau, 1999–2013, Remote Sens., 7, 16672–16687, https://doi.org/10.3390/rs71215844, 2015.
Linn, R. L. and Werts, C. E.: Assumptions in making causal inferences from part correlations, partial correlations, and partial regression coefficients, Psychol. Bull., 72, 307–310, https://doi.org/10.1037/h0028107, 1969.
Lumbierres, M., Méndez, P., Bustamante, J., Soriguer, R., and Santamaría, L: Modeling Biomass Production in Seasonal Wetlands Using MODIS NDVI Land Surface Phenology, Remote Sens., 9, 392, https://doi.org/10.3390/rs9040392, 2017.
Lv, Y., Dong, G., Yang, S., Zhou, Q., and Cai, M.: Spatio-Temporal Variation in NDVI in the Yarlung Zangbo River Basin and Its Relationship with Precipitation and Elevation, Resources Science, 3, 603–611, 2014.
Nouri, H., Anderson, S., Sutton, P., Beecham, S., Nagler, P., Jarchow, C., and Roberts, D.: NDVI, scale invariance and the modifiable areal unit problem: An assessment of vegetation in the Adelaide Parklands, Sci. Total Environ., 584–585, 11–18, https://doi.org/10.1016/j.scitotenv.2017.01.130, 2017.
Peng, D. and Du, Y.: Comparative analysis of several Lhasa River basin flood forecast models in Yarlung Zangbo River, International Conference on Bioinformatics and Biomedical Engineering, 1–4, 18–20 June 2010, Chengdu, China, 2010.
Riihimäki, H., Heiskanen, J., and Luoto, M.: The effect of topography on arctic-alpine aboveground biomass and NDVI patterns, Int. J. Appl. Earth Obs., 56, 44–53, https://doi.org/10.1016/j.jag.2016.11.005, 2017.
Salameh, E., Frappart, F., Papa, F., Güntner, A., Venugopal, V., Getirana, A., Prigent, C., Aires, F., Labat, D., and Laignel, B.: Fifteen Years (1993–2007) of Surface Freshwater Storage Variability in the Ganges-Brahmaputra River Basin Using Multi-Satellite Observations, Water, 9, 15–35, https://doi.org/10.3390/w9040245, 2017.
Yang, L., Cangjue, Z., Ji, T., Yang, M., Zhou, S., Li, J., and Li, L.: A Primary Investigation of Bird Resource in Drainage Area of Yarlung Zangbo River and its Two Branches from Tibet, China, Sichuan Journal of Zoology, 3, 475–480, 2011.
Yu, L., Yao, K., Liu, H., Pu, S., and Jiang, Q.: NDVI variation at different elevation and its relationship with climatic factors, Computing Techniques for Geophysical and Geochemical Exploration, 2, 296–300, 2017.
Zhang, J. and Ren, Z.: Responses of Vegetation Changes in Growing Season to Precipitation in Yarlung Zangbo River Basin, Research of Soil and Water Conservation, 2, 209–212, 2015.