Articles | Volume 378
https://doi.org/10.5194/piahs-378-23-2018
Post-conference publication
 | 
29 May 2018
Post-conference publication |  | 29 May 2018

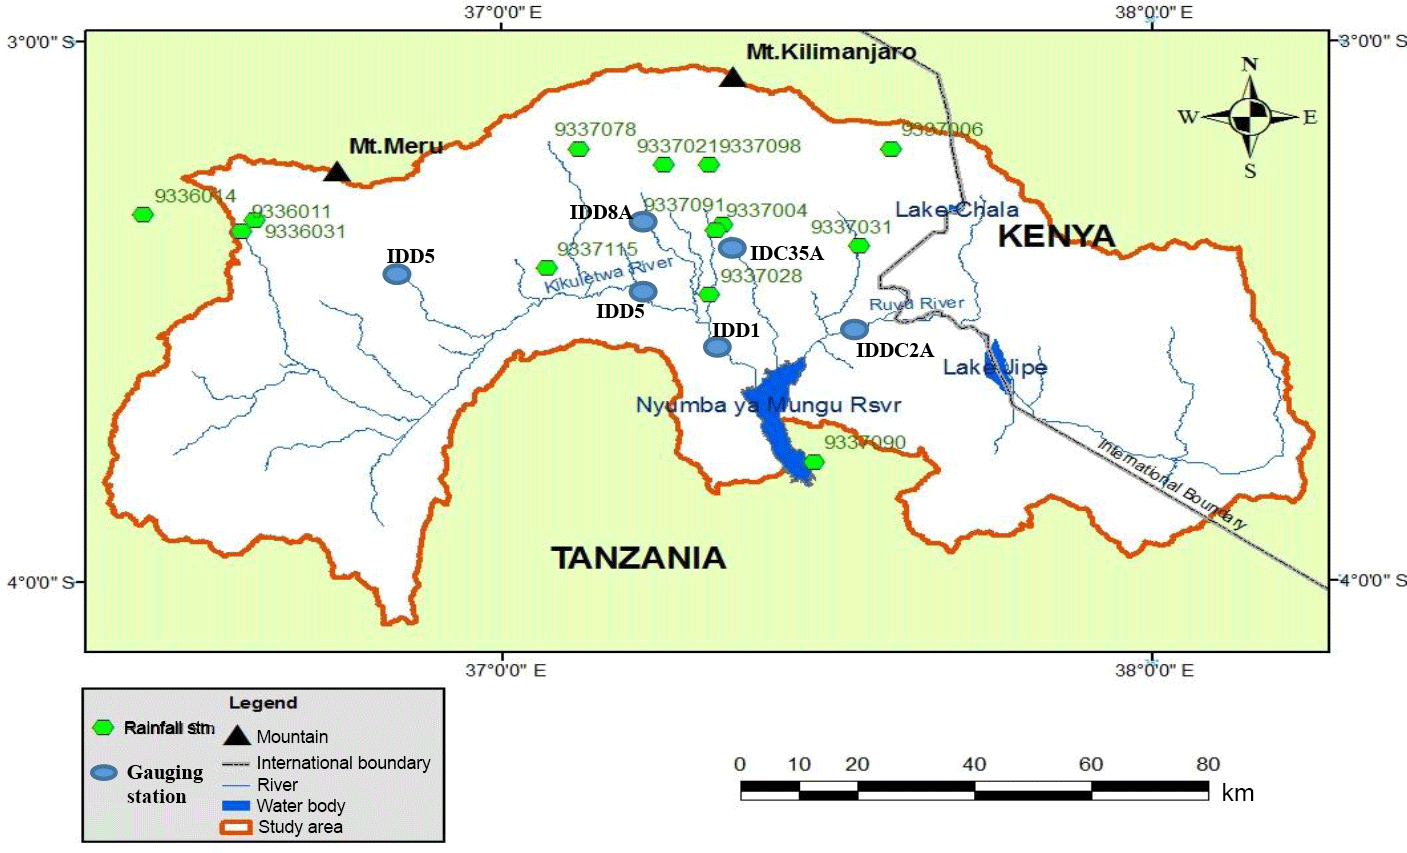
Assessment of impacts of climate change on surface water availability using coupled SWAT and WEAP models: case of upper Pangani River Basin, Tanzania

Peter Kishiwa, Joel Nobert, Victor Kongo, and Preksedis Ndomba
Abstract

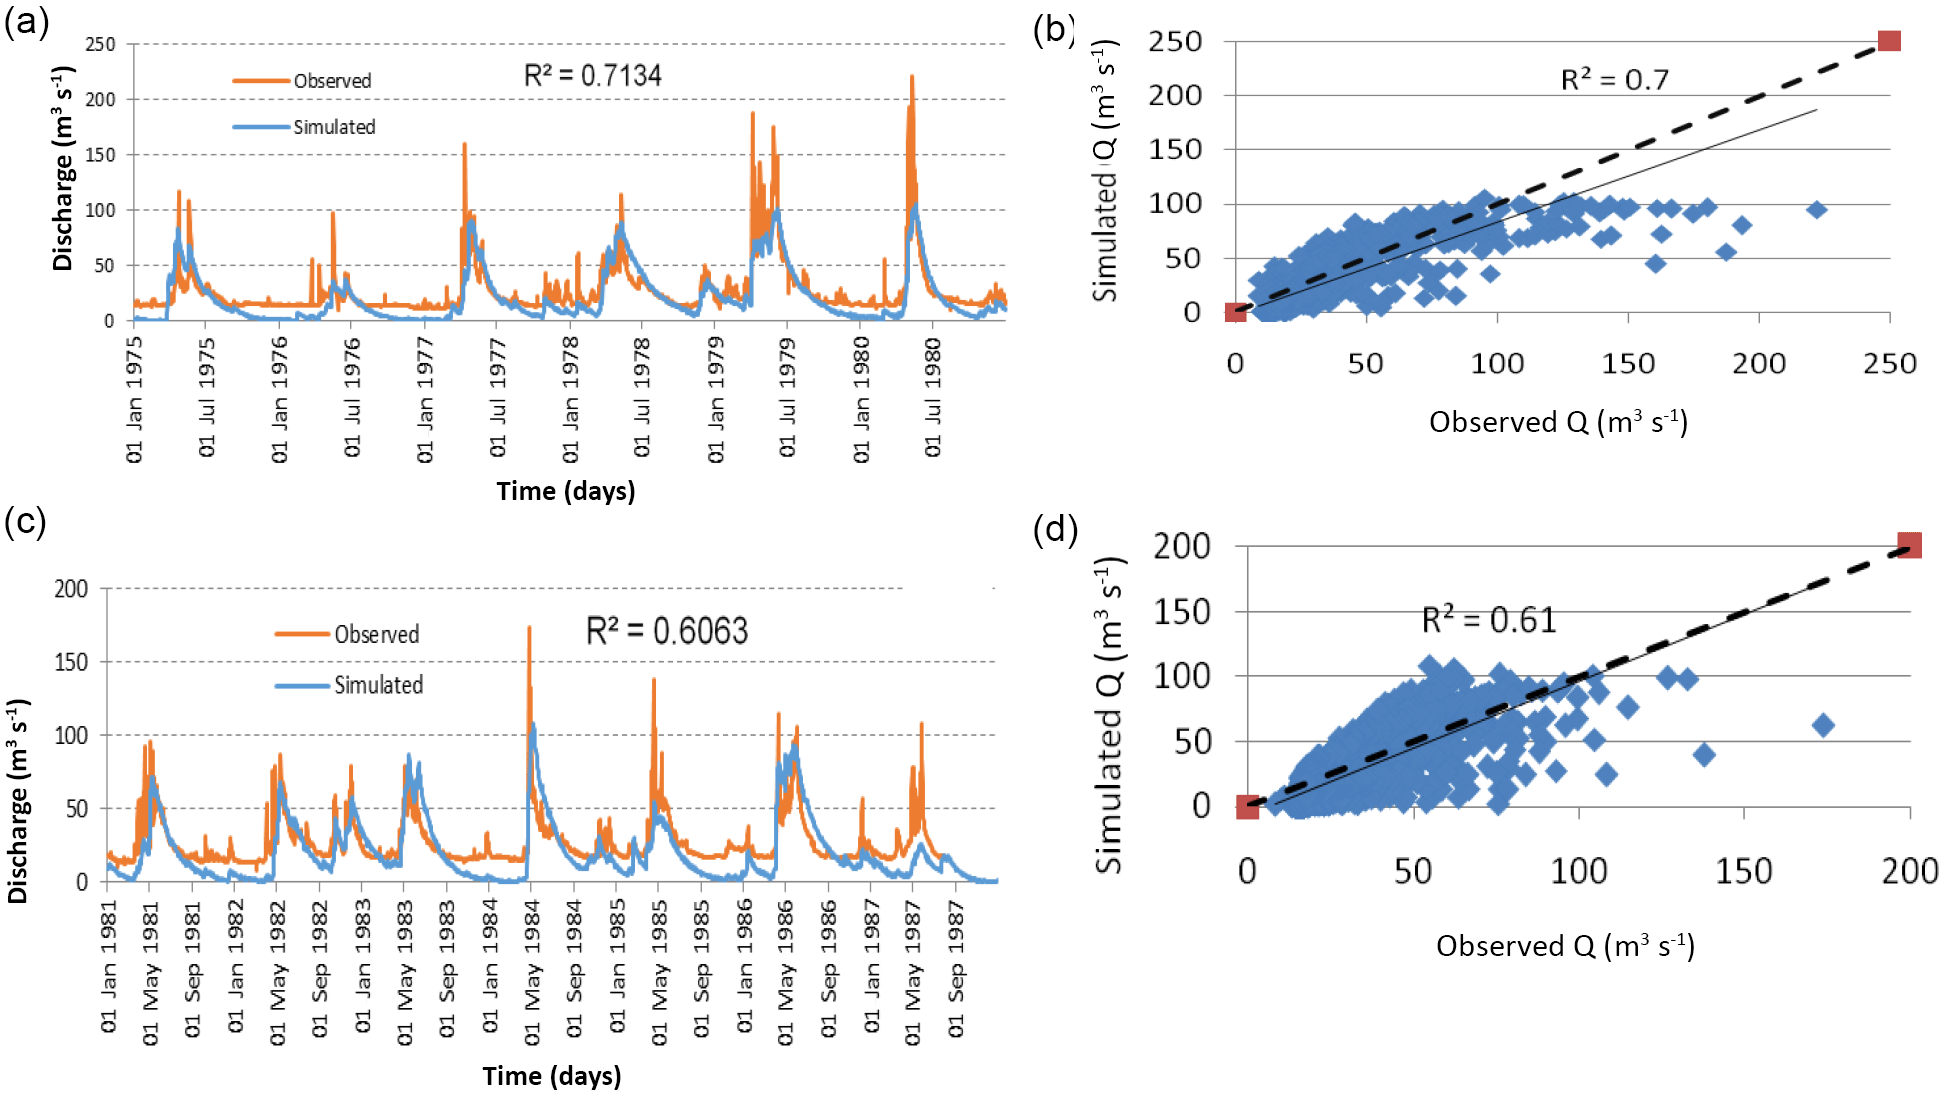
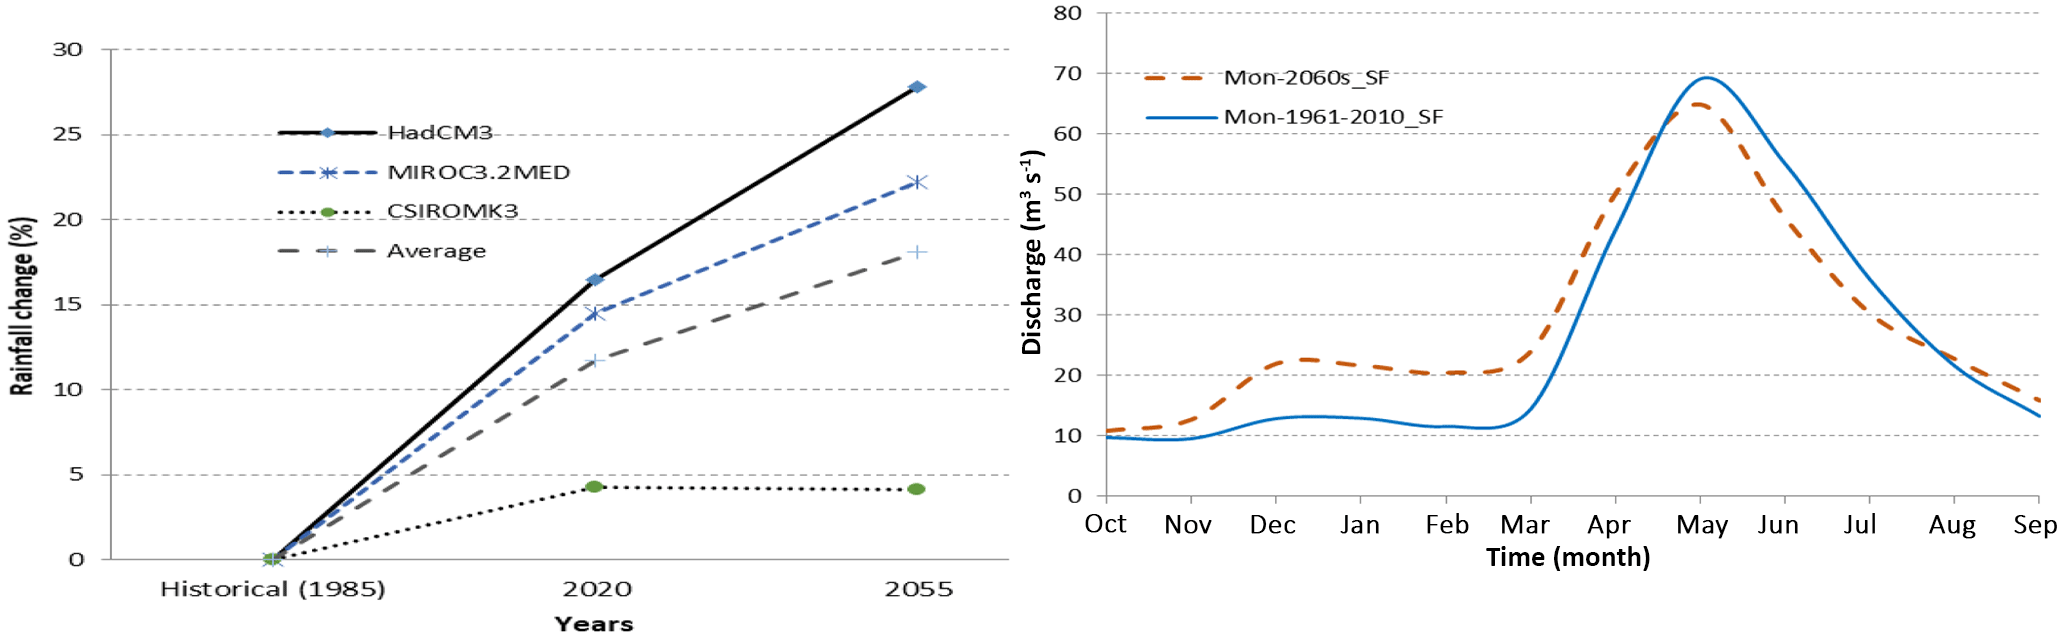
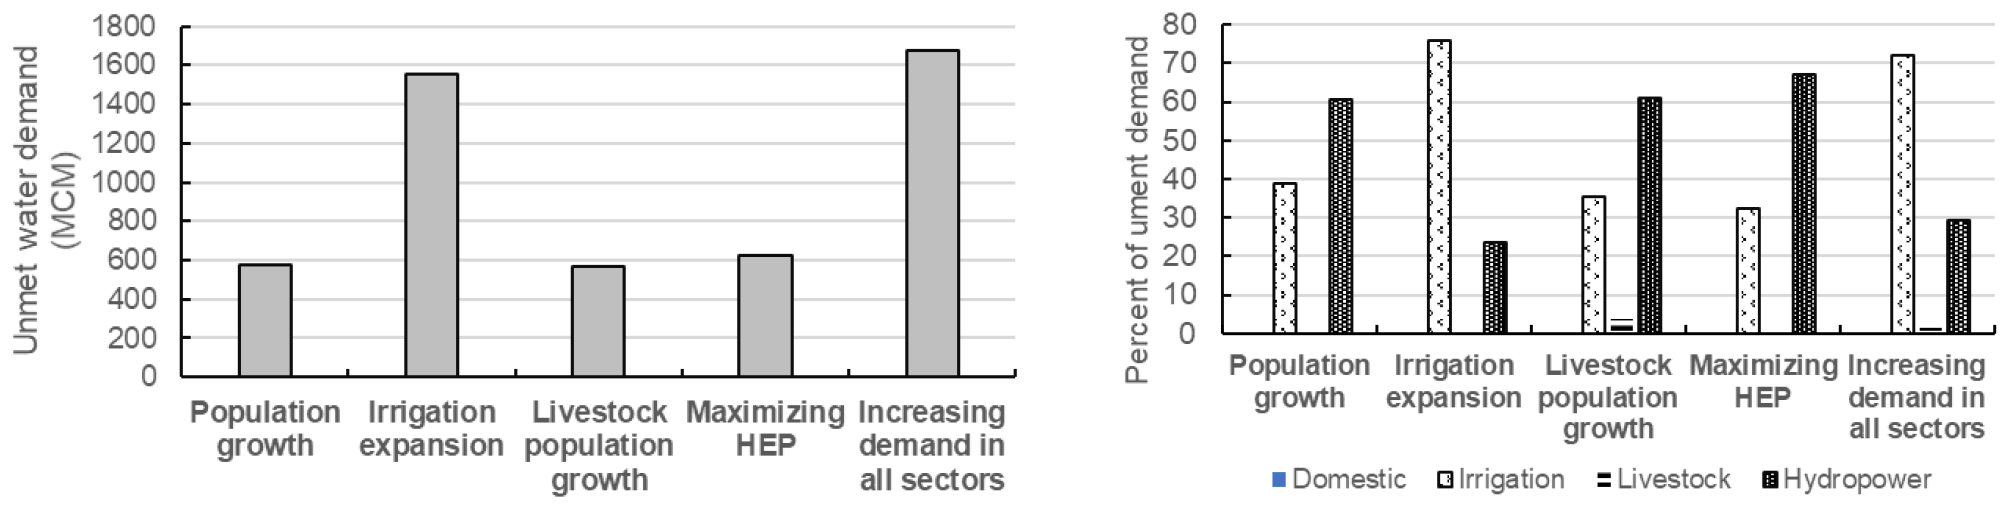
This study was designed to investigate the dynamics of current and future surface water availability for different water users in the upper Pangani River Basin under changing climate. A multi-tier modeling technique was used in the study, by coupling the Soil and Water Assessment Tool (SWAT) and Water Evaluation And Planning (WEAP) models, to simulate streamflows under climate change and assess scenarios of future water availability to different socio-economic activities by year 2060. Six common Global Circulation Models (GCMs) from WCRP-CMIP3 with emissions Scenario A2 were selected. These are HadCM3, HadGEM1, ECHAM5, MIROC3.2MED, GFDLCM2.1 and CSIROMK3. They were downscaled by using LARS-WG to station scale. The SWAT model was calibrated with observed data and utilized the LARS-WG outputs to generate future streamflows before being used as input to WEAP model to assess future water availability to different socio-economic activities. GCMs results show future rainfall increase in upper Pangani River Basin between 16–18 % in 2050s relative to 1980–1999 periods. Temperature is projected to increase by an average of 2 C in 2050s, relative to baseline period. Long-term mean streamflows is expected to increase by approximately 10 %. However, future peak flows are estimated to be lower than the prevailing average peak flows. Nevertheless, the overall annual water demand in Pangani basin will increase from 1879.73 Mm3 at present (2011) to 3249.69 Mm3 in the future (2060s), resulting to unmet demand of 1673.8 Mm3 (51.5 %). The impact of future shortage will be more severe in irrigation where 71.12 % of its future demand will be unmet. Future water demands of Hydropower and Livestock will be unmet by 27.47 and 1.41 % respectively. However, future domestic water use will have no shortage. This calls for planning of current and future surface water use in the upper Pangani River Basin.

https://www.proc-iahs.net/378/23/2018/piahs-378-23-2018-f01

Figure 1Location of Ruvu and Kikuletwa catchments (upper Pangani).

Download

1 Introduction

Surface water is a natural resource occurring on the earth's surface and plays an essential role in sustaining mankind and other forms of life (Babel et al., 2005). Decisions regarding water allocations are increasingly important as river basins are further developed and managed to meet social, economic, and environmental needs (Grabow and McCornick, 2007). The ever-increasing anthropogenic activities as a result of growing population are putting immense pressure on available surface water resources (Gao et al., 2017). Climate change presents a significant additional challenge to the achievement of sustainable water management around the globe (Ostefeld et al., 2012). Climate change will likely affect the surface water resources due to the expected changes in precipitation and evapotranspiration and the spatio-temporal distribution of these essential water balance components (Kumar et al., 2017).

A rise in air temperature leads to higher evapotranspiration rates of which further increase the demand for irrigation water (Wang et al., 2012). Such change in climate influences the partitioning of rainfall leading to alteration of water balance. Streamflows in upper Pangani River Basin has continued to decrease from several hundreds to 43.37 m3 s−1 as received at the outlet of catchment (PBWO/IUCN, 2009) i.e. the Nyumba ya Mungu Reservoir (cf. Fig. 1). This decreasing trend is predicted to continue if no proper measures are taken (Funk et al., 2005).

Previous efforts at assessing impacts of climate change on water resources in the upper Pangani Basin has often focused mainly on using outputs from General Circulation Models (GCMs) as input to hydrological models to assess impact of climate change on water resources. In this study, we have taken a step further by using a model-coupling approach through taking advantage of SWAT's capability in representing hydrological processes and WEAP's strength in water allocation using scenarios. Hydrological models, like the SWAT model, are designed to provide an understanding of response of catchments to hydrological events while water resource planning models e.g WEAP are primarily customized for water allocation within a water management context e.g., supply and demand decisions (Yates et al., 2009). Thus, the coupling of SWAT and WEAP models provides a useful platform for analyzing impacts of climate change on water resources – from both management and planning perspectives. The output of GCM provides insights on future climate but at a coarser resolution. Such coarse spatial scales of GCM's are not useful at catchment and or river basin scales of the order of upper Pangani River Basin, with an area of 12 829 km2. This requires downscaling outputs of GCM's to desired scales of which the Long Ashton Research Station Weather Generator (LARS-WG) approach was used (Semenov et al., 1998) in this study.

The study highlights the potential dynamics of managing water resources in the upper Pangani River Basin in the context of climate change. It also contributes to knowledge and literature on enhancing our understanding of climate change and its potential impacts on surface water in the Basin.

2 Materials and methods

2.1 The study area and data

Kikuletwa and Ruvu catchments (upper Pangani) occupy the area upstream of Nyumba ya Mungu (NyM) reservoir in the Northern part of Pangani River Basin as indicated in Fig. 1. They are located in North-Eastern part of Tanzania and southern part of Kenya, between latitudes and longitudes of 300/410 S and 3638/3820 E respectively. The two catchments form the headwater of the Pangani River. Their drainage starts from the slopes of Mountains of Kilimanjaro and Meru. They drain water from many small streams which eventually forms the two main rivers of Kikuletwa and Ruvu as indicated in Fig. 1. These two rivers finally discharge water into Nyumba ya Mungu reservoir.

The data used for this study includes daily discharge, rainfall data, temperature and climatic data. A total of 13 rainfall stations were used for the analysis. The criteria used for the selection of the rainfall stations were good spatial distribution, small percentage of missing data and concurrent data. Record length for the data varied from station to station, the concurrent period being 1972–1990. The location of rainfall and river gauging stations used in this study is as indicated in Fig. 1.

https://www.proc-iahs.net/378/23/2018/piahs-378-23-2018-f02

Figure 2Calibration (a–b) and validation (c–d) results.

Download

2.2 Climate change scenarios and downscaling

Six common GCMs; HadCM3, HadGEM1, ECHAM5, MIROC3.2MED, GFDLCM2.1 and CSIROMK3 from WCRP-CMIP3 with SRES emission scenario A2 were selected. The GCMs were downscaled using LARS-WG to station scale. In order to run the LARS-WG model and downscale GCM data for future periods, two files were created, one file defines the behavior of the climate in the past and the other is climate change scenario file. The base period of 50 years (1961–2010) was selected to establish the baseline time series of climate data and then calibrated for the common period of 1975–1990. The performance of LARS-WG was validated with observed records from 1981 to 1990 at each weather station. There are a number of systematic biases from model to model in simulating present day climate and therefore, in this study the average of output from the six selected GCMs was used for the analysis.

2.3 Setting hydrological model

Soil and Water Assessment Tool (SWAT) model was used for hydrological modelling. The model was set-up, calibrated and validated before being used for gap filling extending the flow records and simulating impact of climate change. The 1972 to 1974 period was used as warm-up period, the 1975 to 1980 period for calibration and the 1981 to 1987 period for validation. The sensitivity analysis resulted in 12 sensitive SWAT parameters which were then optimized. SWAT's performance assessment was based on guidelines proposed by Moriasi et al. (2007).

2.4 Water demand and allocation analysis

The main competing water uses in the upper Pangani catchment are domestic, irrigation, livestock, and hydropower. The current and future water demands were estimated based on the existing water permits from the water board, population data and potential irrigable areas. WEAP model was used for water allocation modelling based on selected potential future water use scenarios including population growth, expansion of irrigation, maximizing hydro-electric power (HEP), livestock population growth and climate change.

3 Results and discussions

3.1 SWAT model calibration and validation

Discharge data at gauging station 1DD1 in Kikuletwa River (cf. Fig. 1), for the period 1975 to 1980, was used to calibrate the SWAT model while validation was from 1981 to 1987 as indicated in Fig. 2. The SWAT model performed comparatively well during calibration and validation, with an R2 of 0.71 and 0.60 respectively. Also Nash-Sutcliffe (NSE), percent bias (PBIAS), and ratio of the root mean square error to the standard deviation of the measured data (RSR) were 0.62, 22.4 and 0.62, respectively, for the calibrated model. The model did not mimic very well both low and high flows as indicated in both line and scatter plots. The inability of the model to capture baseflows could be as a result of an inherent characteristic of the catchment which is typified by presence of springs which eventually maintain a relatively high level of base flows throughout the year.

3.2 Current and future water availability

The mean outputs of the GCM's indicate that upper Pangani catchment will experience increased rainfall as indicated in Fig. 3. The increase is expected to range from 16 to 18 % and temperature is projected to increase by 2 C in 2060s relative to the base year 2011. Based on the modelling results, the long-term mean streamflows are expected to increase by 10 %.

https://www.proc-iahs.net/378/23/2018/piahs-378-23-2018-f03

Figure 3GCM's delta change and future mean monthly stream flows at IDDC1 in Kikuletwa.

Download

https://www.proc-iahs.net/378/23/2018/piahs-378-23-2018-f04

Figure 4Annual unmet total water demand and corresponding percentages for different sectors.

Download

3.3 Water demand and allocation under selected scenarios

Scenario 1: Impact of population growth. Under this scenario population growth rate used varied from region to region in the range of 1.8–3.2 %. All other sectors were assumed to grow at insignificant rates and therefore their demand for 2060s will be almost equal to the current demand. The sectors that will be highly affected by the impact of population growth will be HEP and Irrigation. HEP demand will be unmet by 350.83 Mm3 (60.6 %) of the future unmet demand. Irrigation demand will be unmet by 224.37 Mm3 (38.75 %) of the future unmet demand. However, the domestic water demand will be fully met under the scenario.

Scenario 2: Impact of irrigation expansion. Under the scenario, the area under irrigation is assumed to expand from the current area under irrigation of 49 143 to 79 849 ha which is the potential irrigable area. The irrigation sector will suffer most under the scenario. It is expected to have water shortage of 1177.01 Mm3 (75.90 %) of the total unmet demand. The other demand which is expected to have significant water shortage under this scenario is HEP with 23.72 % unmet demand (Fig. 3.4). The domestic sector will not be affected by this scenario but livestock sector will experience a little impact of 0.38 % unmet demand.

Scenario 3: Impact of livestock population growth. In this scenario livestock population growth rate of 2.6 % was used to estimate the future population and water demand. It was noted that this scenario has the least impact on the water demand as compared to all other scenarios. Livestock population growth scenario is expected to cause an annual water shortage of 568.43 Mm3. Much of this shortage will be on the HEP demand which will experience a shortage of 345.79 Mm3 (60.83 %) of the total unmet demand under this scenario (Fig. 4).

Scenario 4: Maximizing HEP production. The scenario describes what could be expected if hydropower generation was prioritized to operate at maximum capacity, current turbines discharge is 35 m3 s−1 and the maximum capacity is 42 m3 s−1. This will result to unmet water demand in the catchment of 623.49 Mm3 (29.68 %) of the total demand (Fig. 4). HEP will be most affected with unmet demand of 419.17 Mm3 (67.23 % of total deficit). Irrigation will experience unmet demand of 32.2 % followed by livestock sector (0.6 %).

Scenario 5: Increasing demand for all sectors. The unmet total future demand due to increasing demand of all sectors is estimated to be about 1674 Mm3. The impact of all future demands expansion and climate change is expected to be severe in the irrigation sector with unmet demand of 1206.66 Mm3 which is 72.09 % of total unmet demand. The other sectors which will be affected by the scenario are HEP (26.4 %) and livestock (1.5 % unmet). Domestic water demand will be fully met under the scenario.

4 Conclusions

Model results indicate an increase in future rainfall in the range between 16 to 18 % while temperature is projected to increase by 2 C in 2060s relative to the base year 2011. Long-term mean streamflows is expected to increase by approximately 10 %. However, future peak flows are estimated to be lower than the prevailing average peak flows, while base flows in the dry months between November and February are expected to increase. Nevertheless, the overall annual water demand in Pangani basin will increase from 1879.73 Mm3 at present (2011) to 3249.69 Mm3 in the future (2060s). Therefore, the aggregated effect of climate change together with increase in future water demand will result in an annual unmet demand of 1673.80 Mm3 (51.51 % of future demand) and mostly affecting the Irrigation sector (72.09 % of total unmet demand). This will increase the pressure on water demand due to increased unmet demands especially for irrigation.

Data availability

Data is not publically available at the moment. It was requested for this research purpose under the condition that the raw data should not be shared publically. The custodian of the raw data is the Tanzania Meteorological Agency and the Pangani basin water board.

Competing interests

The authors declare that they have no conflict of interest.

Special issue statement

This article is part of the special issue “Understanding spatio-temporal variability of water resources and the implications for IWRM in semi-arid eastern and southern Africa”. It is a result of the IAHS Scientific Assembly 2017, Port Elizabeth, South Africa, 10–14 July 2017.

Acknowledgements

The authors would like to acknowledge the financial support from Climate Change Impacts on Ecosystem Services and Food Security in Eastern Africa (CHIESA).

Edited by: Webster Gumindog
Reviewed by: Timothy Dube and two anonymous referees

References

Babel, M. S, Gupta, A. D, and Nayak, D. K.: A Model for Optimal Allocation of Water to Competing Demands, Water Resour. Manag., 19, 693–712 2005. 

Funk, C., Senay, G., Asfaw, A., Verdin, J., Rowland, J., Michaelson, J., Eilerts, G., Korecha, D., and Choularton, R.: Recent Drought Tendencies in Ethiopia and Equatorial-Subtropical Eastern Africa, Washington DC, FEWS-NET, 2005. 

Gao, J., Li, F., Gao, H., Zhou, C., and Zhang, X.: The impact of land-use change on water-related ecosystem services: a study of the Guishui River Basin, Beijing, China, J. Clean. Prod., 163, 148–155, 2017. 

Grabow, G. L. and McCornick, P. G.: Planning for Water Allocation and Water Quality Using a Spreadsheet-Based Model, J. Water Res. Plan. Man., 133, 560–564, 2007. 

Kumar, N., Tischbeinb, B, Kuschec, J., Laux, P., Bege, M. K., and Bogardi, J. J.: Impact of climate change on water resources of upper Kharun catchment in Chhattisgarh, India, Journal of Hydrology: Regional Studies, 13, 189–207, 2017. 

Moriasi, D. N., Arnold, J. G., Van Liew, M. W., Bingner, R. L., Harmel, R. D., and Veith, T. L.: Model evaluation guidelines for systematic quantification of accuracy in watershed simulations, T. ASABE, 50, 885–900, 2007. 

Ostfeld, A., Barchiesi, S., Bonte, M., Collier, C., Cross, K., Darch, G., Farrel, T., Smith, M., Vicory, A., Weyand, M., and Wright, J.: Climate impacts on river basin and freshwater ecosystems: some observations on challenges and emerging solutions, J. Water Clim. Change, J. Water Clim. Change, 3, 171–184, https://doi.org/10.2166/wcc.2012.006, 2012. 

PBWO/IUCN: The Pangani River Basin: A Situational Analysis, 2nd Edition, 12, 82 pp., 2009. 

Semenov, M. A., Brooks R. J., Barrow, E. M., and Richardson, C. W.: Comparison of WGEN and LARS-WG Stochastic Weather Generators for Diverse Climates, Climate Research, 10, 95–107, 1998. 

Wang, K., Dickinson, R. E., and Liang, S.: Global atmospheric evaporative demand over land from 1973 to 2008, J. Climatol., 25, 8353–8361, https://doi.org/10.1175/JCLI-D-11-00492.1, 2012. 

Yates, D., Purkey, D., Sieber, J., Huber-Lee., A, Galbraith, H., West, J., Herrod-Julius, S., Young, C., Joyce, B., and Rayej, M.: Climate Driven Water Resources Model of the Sacramento Basin, California, J. Water Res. Plan. Man., 135, 303–313, 2009.