the Creative Commons Attribution 3.0 License.
the Creative Commons Attribution 3.0 License.
Estimation of sediment deposits in the Ghézala reservoir in northern Tunisia
Majid Mathlouthi
Fethi Lebdi
The control of sedimentation in a reservoir provides a global evaluation of the process of erosion and transportation of sediment. Knowledge of sedimentation is useful for reservoir management. Bathymetric surveys can be used to assess the silting volume of dams. The results of two surveys of the Ghézala dam reservoir in northern Tunisia are available. The measurements provide initial information about the quantity and variability of silting and the mechanism of sediment deposition. According to the results of measurements, the average annual specific sediment yield of the Ghézala dam watershed is estimated at 1851 . The annual average sediment volume trapped varies from 23 000 m3 in 1993 to 66 692 m3 in 2011. The sedimentation rates increases from 0.20 to 0.57 % overtime. The results indicate interdependence between the specific erosion rates and the occurrence of soils on steep slopes. The pressure exerted on the soil by plowing as well as overgrazing to meet the needs of the population of this area has exposed the soil to continued deterioration manifested by increased erosion endangering the only source of revenue for the area.
- Article
(8278 KB) - Full-text XML
- BibTeX
- EndNote
Rainfall enhances sediment transport via watershed runoff, especially at the beginning of the rainy season. The stream flow detaches more river bed particles through floods as a result of the high flow velocity, which increases both the capacity (the total sediment mass) and the competence (the maximum particle size) that a stream can carry. When a stream enters a reservoir, the flow velocity and energy decrease, causing the sediment to be deposited. The coarse sediment is typically deposited at the reservoir mouth, while the fine particles are deposited along the water flow direction in the reservoir. In Tunisia, 45 % of the land area is threatened by erosion (Boussema, 1996). On average 25.3 million m3 of sediment is deposited annually in dammed reservoirs. As noted above, a major problem associated with dams is sediment deposition, which increases flood risk because of a decreased water storage capacity, with attendant effects on the flood water storage capacity.
The reduced storage capacity affects the safe yield of the reservoir to meet different water demands. Various models have been suggested to study reservoir siltation. Campos (2001), for example, presented a three-dimensional model for flow and sediment concentration in reservoirs. He used two bed load functions, each one for bed direction. Laboratory test data and actual field data for Itaipu Reservoir in Brazil were considered for model verification. The result of laboratory tests indicated a good agreement between flow and sediment routing simulations and predictions of sediment deposition through the reservoir. Pak et al. (2010) evaluated a compatible reservoir sedimentation model with HEC-HMS, which was applied to two reservoirs to compare the model outputs with measured data. The results indicated a reasonable prediction of both daily flow rates and sediment loads. Issa et al. (2013) estimated the useful life of Mosul Dam, Iraq, based on a bathymetric survey approach. Mohammad et al. (2016) focused on studying the sediment deposition within Mosul Dam reservoir for the period from 1986 to 2011, using the HEC-RAS 4.1 model. Sediment depositional simulation was considered on monthly intervals (time step) for the period of study, while the pattern was considered for 5 year intervals (1991, 1996, 2001, 2006 and 2011). Thus, the simulation period extended from 1986 (beginning of the Mosul Dam operation) to 2011. Banasik et al. (2012) estimated the annual sediment yield of a small (91 km2) agricultural catchment in central Poland. In this investigation, the suspended sediment input to a reservoir was estimated using the Universal Soil Loss Equation coupled with a sediment delivery ratio (USLE-SDR). The annual bed load was estimated based on the flow duration curve and three different bed load formulae. Reservoir bathymetry surveys were carried out four times. A close agreement was found between the amount of sediment deposited in the reservoir and the sediment input estimated using the USLE-SDR and the bed load formulae.
Kondolf et al. (2014) summarize collective experience from five continents in managing reservoir sediments and mitigating downstream sediment starvation. Drawdown flushing works best in narrow reservoirs with steep longitudinal gradients and with flow velocities maintained above the threshold to transport sediment. Walling and Webb (1996) provide an overview of knowledge of global sediment yields and identify outstanding uncertainties and research needs. They point out that the analysis of available longer-term records provides an important means of assessing the sensitivity of sediment yields to environmental change, which in turn requires consideration of the impact of both human activity and climate change. Walling et al. (2013) studied the changing fluvial sediment inputs to the world's deltas. The sediment loads of the world's rivers are highly sensitive to both human impact and climate change, and the sediment loads of many rivers have changed markedly in recent decades.
The aim of this article is to present the state of the alluvial deposition of a dam in Tunisia according to the available data and to study the evolution of its capacity over time. Among other things, efforts will be made to evaluate the effects of anthropogenic or climatic factors in the catchment area on alluvial deposition in the reservoir. Due to time constraints, it is not possible to detail the erosion mechanism. A method, derived from the assessment of sediment retention in Ghézala dam, is used in this study. Records from bathymetric surveys carried out in 1993 and 2011 are available and relatively reliable erosion rates can be calculated using the retained sediments in the reservoir.
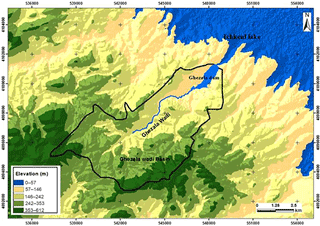
Ghézala dam is a small dam on the basin of Ichkeul Lake in Northern Tunisia (Fig. 1). It is a multipurpose dam for flood control, irrigation and water supply. The total water storage capacity of the Ghézala dam reservoir is 11.7 × 10⁶ m3 at a normal operation level of 82.5 m a.s.l. of which 9.1 and 2.6 × 10⁶ m3 are live and dead storages, respectively. The impoundment of the dam was in 1985. Sediment deposition is one of the major problems of dams, such as Ghézala dam, particularly in the upper part of the reservoir. Its watershed covers an area of 48 km2 (Fig. 1). Its lithology is highly varied with limestone, clay and marl. The most representative soils are different types of mineral soils, calcimorphic soils (rendzina, brown calcareous soils) and brown soils with sparse vegetation cover. The climate is subhumid. The mean annual precipitation is 680 mm (Mathlouthi and Lebdi, 2010) and the minimum and maximum monthly mean air temperatures are 13 and 23 ∘C, respectively.
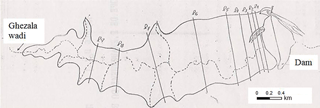
Measurement of siltation in reservoirs normally involves a bathymetric survey of the flooded portion of the reservoir and a direct topographical survey of the non-flooded portion between the normal water level and the level of water during the measurement. The bathymetric survey is based on a simple comparison of reservoir morphology at two different periods of time, first at the time of the construction of the dam and second at the time of the survey. In this study bathymetric survey of the reservoir bed was conducted along transverse profiles previously identified, the depths being recorded by a scrolling Echo Sounder. This method is uncomplicated and easy to use, but it is not very precise and cannot be used systematically for depths less than 5 m (Claude and Chartier, 1977). For this study, the choice of the cross section on the reservoir to be surveyed is made on a topographical plan of the region of the dam reservoir at the scale 1 : 5000 and with contour spacing at 2 m. There is no specific rule to guide this choice; we generally seek cross sections to the bed of the wadi, avoiding the narrowing and preferably choosing the widest sections. If the reservoir is divided into several branches, each one is treated independently. Nine cross sections of the reservoir of Ghézala wadi were identified (Fig. 2). For each profile, the original (initial) cross section of the reservoir at the time of impoundment in 1985 was obtained from the topographical plan. Then bathymetric surveys were conducted to establish the current reservoir depths. The new profile is compared with the original profile. The two profiles thus obtained and the silted surface of the profile is quantitatively determined in a GIS, in other words the area of siltation (in m2) of a section at the height of the water site to which the measurements were made.
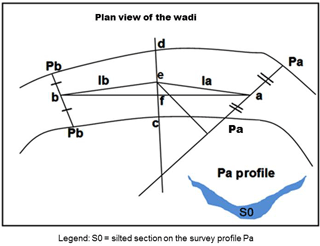
In this study the General Method was used to determine the volume of siltation. This method is based on silted sections of the surveyed profiles but also takes into account the angles between adjacent sections, shown as Pa and Pb in Fig. 3 (Claude and Chartier, 1977; Alahiane et al., 2014).
First the sediment surfaces, Sa and Sb respectively, are determined of the two retaining profiles Pa and Pb and then the distance between these two profiles is calculated (see Fig. 3). To do this we draw a line ab between the centre points of Pa and Pb; we draw the line cd perpendicular to segment ab at its center; the distance between the middle (e) of segment cd and points a and b give the lengths la and lb.
Determing the total volume takes into account the slopes αa and αb, respectively for Pa and Pb compared to straight sections ea and eb. The total volume Vab is (Claude and Chartier, 1977):
Where αa is the angle and αb is the angle .
Since the impoundment of the dam (1985), two measures of siltation of the Ghézala dam were carried out by the General Directorate of Dams and Large Hydraulic Works (Tunisia) during relatively calm weather (light wind). The results of these measurements are shown in Table 1.
Erosion rates were estimated by the sediment volume measured in the reservoir divided by the area of the catchment draining into the reservoir. At the time of the first measurement, the amount of silt was accumulated for 8 years and 5 months. The reservoir is silted at 1.64 % of its capacity, which allows us to assess the annual rate siltation at 23 000 m3 yr−1 or 0.25 % of the live capacity of the reservoir (the live capacity of the reservoir is 9.1 × 10⁶ m3). In the second measurement, 14.8 % of the reservoir capacity has been infilled, corresponding to an annual siltation rate of 66 692 m3 yr−1 which gives a life expectancy of about 175 years before the reservoir has been totally infilled. The annual rate of siltation has increased (threefold from 1993 to 2011) which reduces the life of the dam from about 500 to 175 years. This can be explained by clearing of maquis vegetation in the watershed due to an exponential expansion of annual crops. The latter activity involves plowing in the direction of the slope, a factor that accentuates and exacerbates erosion in the watershed. This is evident in the estimated erosion from the watershed which increased from 0.48 to 1.39 mm yr−1 during the same time period.
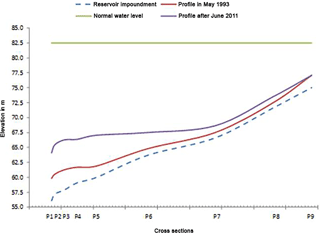
In Fig. 4 we compare the profile along the Ghézala river before impoundment with the measured profiles along the silted bottom (low point of the current sections). Figure 5 shows the cross sectional areas of silted sections measured along the profiles in Ghézala reservoir in May 1993. We note here the importance of siltation in the downstream (see Fig. 2) part of the reservoir.
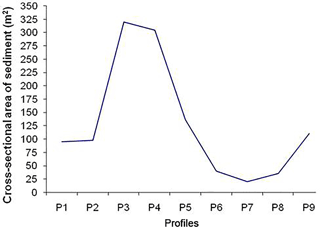
Figure 5Cross-sectional areas of sediment at the measured profiles along the Ghézala river (in May 1993).
Ghézala dam has been operational since April 1985; the latest measurements therefore include a period of 26 years of operation. The dam operating results are summarized in Table 2. To calculate the total sediment input to the dam we assumed that the volume of water released had a mean load of 3 g L−1 (or kg m−3) of sediment (Ben Mammou and Louati, 2007), assuming the same value as for the Mellègue dam calculated over 14 years. This assumption depends on the morphology, the pedology, the watershed land use and rainfall patterns. Further, the spilled water was assumed to contain 1 g L−1 of sediment taking into account the morphology of the reservoir, based on spot measurements made during flood conditions. It is assumed that the solids density of sediments in the bottom of the reservoir comprised of silts and clay is 1.2 t m−3, with a real density of 2.4 t m−3 and a bulk density of 1.7 t m−3.
From these assumptions the balance of sediment transport in 2011 may be estimated (Table 3).
Table 4Increase in agricultural area over time (based on interpretation of aerial photographs and satellite images in both periods).

The volumes of water flowing into the reservoir or withdrawn are well controlled. The volumes that are discharged by the spillway during extreme floods are controlled, however their turbidity is unknown. It is estimated, however, that floodwaters released from the reservoir contain little more than 3 g L−1 due to sediment deposition before the arrival at the spillway. The bulk density and true density of sediment deposited and drawdown silt are poorly understood, consolidated sediment volumes were measured for several years under several metres of water, and an average concentration of solids (g L−1) was measured on the liquid flow. The transition from one to the other requires a precise knowledge of the densities; which is not easy to achieve. At the watershed scale of 48 km2, the transport of 1.925 × 10⁶ m3 of silt equates to 2.31 × 10⁶ t in 26 years, representing an average erosion rate from the watershed of 1542 or 1851 resulting in an average concentration of the water entering the reservoir of 10 g L−1 solids.
Based on the results of a large 2 year intensive measurement campaign of the turbidity of the main river in the extreme north of Tunisia and watersheds of Lake Ichkeul, the annual average turbidity of Ghézala river is assumed to be 6.56 g L−1, which equates to 1.547 × 10⁶ t or 1.289 × 10⁶ m3 contributions of solids. The difference between the measured siltation in the reservoir (neglecting the other two values, turbidity of released and spilled water, not measured) can be attributed to long distance transportation and therefore represent thrusting 0.445 × 10⁶ m3 (1.289 × 10⁶ m3 compared to 1.734 × 10⁶ m3) or 25 % of total sediment transport (1.734 × 10⁶ m3) and 34 % of transportation suspended (1.289 × 10⁶ m3). The reservoirs of Tunisian dams lose 0.5 to 1 % of their capacity each year due to infill with alluvium. The annual average sediment volumes trapped in Tunisian dam reservoirs varies from 0.017 × 10⁶ m3 for Bezirk dam (Northeast Tunisia) to 6 × 10⁶ m3 for Sidi Salem dam, North Tunisia. Siltation measured in 2002 in Sejenane dam located in the same region as the Ghezala dam resulted in an estimated average annual siltation rate of 0.5 × 10⁶ m3 (Ben Mammou and Louati, 2007).
Field observation shows that the watershed is subject to intense erosion where mass movements and gullies predominate, accentuated by plowing and soil preparation for cultivation. The vulnerability of soil in the watershed to erosion is attributed to lithology. The dominant formations (Upper Cretaceous) consists mainly beds of clays and marls with very little resistance to erosion (clays and marls) and harder chalky beds. In the Ghézala dam watershed the steepest slopes correspond to limestone geology. Several authors have shown that specific erosion increases significantly with slope (Huang, 1995; Jaoued et al., 2005). The authors attribute such a relationship to the nature of the soil, the speed of flow, the characteristics of rainfall and surface crusting (Jaoued et al., 2005).
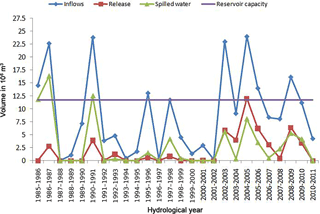
The combined action of various factors of the natural environment and increased human agricultural activities has contributed to the degradation of soils in the Ghézala watershed (Table 4). The pressure exerted on the soil by plowing as well as overgrazing to meet the needs of the population of this area has exposed the soil to continued deterioration manifested by different erosive phenomena endangering the only source of revenue for the area. The observed increase in sedimentation in the reservoir (in 2011 compared to 1993) could be caused by other factors, such as increased intensity and amount of rainfall during the study period. Figure 6 shows that the number of floods after 1993, the date of the first siltation measure, is important. Knowing that a hydrological year begins in September and ends in August of the succeeding year. Annual inflows exceeded twice the reservoir capacity, 23 and 24 million of m3 respectively in 2003 and 2005. This increase in inflows between the time of the first and second sedimentation measurements and also withdrawal that is not performed at optimal times, otherwise the opening of the bottom outlet valves during extreme floods, have contributed to increasing the reservoir sedimentation rate. Additional questions may arise about the efficiency of the withdrawal, how and at what times can be conducted? With what flow? And for how long (throughout and after the floods)?
Water erosion is a natural process which is considered to be the primary cause of degradation of agricultural land. It is necessary to take corrective action before soils become infertile. Measurements of siltation of Ghezala reservoir presented here, enable estimation of the volume of sediment trapped in the reservoir. It is suggested that the sediment trapped could be returned to agricultural land. The accuracy of the sedimentation estimation method depends upon the profiles selected and precise mapping of the reservoir bed. Siltation measures should be developed to monitor, at regular intervals, the evolution of the life time of dams and improve operating conditions. The results of these measures have highlighted the significant erosion to which the watershed of the Ghézala dam is subjected. The use across the watershed of a runoff and erosion model with distributed physical parameters can improve understanding of the variability of the factors responsible for soil loss and thus help to address the problems related to the soil conservation. Indeed, according to field surveys, the most significant factors for erosion across this study area are lithology, slope and land use.
The control of sedimentation in the reservoirs provides an integrated evaluation of the process of erosion and transportation of sediments taking account of the bed-material load. The knowledge of sedimentation is also useful for dam management. In Tunisia, little was known about erosion, transportation and sedimentation phenomenon which is necessary in order to manage their consequences.
The data are printed in paper documents stored (archived) in office of the General Directorate of Dams and Large Hydraulic Works of the Ministry of Agriculture of Tunisia (http://www.agriculture.tn/). These data are the property of this organization responsible for dams in Tunisia, and are available in situ.
The authors declare that they have no conflict of interest.
This article is part of the special issue “Water quality and sediment transport issues in surface water”. It is a result of the IAHS Scientific Assembly 2017, Port Elizabeth, South Africa, 10–14 July 2017.
The authors acknowledge the help of General Directorate of Dams and Large Hydraulic Works of the Ministry of Agriculture of Tunisia.
The authors thank the reviewers for their relevant remarks that contributed to the improvement of this article.
Edited by: Kate Heal
Reviewed by: two anonymous referees
Alahiane, N., El Mouden, A., Lhaj, A. A., and Boutaleb, S.: Practical Method Proposed to Estimate Silting's Rate in Small and Hillside Dams, J. Water Resour. Protect., 6, 930–943, 2014.
Banasik, K., Gorski, D., Popek, Z., and Hejduk, L.: Estimating the annual sediment yield of a small agricultural catchment in central Poland, in: Erosion and Sediment Yields in the Changing Environment, edited by: Collins, A. L., Golosov, V., Horowitz, A. J., Lu, X., Stone, M., Walling, D. E., and Zhang, X., IAHS Publ., 356, 267–275, 2012.
Ben Mammou, A. and Louati, M. H.: Évolution temporelle de l'envasement des retenues de barrages de Tunisie, Revue des sciences de l'eau, 20, 201–210, 2007.
Boussema, M. R.: Système d'information pour la conservation et la gestion des ressources naturelles: in colloque international sur le rôle des technologies de télécommunications et de l'information en matière de protection de l'environnement, Tunis, Tunisia, 17–19 April 1996.
Campos, R.: Three-Dimensional Reservoir Sedimentation Model, PhD thesis, University of Newcastle, Newcastle, UK, 2001.
Claude, J. and Chartier, R.: Mesure de l'envasement dans les retenues de six barrages en Tunisie. Campagne 1975, Cah. ORSTOM, sér. Hydrol., 16, 3–35, 1977.
Huang, C.: Empirical analysis of slope and runoff for sediment delivery from interill areas, Soil Sci. Soc. Am. J., 59, 982–990, 1995.
Issa, I., Al-Ansari, N., and Knutsson, S.: Sedimentation processes and useful life of Mosul Dam reservoir, Iraq, J. Sci. Res. Eng., 5, 79–84, 2013.
Jaoued, M., Gueddari, M., and Saadaoui, M.: Modélisation de l'érosion hydrique dans le bassin versant de l'oued M'Khachbia (Nord-Ouest de la Tunisie), Geo-Eco-Trop., 29, 15–24, 2005.
Kondolf, G., Gao, Y., Annandale, G., Morris, G., Jiang, E., Zhang, J., Cao, Y., Carling, P., Fu, K., Guo, Q., Hotchkiss, R., Peteuil, C., Sumi, T., Wang, H., Wang, Z., Wei, Z., Wu, B., Wu, C., and Yang, C.: Sustainable sediment management in reservoirs and regulated rivers: Experiences from five continents, Earths Future, 2, 256–280, 2014.
Mathlouthi, M. and Lebdi, F.: Modélisation de la relation pluie–ruissellement par durée d'épisode pluvieux dans un bassin du Nord de la Tunisie, Hydrol. Sci. J., 55, 1111–1122, 2010.
Mohammad, E. M., Al-Ansari, N. A., Issa, I., and Knutsson, S.: Sediment in Mosul Dam reservoir using the HEC-RAS model, Lakes and Reservoirs: Research and Management, 21, 235–244, 2016.
Pak, J., Fleming, M., and Ely, P.: Assessment of reservoir trap efficiency methods using the hydrologic modeling system (HEC-HMS) For the upper north Bosque River watershed in central Texas, in: Proceedings of the 2nd Joint Federal Interagency Conference (9th Federal Interagency Sedimentation Conference and 4th Federal Interagency Hydrologic Modeling Conference), Las Vegas, Nevada, 27 June–1 July 2010.
Walling, D. and Webb, B.: Erosion and sediment yield: A global overview, in: Erosion and Sediment Yield: Global and Regional Perspectives: IAHS Publ., 236, 3–19, 1996.
Walling, D., Young, G., and Perillo, G.: Changing fluvial sediment inputs to the world's deltas, Deltas: Landforms, Ecosystems and Human Activities, 358, 12–25, 2013.


