the Creative Commons Attribution 4.0 License.
the Creative Commons Attribution 4.0 License.
 | 19 Apr 2024
Investigation of transition signals from single cell to multicell thunderstorms in the Kinki region, Japan by using vertical vorticity and multi-parameter radar analysis
Fauziana Ahmad
Kosei Yamaguchi
Eiichi Nakakita
Tomoki Ushiyama
Floods and landslides caused by extreme weather events, such as localized excessive rainfall in Japan, cause enormous devastation. Multicell clouds, on the other hand, have a common duration of over an hour and greater aerial coverage than single-cell clouds. For flood warning systems to function properly, the hazardous cloud must be detected quickly. Using pseudo and dual-Doppler vorticity approaches, the vertical vorticity estimate was extended from single-cell to multicell transitions case. According to the research, the single cells attained the peak of maximum vorticity of 0.08 and 0.01 s−1 for pseudo-vorticity and dual-Doppler vorticity, respectively. The maximum column of specific differential phase (Kdp) column above the melting layer indicated that the transition with 1 km depth as compared to differential reflectivity (Zdr) column was not observed after the cell merging. However, it was identified 5 min after the cell merged. In contrast, the Kdp column was always identified after the cell merging, and the column showed an increase in intensity 5 min after the cells merged. Vertical vorticity and multi-parameter radar analysis provided an insight into the transition from single-cell to multicell formation.
- Article
(2298 KB) - Full-text XML
- BibTeX
- EndNote


The localized heavy rainfall from cumulonimbus clouds, which commonly occurs in the summer season, is potentially hazardous. In 2008, a flash flood occurred in the Toga River located in Kobe, Japan due to the downpour of Guerilla-heavy rainfall from the development of isolated cumulonimbus clouds (Nakakita et al., 2013, 2017). The rapid rise of water level in the river basin caused the death of five people. The dissemination of early warnings could not be delivered promptly since the flood came rapidly. Furthermore, the single-cell clouds could merge into multicell clouds, which have a common lifetime of more than an hour and greater aerial coverage than a single-cell cloud. Small-to-medium-sized hail, small tornadoes, and heavy precipitation are all risks linked with multicell clouds. Heavy precipitation from multicell clouds thunderstorms might also intensify flash flood events, especially in urban areas. For example, the multicellular storm brought localized heavy rain near Zoshigaya, Tokyo on 5 August 2008, causing five sewage workers to be washed away by a flash flood (Kato and Maki, 2009; Hirano and Maki, 2010; Kim et al., 2012). The multicell formation studies in Japan are mostly investigated to understand the characteristics and its stage of formation. Previous research has focused on radar reflectivity (Nishiwaki et al., 2013; Shusse et al., 2005) based on the stage of multicell development. Kim et al. (2012) analyzed the precipitation core development and its structure by combining liquid water content (LWC) and Kdp. The study of the transition from single-cell to multicell is more concentrated on radar reflectivity in which the merging of echo cores involved the merger of updrafts (Wescott, 1994). They discovered that the enhancement of low-level convergence by storm outflows was essential in initiating the growth of new echo cores and increased the likelihood of a merger. According to a research by Vasiloff et al. (1986), the size and intensity of subsequent cells and updrafts increased due to a storm-environment feedback process involving updraft-downdraft interactions, as well as increased ambient vertical winds shear and buoyancy. In this study, we emphasized multicell development because the potential of cells merging related to the severity of thunderstorms is also important in the dissemination of early warnings.
Referring to the case of the Toga River basin, Nakakita et al. (2013, 2017) developed prediction methods on the first radar echo aloft that was described as a “baby-rain-cell” in a single cumulonimbus cloud by using Doppler weather radar observation. They confirmed the presence of a pair of positive and negative vertical vortex tubes as well as an updraft in the early stage of a rain-cell. According to the study, the vertical vorticity values should be greater than or equal to 0.03 s−1 to identify the hazardous rain cell in the initiation stage before it developed to the cumulus stage. Since the successful lead time in the detection of “baby-rain-cell” in localized Guerilla-heavy rainfall, the vertical vorticity method is a novel approach to discover the potential of cell merging in the multicell thunderstorm analysis. Therefore, this study aimed to examine the availability of vertical vorticity to forecast the potential of cell merging related to heavy rain in the hazardous storm.
In addition, dual-polarization radar parameters are widely used for rainfall estimation, supercell signatures, and radar echo classification. Instead of utilizing horizontal polarization (Zh), other radar parameters such as differential reflectivity (Zdr) and specific differential phase (Kdp), are also mainly used in the detection of severe thunderstorms. For instance, Kim et al. (2012) analyzed the precipitation core development and its structure of multicell formation by combining liquid water content (LWC) and Kdp. The Zdr column appears to be associated with rising motion within thunderstorms. Zdr column analysis is strongly recommended in the operational and research application due to its identification of updraft location and strength (Kumjian and Ryzhkov, 2008). The Zdr columns may also aid in tracking dominant updrafts in multicell storms or storm-merger situations. Furthermore, the positive values of Kdp observed above the melting level, which is labeled as the Kdp column, are usually associated with deep convection updraft cells. Many studies associate Kdp volumes with the updraft mass flux, lightning flash, and intense rainfall. Moreover, Kdp columns also reveal signatures of changing updraft properties in the evolution of storm events (van Lier-Walqui et al., 2016).
The vertical vorticity analysis is mostly investigated in supercell thunderstorms owing to the exhibition of updraft rotation. According to a study by Nakakita et al. (2017), a vorticity pair in the baby-rain-cells was detected, which was related to the existence of an updraft in the single-cell. Therefore, the characteristics and mechanisms for the development from single-cell to multicell thunderstorms, which contribute to localized heavy rainfall, motivated the authors to discover the significant criteria related to the severity of thunderstorms. The Zdr column and Kdp column also indicated the strength and the location of the updraft, which were beneficial in the detection of hazardous clouds. Therefore, the study on polarimetric for the detection of potential heavy rainfall in multicell thunderstorms could provide insight into the understanding of the multicell characteristics from the initiation stage to the development stage of occurrence of heavy rainfall.
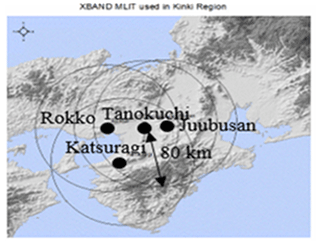
Figure 1Four radar stations in the Kinki region, Japan (so-called Honshu), were used for the observation of the cell merging of the radar reflectivity. The black arrow shows the maximum range of 80 km between the radar stations.
2.1 Data
This study used the XRAIN operated by the Ministry of Land, Infrastructure, Transport and Tourism (MLIT). In this event analysis, X-band polarimetric radar with parabolic antenna namely, Tanokuchi, Rokko, Juubusan, and Katsuragi radar stations, were selected, as illustrated in Fig. 1. The radars cover an 80 km radius and have a sampling resolution of 150 m.
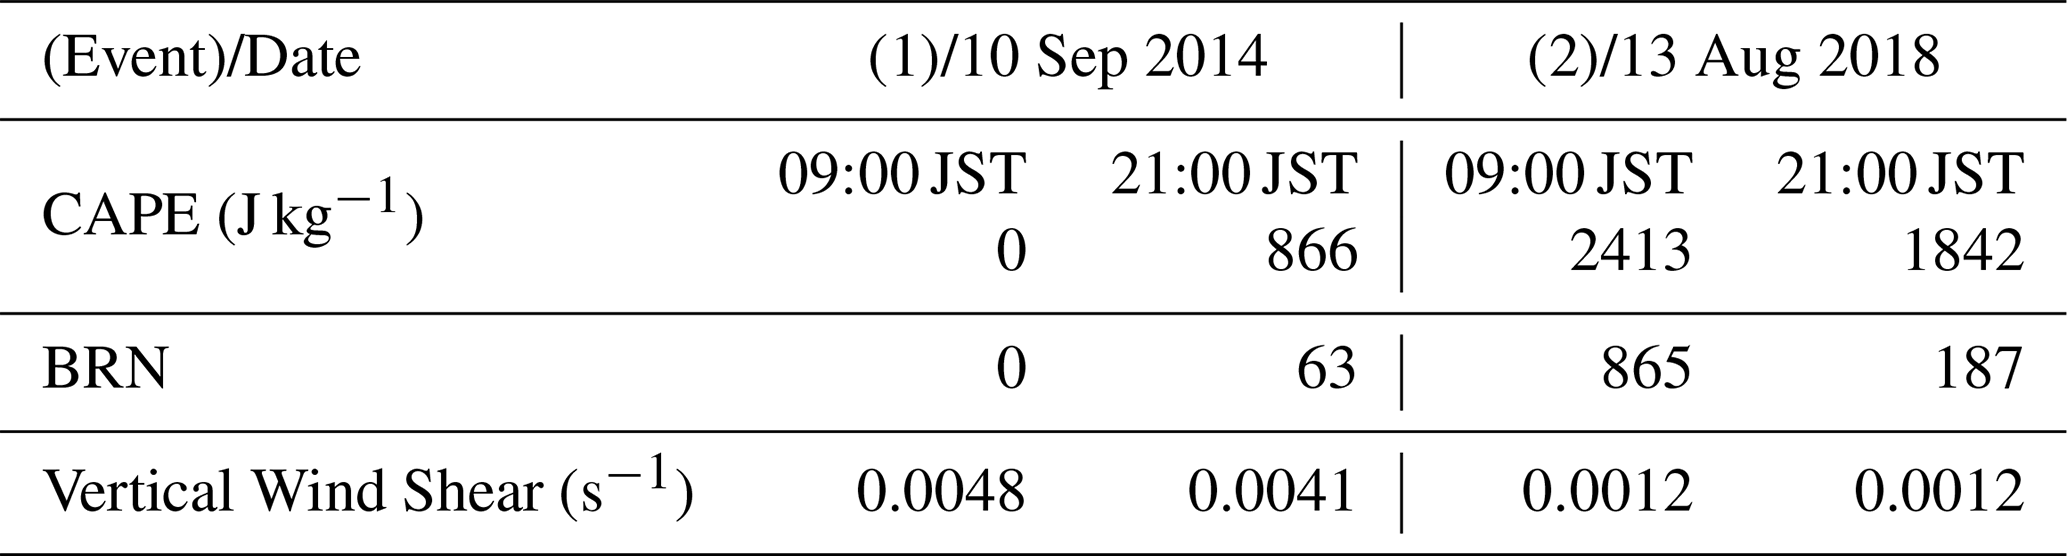
In this study, the study area was located in Kinki region which includes an urban region located in western part of the main Japan island (so-called Honshu). The thunderstorms events were selected with the environmental conditions that support the multicell development as listed in Table 1. The atmospheric instability was indicated by using Convective Available Potential Energy (CAPE) and Bulk Richardson Number (BRN) from radiosonde data. The value of these parameters was taken at 09:00 Japan Standard Time (JST) and 21:00 JST observations at Shionomisaki station. The vertical wind profile from 1 to 3 km of height indicated a weak vertical shear that was appropriate for the multicell thunderstorms. The atmospheric instability and the environmental condition supported the development of multicell thunderstorms.
Dual-Doppler synthesis is the most important and widely used method for determining the air motions within precipitating cloud systems. The radar reflectivity (Zh) and Doppler velocity obtained from two radars (Tanokuchi and Katsuragi for event 1, Tanokuchi and Rokko for event 2) were converted into 1 km × 1 km × 0.5 km of Constant Altitude Plan Position Indicator (CAPPI) by utilizing the variational method approach (Shimizu et al., 2008). Three wind components (u, v, and w) were retrieved on the Cartesian coordinate system within the solid circles, except for the hatched area in every 5 min. The radar observation used for the dual-Doppler analysis is shown in Fig. 2.
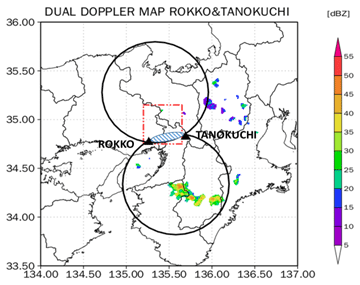
Figure 2Radar observations for dual-Doppler radar with the red color box indicating the target area for analysis within the two solid circles, but excluding the hatched area.
2.2 Methodology
The pseudo-vorticity observed at a single Doppler weather radar, and the radar selection is dependent on the distance from the radar to the target area. Dual-Doppler radar analysis is performed for retrieval of the three-dimensional (3D) wind fields to examine the kinematic mechanisms of cloud development by using two components of the Doppler velocity by two radars simultaneously. We compared both analyses to investigate the transition signals in cells merging since both methods produced the different temporal and spatial resolutions. The dual-polarization radar parameters, such as Zdr and Kdp column were mainly used to investigate the strength and location of the updraft to examine the severity of thunderstorms (van Lier-Walqui et al., 2016). Therefore, the characteristic patterns of transition to multicell focused on the Zdr column and Kdp column depth were investigated. We proposed the new method of analysis by emphasizing that the maximum of both columns to be calculated after the melting height because these columns reflected the considerable amounts of supercooled water were being lifted if the updraft occurs. The pseudo-vorticity analysis only implemented in event 1, meanwhile the DDA vorticity and multi-parameter radar analysis were conducted in event 2.
2.2.1 Dual-Doppler vorticity analysis
The dual-Doppler analysis (DDA) vorticity was estimated by applying Eq. (1) with a spatial resolution of 1 km × 1 km × 0.5 km of CAPPI 2 km at 5 min intervals. The core vorticity of the dual-Doppler analysis (DDA) was defined as the maximum intensity of the positive vorticity and the minimum intensity of the negative vorticity intensity, which was obtained for each CAPPI height.
In the Cartesian coordinate system, the vertical vorticity is expressed as in Eq. (1):
where, u is zonal wind component, and v is meridional wind component in the x and y direction, respectively.
2.2.2 Pseudo-vorticity analysis
The pseudo-vorticity was estimated by applying the method proposed by Nakakita et al. (2017) with a spatial resolution of 50 m × 50 m in each elevation angle at 1 min intervals. Using the radial velocity speed, the vorticity can be calculated by using Eq. (2),
where, Va and Vb are radial velocities moving toward and away from the radar in the Cartesian coordinates, respectively, and 2r is total distance of radar pulse between the mesh center.
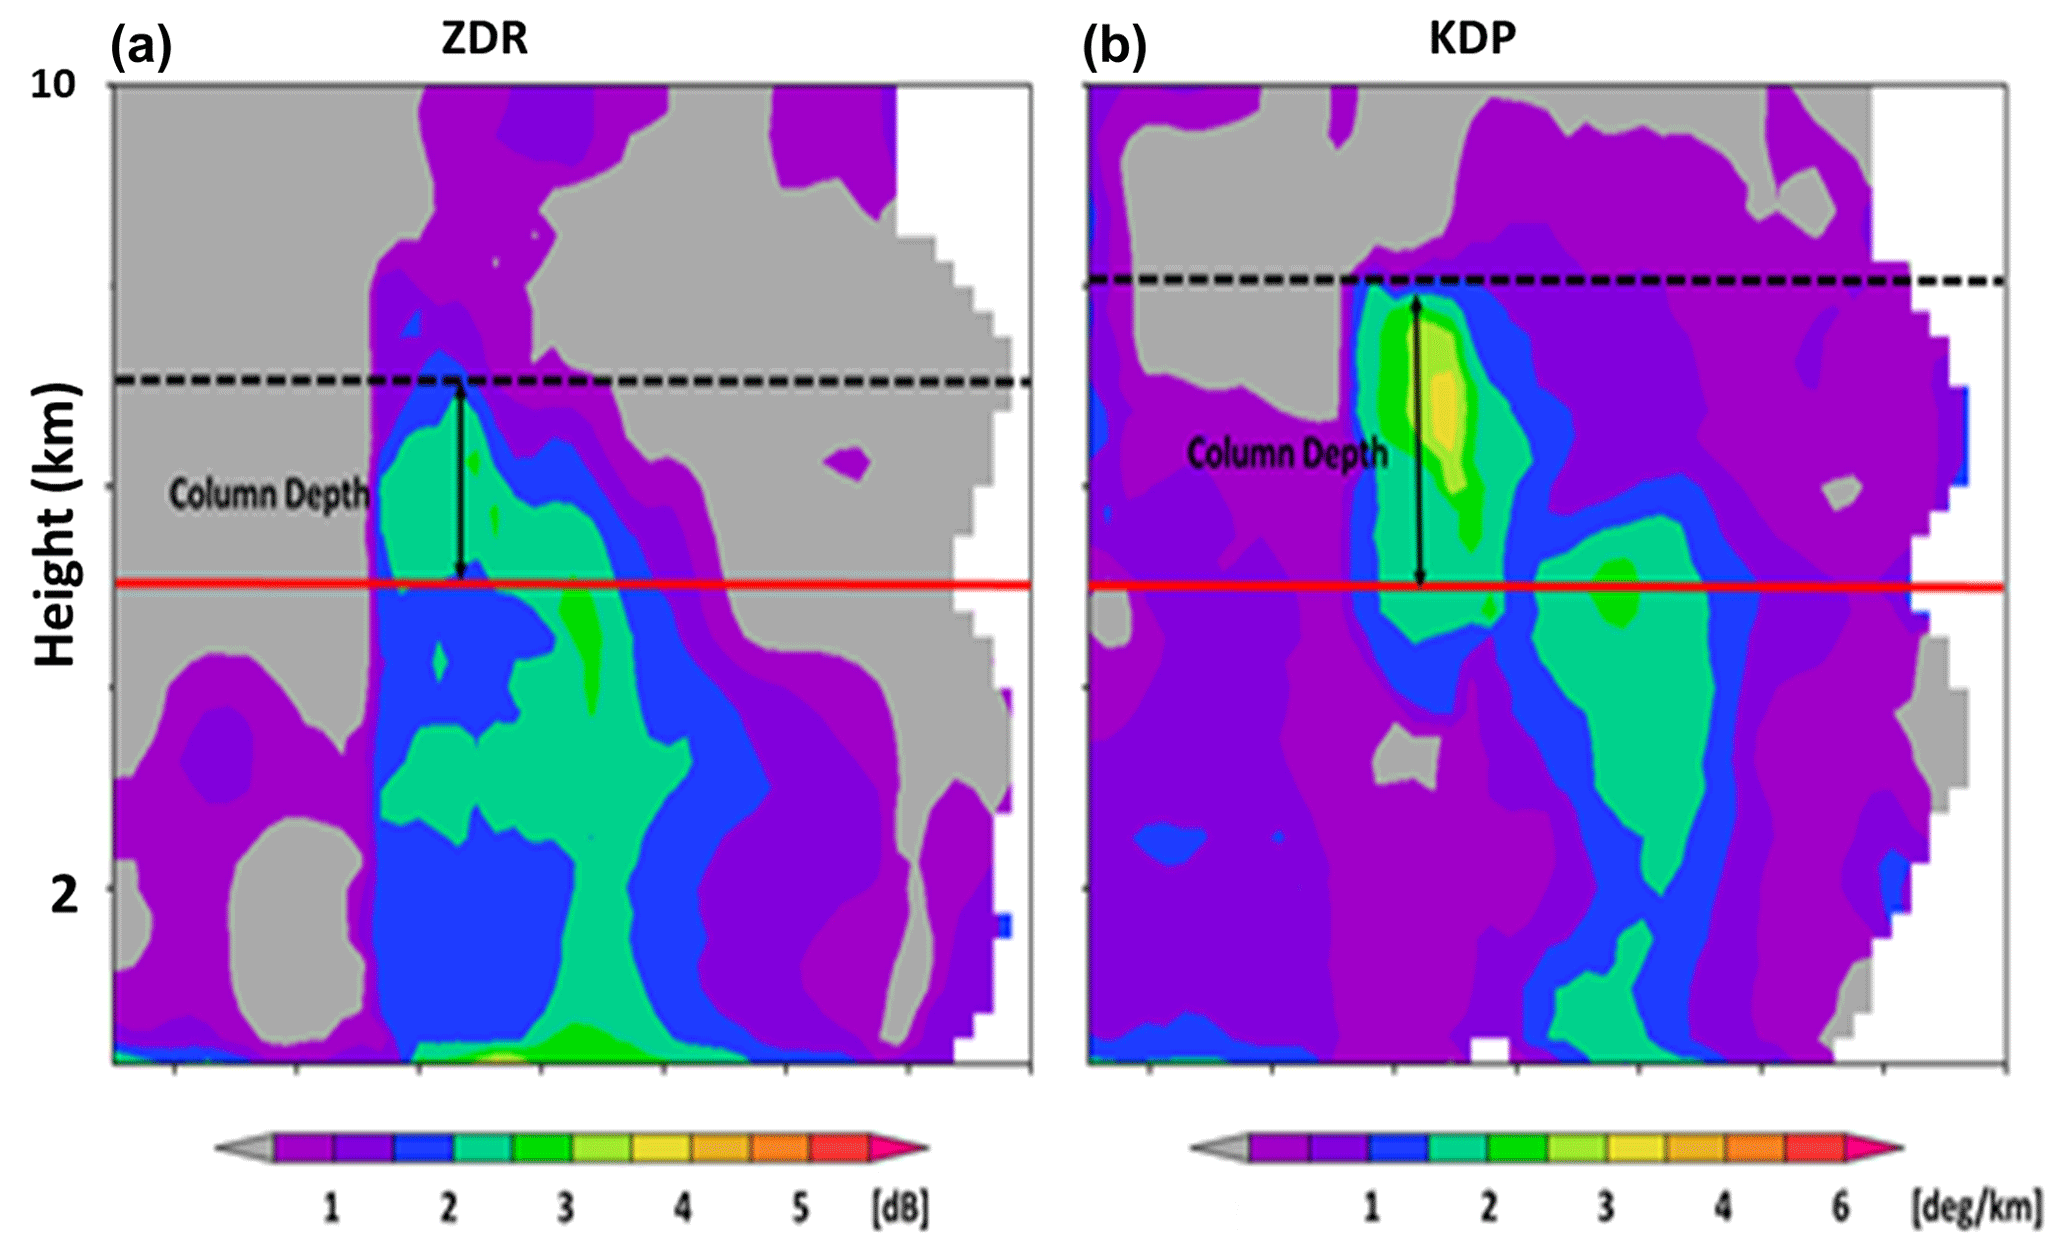
Figure 3Illustration of: (a) Zdr column depth, (b) Kdp column depth indicated by the solid arrow, and the melting level indicated by a red solid line.
2.2.3 Zdr column and Kdp column
The radar parameters obtained from each radar were converted to compose together into 0.25 km × 0.25 km × 0.25 km resolution of CAPPI by Cressman interpolation (Masuda and Nakakita, 2014) by using four radars in every 5 min. Therefore, the characteristic patterns of transition focused on the Zdr column and Kdp column depth were investigated as illustrated in Fig. 3a and b, respectively. The column depth was defined when the Zdr (>2 dB) and Kdp (>1.5° km−1) were above the melting height level. In this study, the melting level was observed at 5 km above ground level (a.g.l.) for both events, which was retrieved from the radiosonde data at Shionomisaki station.
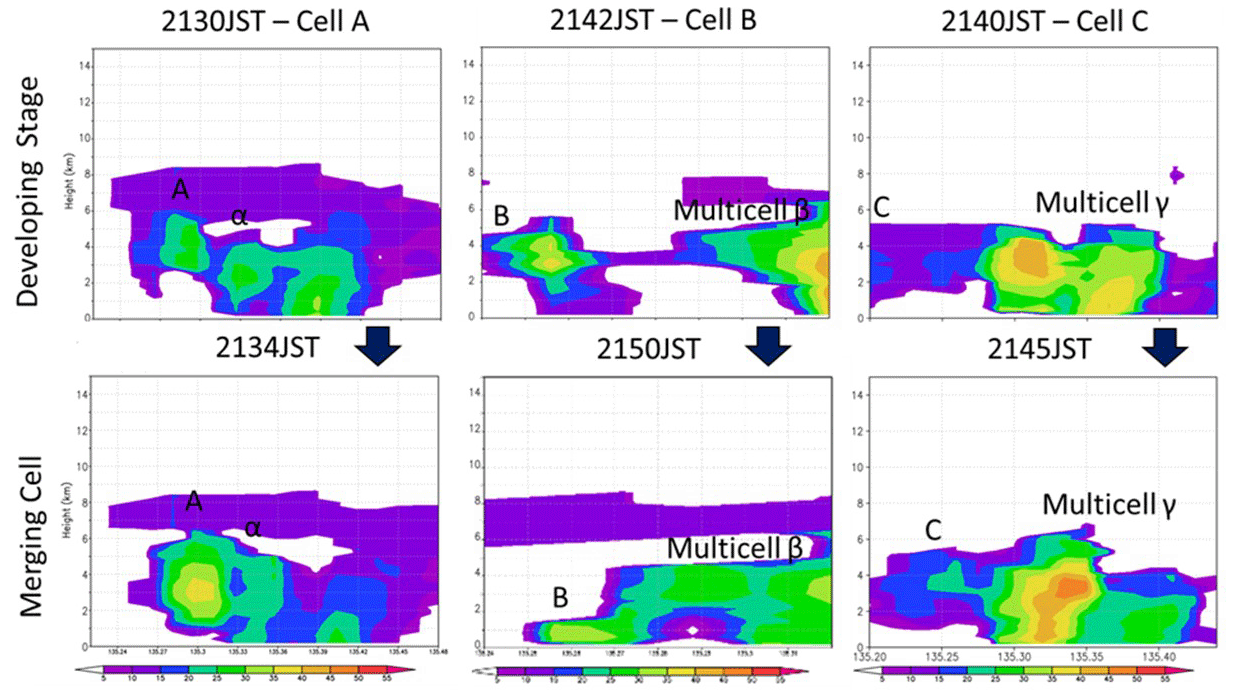
Figure 4Vertical cross-section images of single-cell transformed into multicell with respect to time of developing stage and merged cells.
3.1 Vertical vorticity analysis
The vertical cross-section images of each single-cell that was investigated in this analysis were constructed as shown in Fig. 4. A single-cell was defined as cell developed within a range of 20 km from the center of the storm. As stated by Browning et al. (1976), the new cells that were developed from the parent cell should be 30 km from the core of Zh. Hence, in this range, we determined the development of single-cell whether it was developed adjacent to the pre-existing cells by investigating the cross-section of radar reflectivity of dual-Doppler analysis. Therefore, the cross-section of each cell was constructed to identify its early stage and merging stage development. Since we were interested to distinguish the evolution of single-cell and multicell, the categorization of cells was divided with different labels of cells inspected. The classification of the single-cell label followed the cells' appearance (starting from A, B, and C), in contrast, the multicell label followed the cells merged starting from α, β, and γ in the order of formation. It was clearly observed that all single-cells merged with the existing multicell, and combined to become a more intense multicell. The time-series analysis of vertical vorticity was conducted to identify the temporal change of cells before and after single-cell merged with the multicell. The result showed that the intensity of the core vorticity reached its peak during the transition. In this study, the calculated average of vertical vorticity before merging was perceived at 0.002 s−1(DDA vorticity) and 0.02 s−1 (pseudo-vorticity) as shown in Table 2.
Table 2Peak of core vorticity intensity before merging into a multicell.
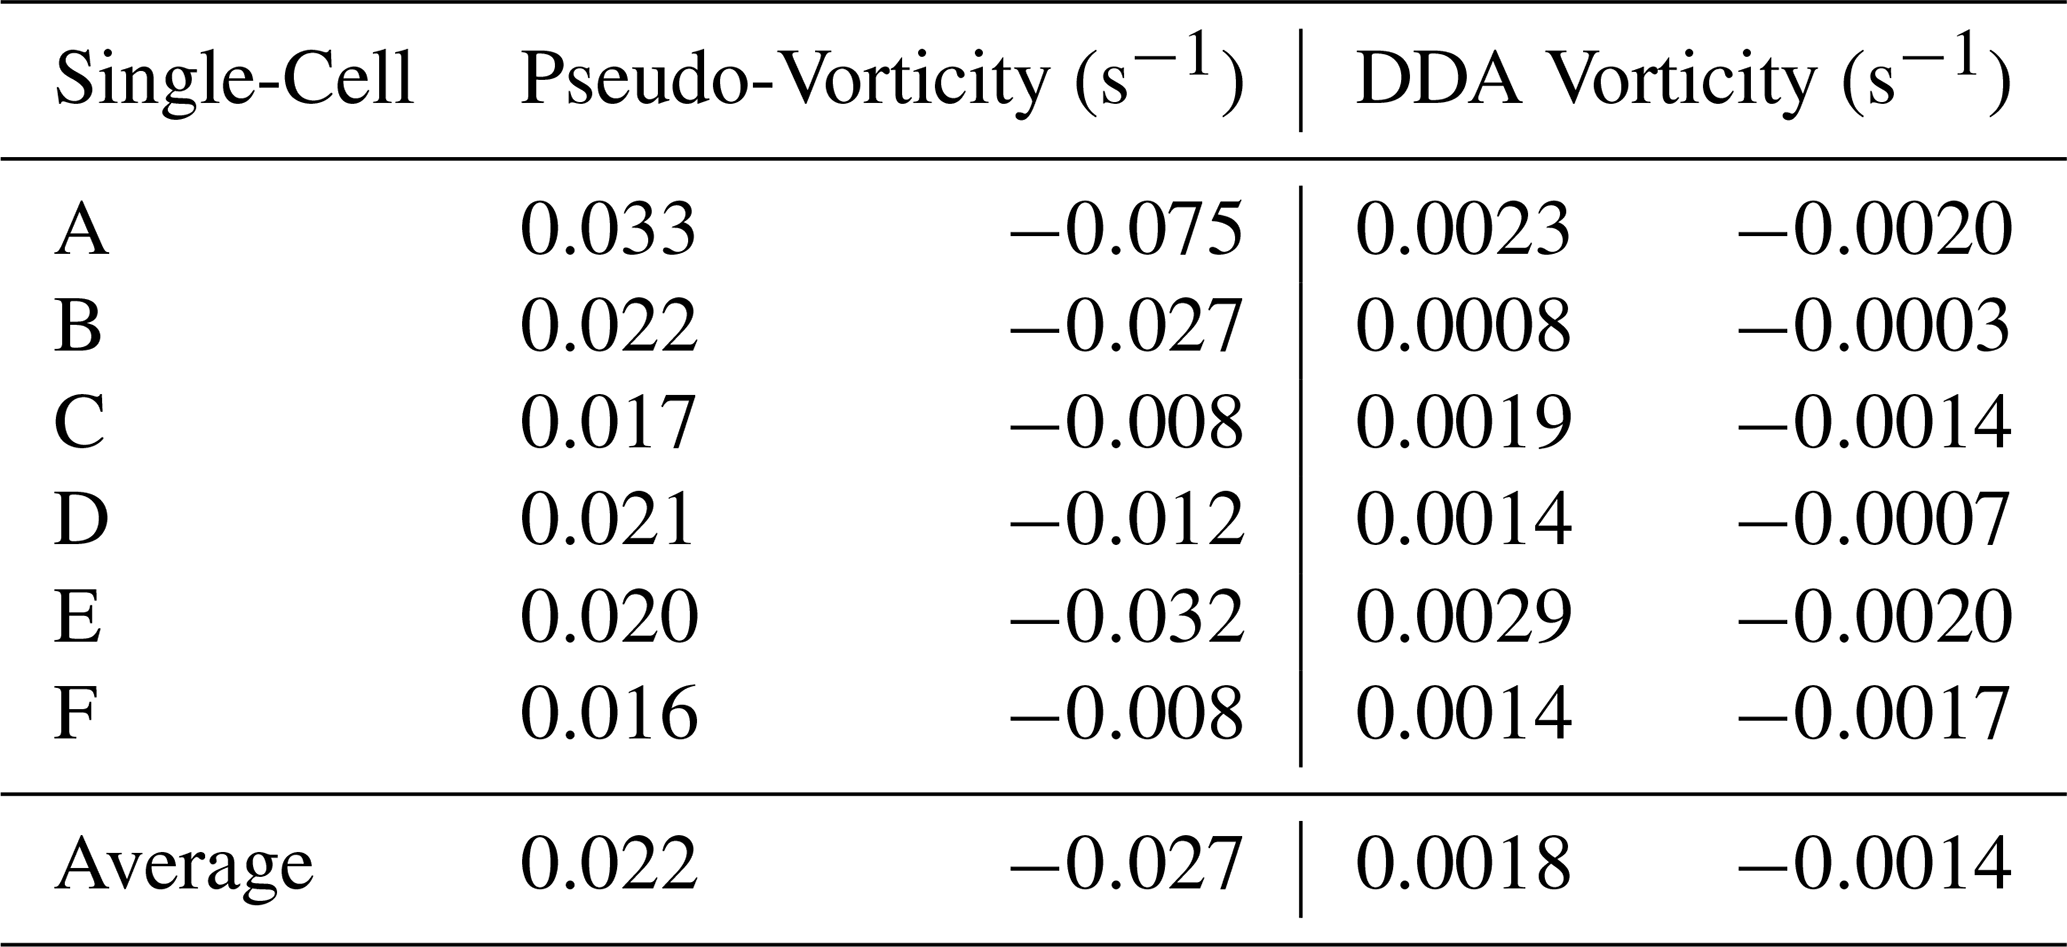
In this study, pseudo-vorticity presented the average vertical vorticity at 0.04 s−1 for both single-cells and multicell. In contrast, the average of core vorticity for the transition from single-cell to multicell was attained in the range of 0.002 to 0.004 s−1. The mature vortex in the multicell was always discovered at the later stage that was defined as core vorticity maxima boundary at the threshold intensity of more than 0.005 s−1 for DDA. These characteristic patterns could be observed by both methods by using pseudo-vorticity and DDA although the intensity of pseudo-vorticity was ten-times higher than DDA vorticity analysis.
The most important findings were made during the detection of maximum rainfall before it reaches the ground. It was quantified that the first detection of vertical vorticity in the single-cell could be referred to as an indicator of the peak of radar reflectivity after the cells merged into a multicell. In these new outcomes, the pseudo-vorticity quantified the lead time as an average of 17 min, and the DDA specified an average of 13 min before the peak of rainfall reaches the ground as shown in Fig. 5. These new findings could assist the forecasters in disseminating the early warnings to prevent more damage to infrastructure and casualties.
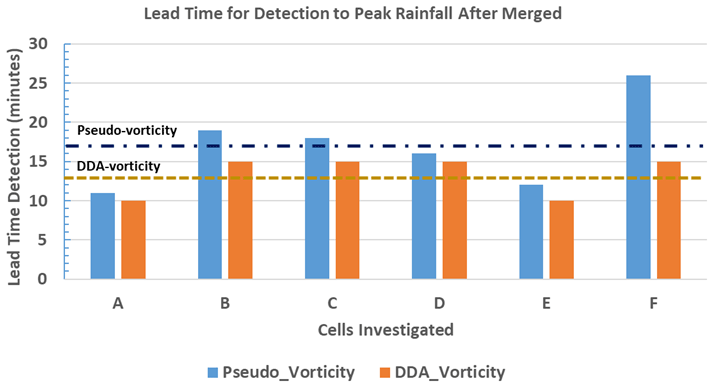
Figure 5Lead time of the first detection of vertical vorticity before the peak of core Zh after cells merged.
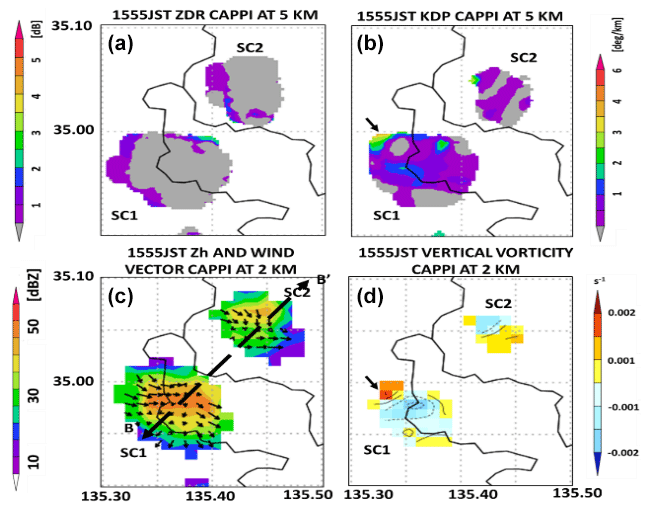
Figure 6Horizontal distribution at 15:55 JST at for SC1 and SC2 for (a) Zdr, (b) Kdp at height of 5 km, and for (c) Zh, (d) vertical vorticity at height of 2 km.
3.2 Multi-parameter radar analysis
Further investigation was conducted on the transition from single-cell to multicell in the multicell environment condition by selecting event 2, which was focused on the first single-cell development and transition into the multicell, as presented in Fig. 6. We focused on the multi-parameter radar analysis by examining the Zdr and Kdp columns that are beneficial in evaluating the stage of multicell development. In addition, the peak of vertical vorticity analysis was investigated to verify the criterion index from the previous study. SC1 and SC2 showed the highest intensity for Kdp as shown in Fig. 6b and not presented at Zdr as presented in Fig. 6a. The new cell developed at the south-western part from the core of Zh in SC1. The horizontal wind distribution with radar reflectivity and vertical vorticity at 2 km of CAPPI height are presented in Fig. 6c and d.
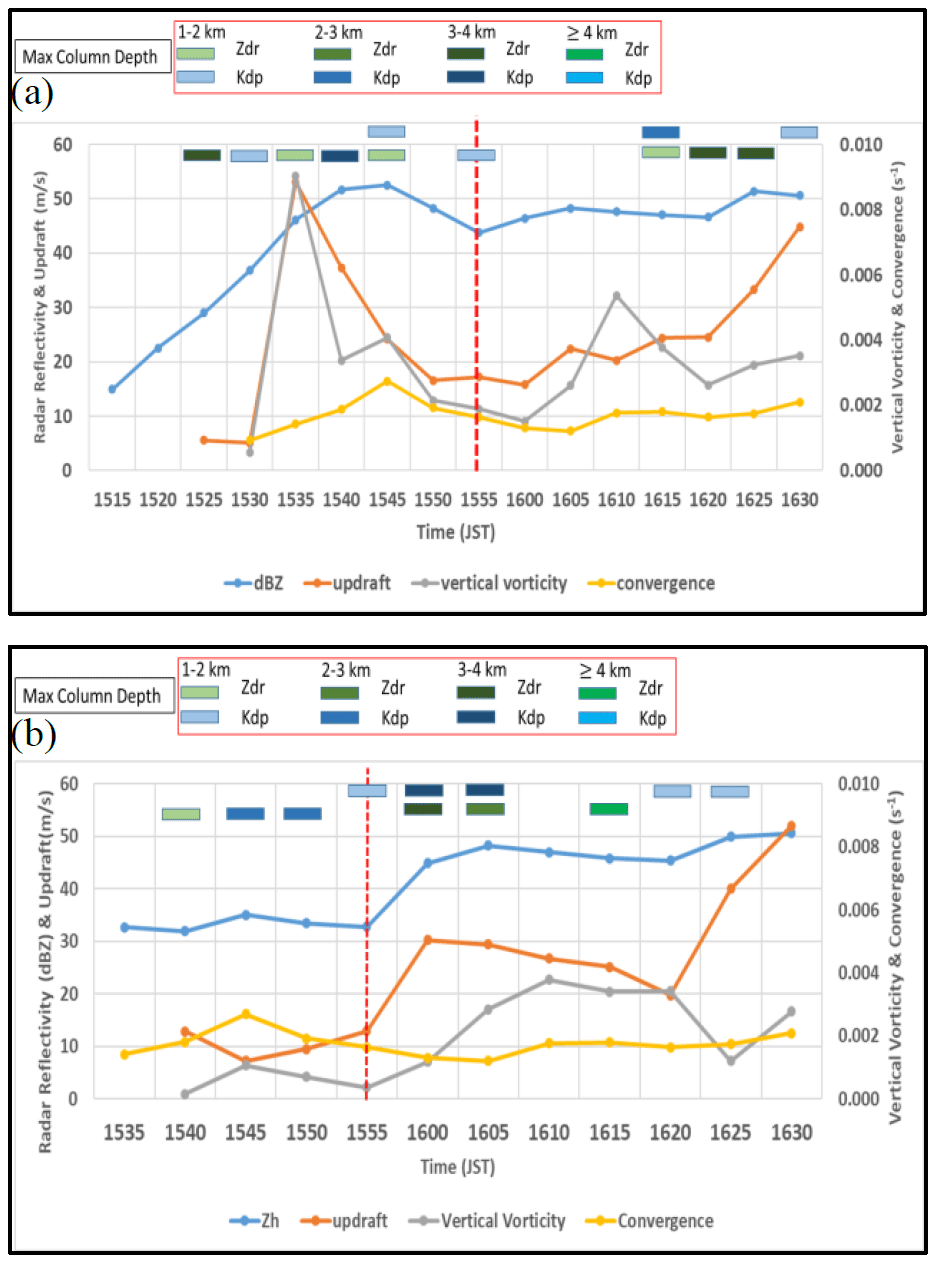
Figure 7Time-series of averaged maximum reflectivity, updraft and convergence for the entire storm volume and at maximum vertical vorticity: (a) for SC1, (b) for SC2.
In the meantime, the peak intensity of vertical vorticity of single-cell before transition into multicell was varied according to the influence of convergence and updraft that was supplied into the single-cell development as shown in Fig. 7. However, it was discovered that the peak core vorticity could be attained at 0.04 s−1, which indicated the transition from single-cell to multicell in this study. As presented in Fig. 7a, the maximum Zdr column (3–4 km) existed with similar time of updraft indicated that SC1 developed more intense as the peak updraft occurred 10 min after the development. The maximum Kdp column existed after 5 min of peak updraft, but a signature pattern that could be observed during the transition with maximum Kdp column of 1 km existed at 15:55 JST. As shown in Fig. 7b, the maximum column depth of Zdr existed similar time with the peak updraft, with the highest column discovered at 16:15 JST, 15 min before the peak of updraft in the multicell. The Kdp column always existed in the single cell and multicell, however, the signature patterns during transition similar with SC1, which maximum Kdp column of 1 km discovered in this analysis.
The results indicated that the maximum Kdp column was always identified before and after cells merging, which 1 km of Kdp column always existed during transition from single-cell to multicell. Meanwhile, the maximum Zdr column was discovered after 5 min of the transition. On average, the maximum height of both columns was revealed at 3 km, at the most, from the melting level. The analysis proved that in the transition of single-cell to multicell, updraft frequently developed in the multicell formation with a strong updraft. The extended Zdr and Kdp columns showed mainly the above melting level height with a similar position to the updraft formation. These results were similar to a previous study (van Lier-Walqui et al., 2016), which proved that both Zdr and Kdp columns could be used to identify the updraft and correlated well with the intensity. We could examine the transition from single-cell to multicell results presented that the convergence mostly developed before the initiation of the updraft, and the peak of updraft intensity occurred consistent with the period of core vorticity for both cells. The convergence and updraft strength mainly affected the core vorticity intensity.
In conclusion, the study of transition signals from single-cell to multicell discovered that single-cell revealed a peak of core vorticity intensity after merging with pre-existing cells. The core vorticity was examined between each single-cell and multicell by applying the pseudo-vorticity and DDA methods, in which the core vorticity was defined as the maximum of positive vorticity and the minimum of negative vorticity. The results showed that the average of core vorticity in the single-cell before merging was 0.002 s−1 for DDA, and 0.02 s−1 for pseudo-vorticity analysis. This technique revealed that the peak of core vorticity intensity was mainly discovered after the cells merged. Both DDA and pseudo-vorticity found these patterns, and the study showed that the average core vorticity intensity of single-cell to multi-cell was 0.004 and 0.04 s−1 for DDA and pseudo-vorticity, respectively. The findings from multi-parameter radar analysis revealed that Kdp is a useful proxy for deep convection updrafts since the life stages of multicell formation is controlled by the updraft and cells merging mainly related to the stronger updraft and downdraft of moist air in the presence of precipitation. In particular, Zdr above melting height is a useful indicator of the early appearance of deep convection. The vertical vorticity and both Zdr and Kdp columns analysis provided an insight into the transition from single-cell to multicell development, which is beneficial in the detection of severe weather resulting in flash floods.
The code can be provided by the corresponding authors upon request.
The data that support the findings of this study are available under the Data Integration and Analysis System (DIAS), which was developed and operated by a project supported by the Ministry of Education, Culture, Sports, Science and Technology. Restrictions apply to the availability of these data, which were used under license for this study. Data is available at https://auth.diasjp.net/cas/login (DIAS, 2022) with the permission of the DIAS Secretariat.
FA, KY, EN contributed to the design and implementation of the research; FA analyzed the data; FA, KY, EN, TU wrote the manuscript draft; all authors discussed the results and commented on the manuscript.
At least one of the (co-)authors is a guest member of the editorial board of Proceedings of IAHS for the special issue “ICFM9 – River Basin Disaster Resilience and Sustainability by All”. The peer-review process was guided by an independent editor, and the authors also have no other competing interests to declare.
Publisher's note: Copernicus Publications remains neutral with regard to jurisdictional claims made in the text, published maps, institutional affiliations, or any other geographical representation in this paper. While Copernicus Publications makes every effort to include appropriate place names, the final responsibility lies with the authors.
This article is part of the special issue “ICFM9 – River Basin Disaster Resilience and Sustainability by All”. It is a result of The 9th International Conference on Flood Management, Tsukuba, Japan, 18–22 February 2023.
The authors express their sincere gratitude to Shingo Shimizu from the National Research Institute for Earth Science and Disaster Resilience (NIED), Tsukuba, Japan for the thoughtful discussions and for providing useful suggestions with the software developed regarding Dual Doppler radar analysis. Fauziana Ahmad acknowledges the award of the Malaysian Public Service Department Training (HLP) scholarship allowing the research to be undertaken.
This research has been supported by the Japan Society for the Promotion of Science (grant nos. 15H05765 and 20H02258).
This paper was edited by Tomoki Ushiyama and reviewed by two anonymous referees.
Browning, K., Frankhauser, J., Chalon, J., Eccles, P., Strauch, R., Merrem, F., Musil, D., May, E., and Sand, W.: Structure of an Evolving Hailstorm Part V: Synthesis and Implications for Hail Growth and Hail Suppression, Mon. Weather Rev., 104, 603–610, 1976.
DIAS: Data Integration and Analysis System (DIAS) [data set], https://auth.diasjp.net/cas/login (last access: 31 July 2022), 2022.
Hirano, K. and Maki, M.: Method of VIL calculation for X-band polarimetric radar and potential of VIL for nowcasting of localized severe rainfall – Case study of the Zoshigaya downpour, Scientific Online Letters on the Atmosphere, 6, 89–92, https://doi.org/10.2151/sola.2010-023, 2010.
Kato, A. and Maki, M.: Localized heavy rainfall near Zoshigaya, Tokyo, Japan on 5 August 2008 observed by X-band polarimetric radar: Preliminary analysis, Scientific Online Letters on the Atmosphere, 5, 89–92, https://doi.org/10.2151/sola.2009-023, 2009.
Kim, D., Maki, M., and Shimizu, S.: X-band Dual-Polarization Radar Observations of Precipitation Core Development and Structure in a Multicellular Storm over Zoshigaya, Japan, on August 5, 2008, J. Meteorol. Soc. Japan, 90, 701–719, 2012.
Kumjian, M. R. and Ryzhkov, A. V.: Polarimetric Signatures in Supercell Thunderstorms, J. Appl. Meteorol. Climatol., 47, 1940–1961, 2008.
Masuda, A. and Nakakita, E.: Development of a technique to identify the stage of storm life cycle using X-band Polarimetric Radar, J. Hydraul. Eng., 70, 493–498, 2014 (in Japanese).
Nakakita, E., Nishiwaki, R., Yamabe, H., and Yamaguchi, K.: Research on the prognostic risk of baby cell for guerilla-heavy rainfall considering by vorticity with doppler velocity, The Journal of Japan Society of Civil Engineers, 69, 325–330, 2013.
Nakakita, E., Sato, H., Nishiwaki, R., Yamabe, H., and Yamaguchi, K.: Early Identification of Baby-Rain-Cell Aloft in a Severe Storm and Risk Projection for Urban Flash Flood, Adv. Meteorol., 2017, 5962356, https://doi.org/10.1155/2017/5962356, 2017.
Nishiwaki, N., Misumi, R., Shimizu, S., Maesaka, T., Iwanami, K., Sakurai, N., Maki, M., Suzuki, S., Kato, A., and Yamaji, A.: Behavior and structure of convective clouds developing around a mountainous area observed by stereo photogrammetry and Ka-band and X-band radars: Case study of northern Kanto, Japan, J. Meteorol. Soc. Japan, 91, 609–626, 2013.
Shimizu, S., Uyeda, H., Moteki, Q., Maesaka, T., Takaya, Y., Akaeda, K., Kato, T., and Yoshizaki, M.: Structure and Formation Mechanism on the 24 May 2000 Supercell-Like Storm Developing in a Moist Environment over the Kanto Plain, Japan, Mon. Weather Rev., 136, 2389–2407, 2008.
Shusse, Y., Tsuboki, K., Geng, B., Minda, H., and Takeda, T.: Structure and Evolution of Deeply Developed Convective Cells in a Long-Lived Cumulonimbus Cloud under a Weak Vertical Wind-Shear Condition, J. Meteorol. Soc. Japan, 83, 351–371, 2005.
Van Lier-Walqui, M., Fridlind, A. M., Ackerman, A. S., Collis, S., Helmus, J., MacGorman, D. R., North, K., Kollias, P., and Posselt, D. J.: On Polarimetric Radar Signatures of Deep Convection for Model Evaluation: Columns of Specific Differential Phase Observed during MC3E, Mon. Weather Rev., 144, 737–758, 2016.
Vasiloff, S. V., Brandes, E. A., Davies-Jones, R. P., and Ray, P. S.: An Investigation of the Transition from Multicell to Supercell Storms, J. Appl. Meteorol. Climatol., 25, 1022–1036, 1986.
Westcott, N. E.: Merging of Convective Clouds: Cloud Initiation, Bridging, and Subsequent Growth, Mon. Weather Rev., 122, 780–790, 1994.