the Creative Commons Attribution 4.0 License.
the Creative Commons Attribution 4.0 License.
 | 23 Jul 2024
How to avoid heavy life losses in Liulin-like flash flood events
Changzhi Li
Miao Zhang
Qing Li
Bingshun He
From 11 to 12 August 2021, an extreme rainstorm attacked the Liulin Town, a very common town in Hubei Province, China. The rainstorm triggered flash flood and caused heavy live losses. This study first conducted an analysis on the causes of the flash flood disaster, then, performed a simulation to review the flash flood process, and finally discussed the technical strategies and approaches to avoid life losses in similar cases. The main understandings include: (1) accumulative rainfall of shorter interval and time-sliding is significantly helpful to improve warning accuracy; (2) flash flood risk needs to be evaluated at catchment scale and making room for floods is necessary; (3) residential buildings threatened by flash floods need to rebuild some structures for live-saving in emergency circumstances; and (4) early warning system needs to have capabilities to collect real basin-wide rainfall and flood information, especially in case of rainstorm, and to be smart to judge hazard level.
- Article
(5035 KB) - Full-text XML
- BibTeX
- EndNote


Flash flood is one of the main flood disasters. Globally, the mountain and hill cover about 30 % of the land area and heavy casualties and property losses result from flash flood each year with climate change (Edenhofer et al., 2012). From 1949 to 2021, more than 53,600 flash flood events attacked China. The Chinese government attaches great importance to flash flood disaster mitigation, and by years of persistent works, especially a nation-wide flash flood disaster management project implemented from 2013 to 2016, flash flood disaster mitigation systems have developed including main components of flash flood monitoring and early warning at national and county levels, accountability system, mass detection and prevention, and suitable structural works, which have greatly reduced the life losses due to flash floods at national level. However, On 12 August 2021, a heavy rainstorm flash flood attacked the Liulin Town, Hubei Province, China, resulting in heavy life losses (YRWG, 2021), which exposed some weaknesses in current flash flood mitigation. This article replayed this flash flood event, with objective of reviewing lessons and experiences, to avoid losses caused by similar disasters.
2.1 Langhe River Basin
Liulin Town, attacked by the flash flood, locates in the Langhe River Basin. Langhe River originates at Dayanjiao, flows through Liulin Town, Hedian Town, Zengdu District, Xihe Town, Suizhou High-tech Zone, and finally pours into the Fuhuan River. This catchment takes a fan shape in the upper reaches of Liulin Town, with drainage area 26.4 km2, basin slope 0.225, basin relief 376 m, relief ratio 0.035, elongation ratio 0.542, and drainage density 1.99 km km−2. The main channel is 10.7 km long with channel slope 2 %. The Langhe River can be roughly divided into the following three sections: (1) section in the upper reach of Liulin Town, with 150–250 m wide valley and mild channel slope; (2) section from Dayanjiao to Liulin Town, with several tributaries perpendicularly pouring into, mainly, Jinyin Creek, Lianhua Creek at the left bank, Taiping Creek and Baishuwan Creek at the right bank, and other 15 creeks into the mainstream or the tributaries; and (3) section from the lower reach of Liulin Town to the tail of Baiguohe Reservoir, with 70–100 m wide valley, obviously, narrower than that in the upper reach areas. Therefore, the Liulin Town lies in a slightly closed storage area, as shown in Fig. 1.
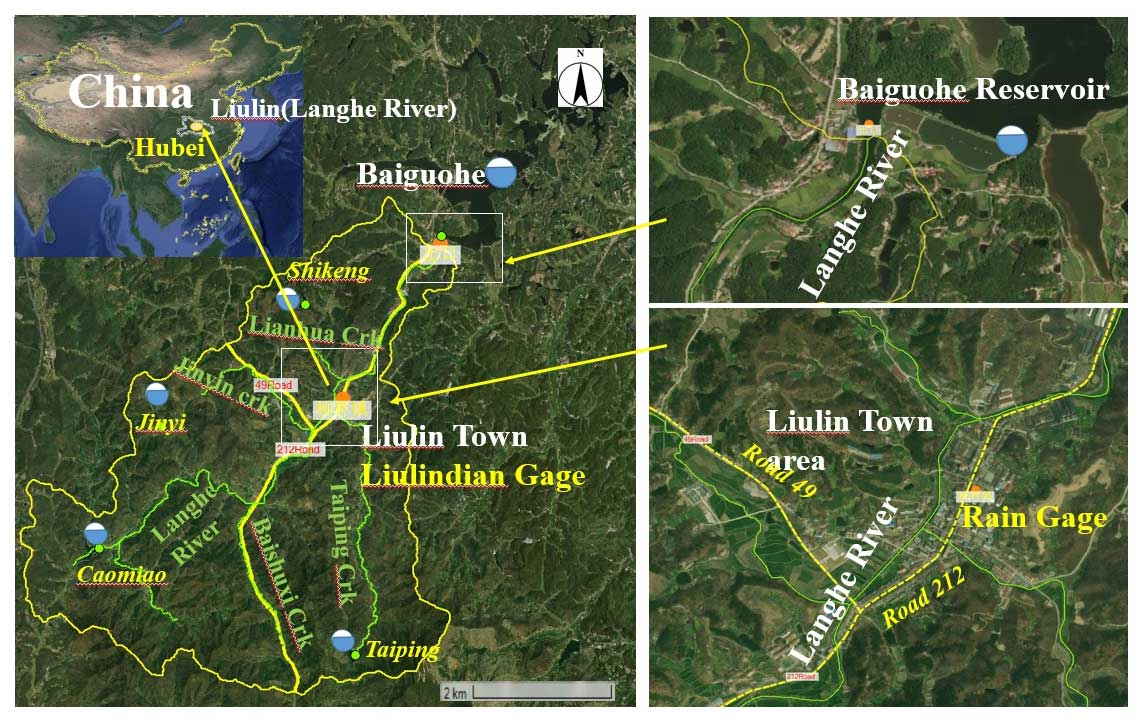
Figure 1Schematic of the Langhe River Catchment.
2.2 Liulin Town
Liulin Town, with a total population over 22 000 in 2020, is a low-mountain-hilly area. This Town is located at the bottom of a slightly closed wide and gentle valley in the Langhe River basin, surrounded by mountains on three sides, with good conditions of water conferencing, valley downstream narrowing, and low flood conveyance capacity. According to outputs of this Town of national flash flood disaster management project, implemented during 2013 to 2016, the Daqiao Street belongs to the area of very high-level flash flood risk (high population density without structures) while the Dayanjiao village is the area of high-level flash flood risk (moderate population density without structures).
2.3 Flood control structures
There are four small-sized reservoirs, Jinyin, Caomiao, Taiping and Shikeng, in the upper reaches of Liulin Town in this catchment, and one medium-sized reservoir, Baiguohe Reservoir, in the lower reaches of the town. Two reservoirs, Caomiao and Baiguohe, are in the main stream of the River, and the others in the tributaries (see Fig. 1).
Moreover, according to the local flood control plan, levees with standard of 10 years return period should be built on both sides of the Long River flowing through the Liulin Town. However, only part of the river dredging was completed when the flash flood event occurred.
2.4 Flash flood facilities
A county level flash flood early warning system has been developed in the Suixian County which has the capabilities of collecting real-time rainfall amount from rain gages within this county and releasing early warning once the rainfall depth exceeds the rainfall thresholds. As for the Liulin Town, the rain gage in the Dayanjiao Village and a warning broadcast in the Daqiao Street is component of this system. Moreover, each of the 4 small reservoirs mentioned above has a rain gage, but none of them transmits rainfall data to the early warning system. Totally, there are 5 rainfall gages in this catchment.
3.1 Rainstorm
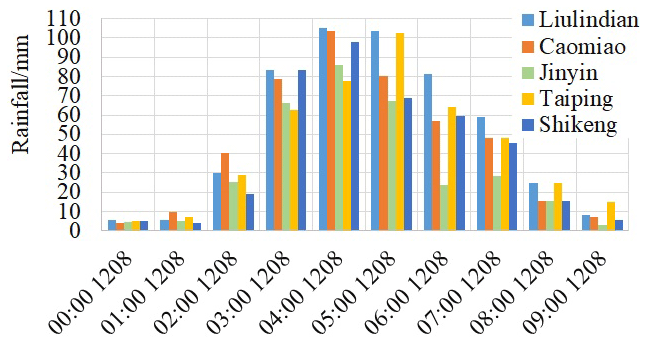
According to the rainfall records from the five rain gages, from 20:00 LT, Beijing Time, 11 August to 20:00 LT, 12 August, the maximum rainfall depths for 10 min, 1, 3, 6 and 24 h reached 23.0, 105.4, 277.5, 439, and 485.0 mm, respectively. And all of maximal rainfall depths of these typical durations occurred at the Liulindian Gage. Specially, Liulindian Gage has 2 h (03:00–05:00 LT) of rainfall depths exceeding 100 mm (YRWG, 2021). The rainfall hydrograph of the 5 rain gages indicates that a heavy rainstorm covered the whole catchment in the upper reach of the Baiguohe Reservoir (see Fig. 2) during this period.
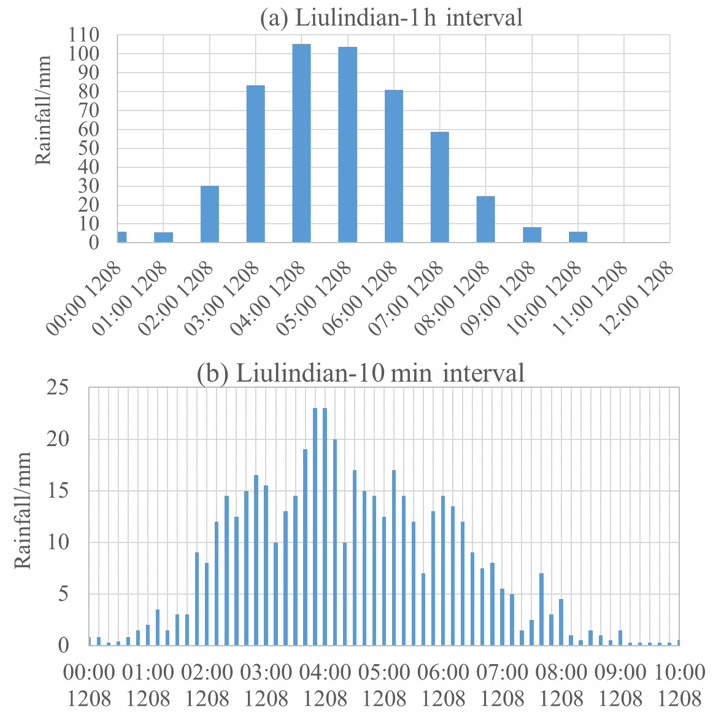
Given a small drainage area of this catchment, and nearest to the centre of the catchment, the rainfall hydrograph of the Liulindian Gage has been significantly representative in the whole basin, hence, rainfall processes of 1 h interval and 10 min interval of this Gate were used to perform rainfall flood analysis, see Fig. 3.
3.2 Catchment terrain
Based on the watershed boundary with 100 m buffer, DEM data (5 m resolution) was clipped using GIS software to obtain the data for creating catchment terrain model. In the terrain model, no special considerations were taken for the four small-sized reservoirs. The reason is that the spillways of these reservoirs take form of free overflow, and all of them locates in the upstream areas with very small drainage area compared with the whole basin, and all of them operated normally during the event.
3.3 Flash flood simulation
The simulation for flash flood was completed using 2-D shallow water equations, with rainfall hydrograph as the upper boundary condition and the whole river basin as the calculation area. The main considerations for flash flood simulation are as follows.
3.3.1 Mesh generation
In view of the valley's width in the main areas of interest in the catchment (150–250 m in the upstream valley of Liulin Town, and 70–100 m of the downstream valley), meshes of 30 m × 30 m were generated for common computation areas, and 15 m × 15 m for key computation areas, and two control sections were set up in the upper and lower reaches closing to Liulin Town to obtain flood hydrograph, a boundary line was set as lower boundary condition at the outlet of the basin (the tail of the Baiguohe Reservoir). The channel slope of this section was measured as 0.005 according to DEM data. Given the Baiguohe Reservoir having a total volume capacity of 46.22 million m3, and can be reckoned as a large water body, normal water depth was adopted as the lower boundary in the hydrodynamic model, see Fig. 4.
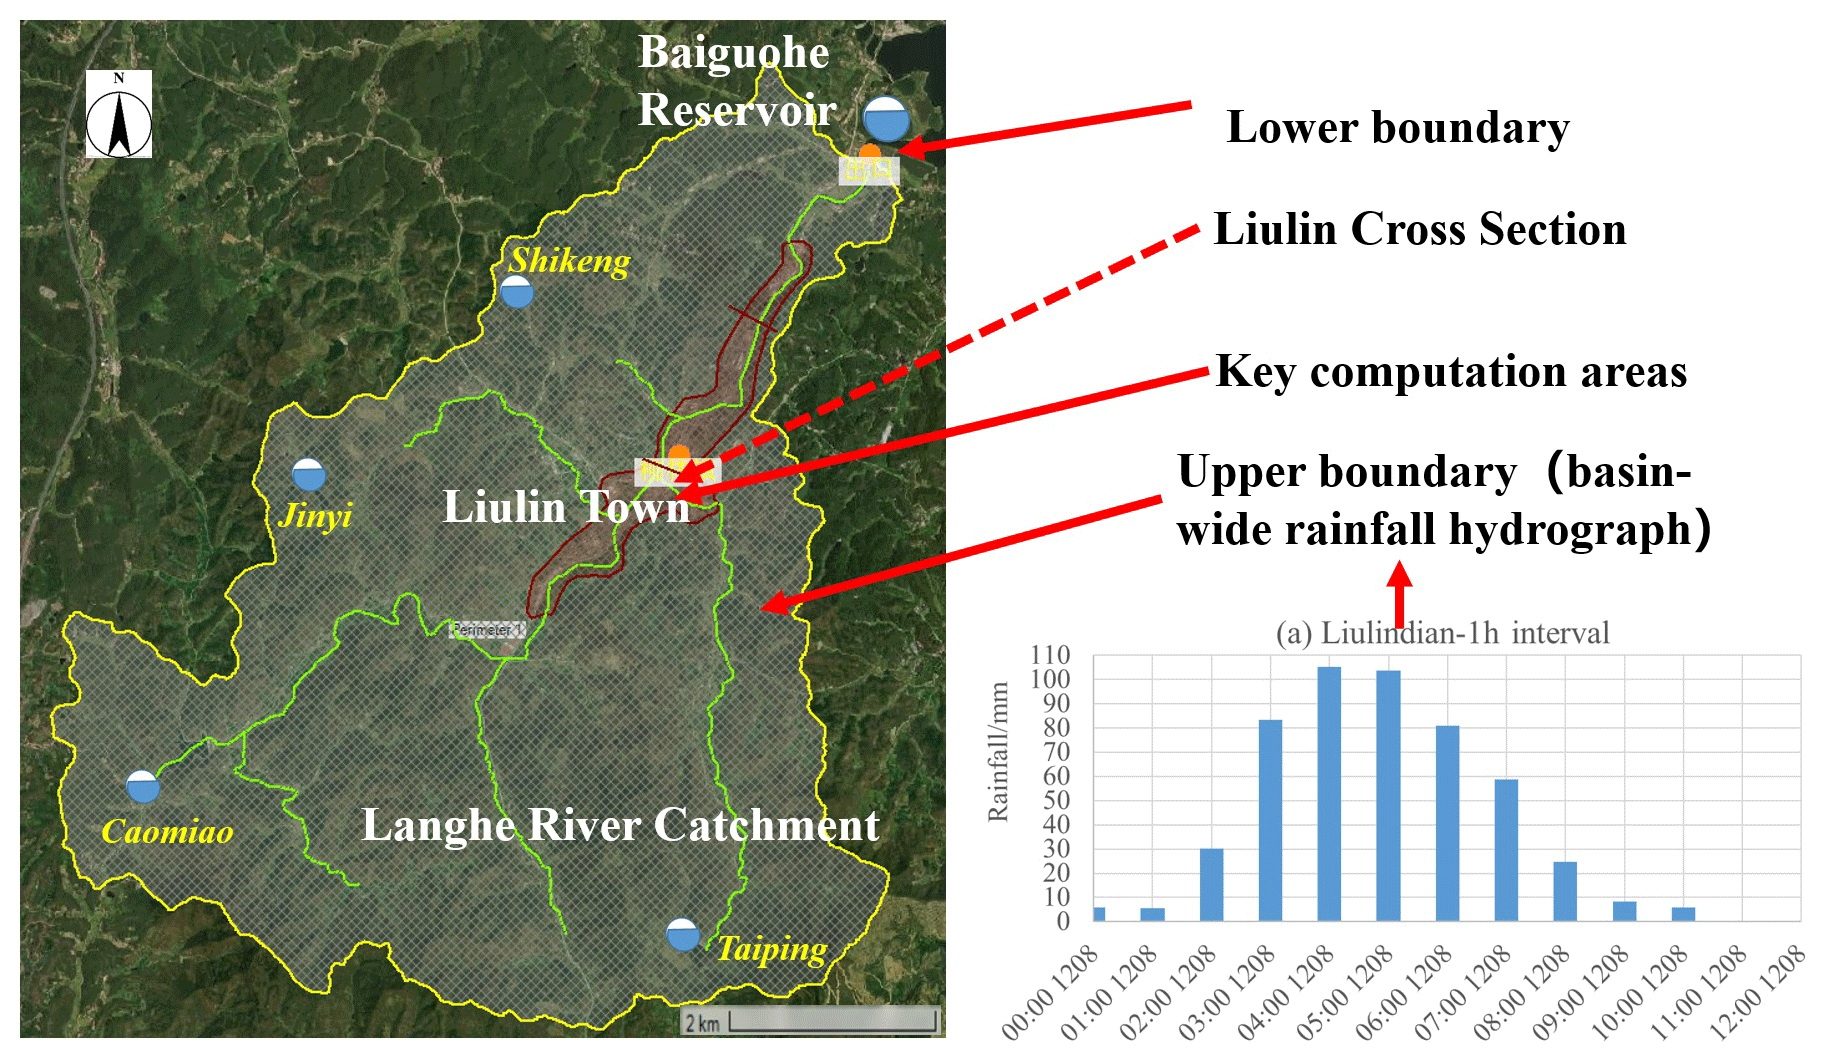
Figure 4Catchment-wide model for rainfall-flood simulation.
3.3.2 Flood calculation
Flood calculation was performed for each grid, and its algorithms include horizontal and vertical directions as follow (USACE, 2020).
Horizontal direction
Continuous equation:
Momentum equations:
in which, t: time, s; H, h: water elevation and water depth, ; u, v: velocity component in xy direction, m s−1; q: source and sink, m2 s−1; ρ: density of water, kg m−3; g: gravitational acceleration, m s−2; vxxvyy: coefficients of horizontal viscosity in x y direction, m2 s−1; cf: friction coefficient at river bottom; τs: wind stress at surface kg m−1 s−2; f: coefficient of Coriolis force.
Vertical direction
The input at vertical direction of the grid is the rainfall while the loss is the soil infiltration. In this rainstorm flash flood event, rainfall occurred in a very concentrated and short time, and the soil type of the underlying consists mainly of loam soil and clay, soil infiltration is very minor comparing with the rainstorm depth, and was not considered in the model.
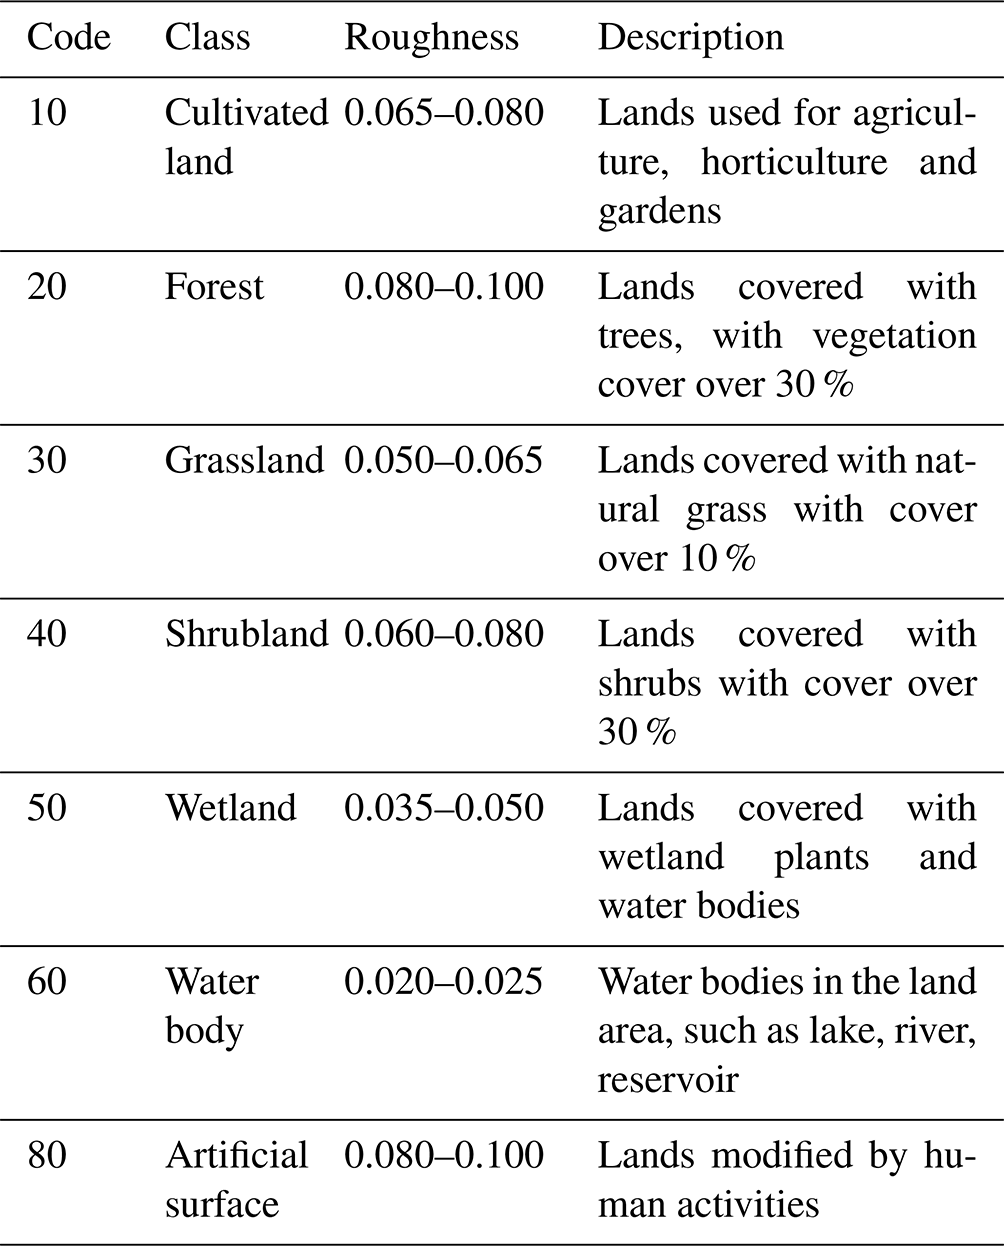
3.3.3 Friction
Friction is related to the surface roughness that usually described using land cover. This basin is covered mainly by cultivated land, forest land, grassland, wetland, water body and artificial surface, correspondingly, the roughness coefficients for friction are compositely estimated according to the river channel, the composition of land cover class. Table 1 presents the values of roughness coefficient for typical land cover classes in the model.
3.3.4 Calibration
A site investigation was conducted to identify the flash flood process, in which, the peak discharge was calculated using Manning's formula and the process was deduced using instantaneous unit hydrograph approach with interval of 0.5 h based on local rainfall-flood manual, and Fig. 5 presents the flood hydrographs from the investigation and the simulation at the upper control section of the Liulin Town. Obviously, both are in good agreement with each other in terms of flood peak discharge, rising limb, and falling limb. In addition, most of the simulated water depth in the town area ranged between 3.0–3.5 m, which is also consistent with the results from site investigation. Therefore, the simulated results are reliable to be used for further analysis.
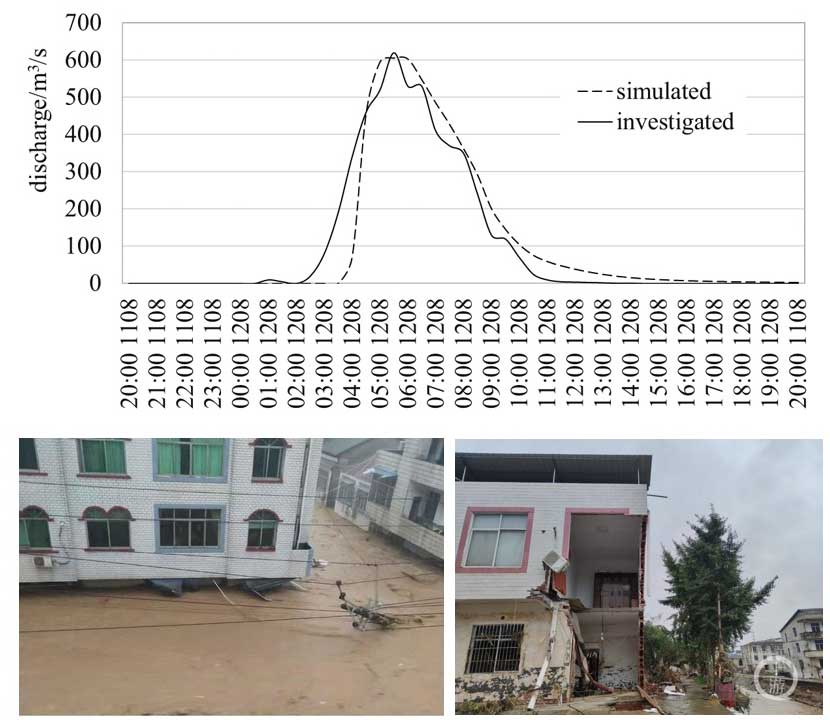
Figure 5Simulated and investigated flood hydrographs well matched in flood peak discharge, rising limb and falling limb.
4.1 Influence of time intervals of rainstorm
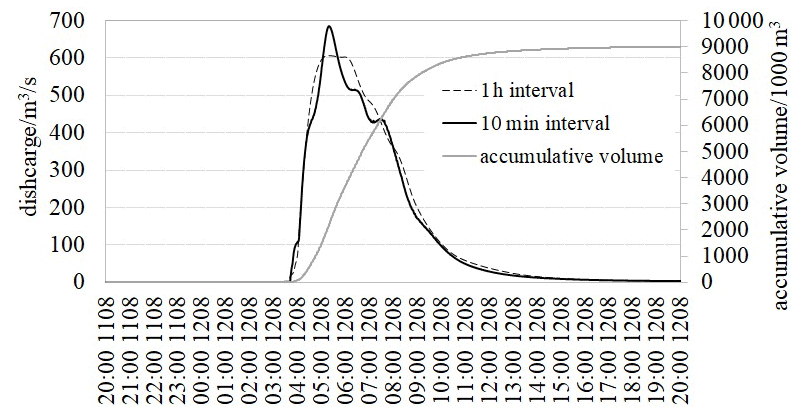
Flood process was simulated according to the rainfall process of two intervals (1 h and 10 min) at Liulindian Gage, and Fig. 5 presents the results at the upper cross section of Liulin Town. Here, one can see that in this event, with same total rainfall amount, the flood peak discharge of a rainstorm with 10 min interval is 80 m3 s−1 larger than that with 1 h interval, and the increasement reaching 13 %. In fact, the rainfall process with 1 h interval has more homogenization than that with 10 min interval, which reduces the flood peak discharge to a certain extent. See Fig. 6.
Currently, most flash flood early warnings are issued based on rainfall thresholds at an hourly clock time, however, a very strong rainstorm within 60 min crossing an hourly clock time may be heavily cut off and averaged, which probably lead to neglecting a real rainfall depth exceeding the threshold of 1 h, then missing early warning in a timely way. Therefore, a sliding analysis was performed for the rainfall records with various intervals (10, 20, 30, 40 and 50 min) at the 5 gages, as shown in Table 2, where, at a same hourly clock time, the data are the differences between the recorded and the sliding values. Obviously, the differences are significant, and sliding is necessary for rainfall threshold determination.
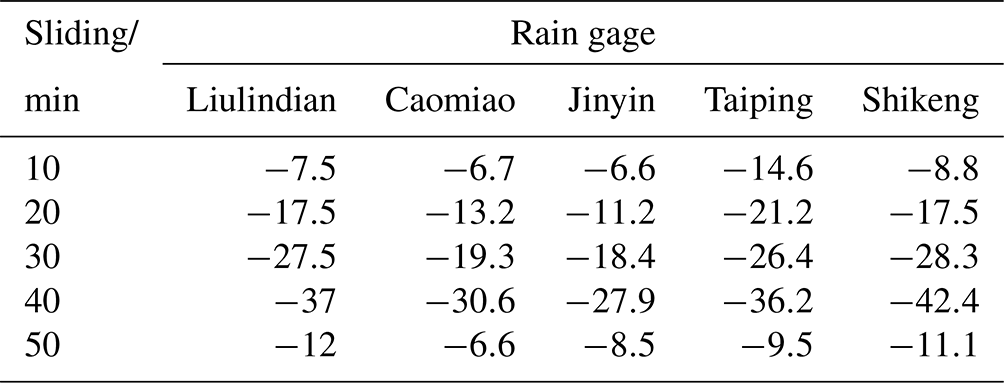
Currently, most rain gage has the capability to record rainfall each 5 min, so it is feasible to provide rainfall data of 10 min time interval for flash flood early warning, which will be significantly helpful to improve early warning.
4.2 Flood peak discharge and flood control capacity
The bankful discharge of the Langhe River section along the Liulin Town is only 250 m3 s−1, which was significantly exceeded in this flash flood event, with flood peak discharge 640 m3 s−1, and flood volume (24 h) about 9.2 million m3 (YRWG, 2021). The simulation provides peak discharges of 606 and 686 m3 s−1, and accumulative flood volume of 9.08 million m3 (see Fig. 6). due to the special terrain of this catchment and the location of the Liulin Town, floods can easily form in a short time and rise rapidly at the town once heavy rainfall occurs. Moreover, some spaces for floods have been occupied step by step in this town which significantly amplified and worsen the disaster if extreme flood comes. Many researches indicate that due to climate change, the possibility of extreme rainstorm is increasing globally and will bring about more unexpected extreme floods (Abbs and Rafter, 2009; Trenberth, 2011; Bates and Westra, 2013). Therefore, for towns with similar locations like the Liulin Town, special and enough attention needs to be paid to room for floods.
4.3 Flood formation, evolution and early warning
The main process of flood formation at Liulin Town are as follows: 03:30 LT, 12 August, flood water level began to rise and peaked at 05:10 LT, about 610 m3 s−1, deduced by Manning's formula; flood peaked for about an hour and started to decline at 06:20 LT. And flood rose rapidly during 03:00 to 04:00 LT, 12 August. According to the site investigation, the best time for emergency evacuation was very short, from 03:40 to 04:20 LT, because the ground floors of Liulin Town along the river was completely flooded within less than 40 min. In fact, none of the 4 rain gages at reservoirs has been connected to the early warning system and delivered real information of catchment-wide rainstorm to the system during the flash flood event. In other words, how dangerous the rainstorm has not been conveyed to the exposures in a timely way, and the precious-lifesaving leading time was wasted in vain, even those existing handy facilities were easily available. Therefore, it is urgent and necessary to collect and integrate rainfall-flood information at the catchment scale, based on the location of towns or villages.
4.4 Water depth and flow velocity
According to the simulation, the inundation depth in most areas of Liulin Town ranges among 3.0–3.5 m. And Fig. 7 shows the simulated inundation depth scenarios. As can see that Liulin Town was almost completely inundated, except a few houses on the highland. In this figure, the yellow lines are provincial level road (Road 212 and Road 49). Road 212 runs through the Liulin Town and became a temporary conveyance way during the flood, and houses on both sides were flooded and water level reached the top of ground floor (see Fig. 5).
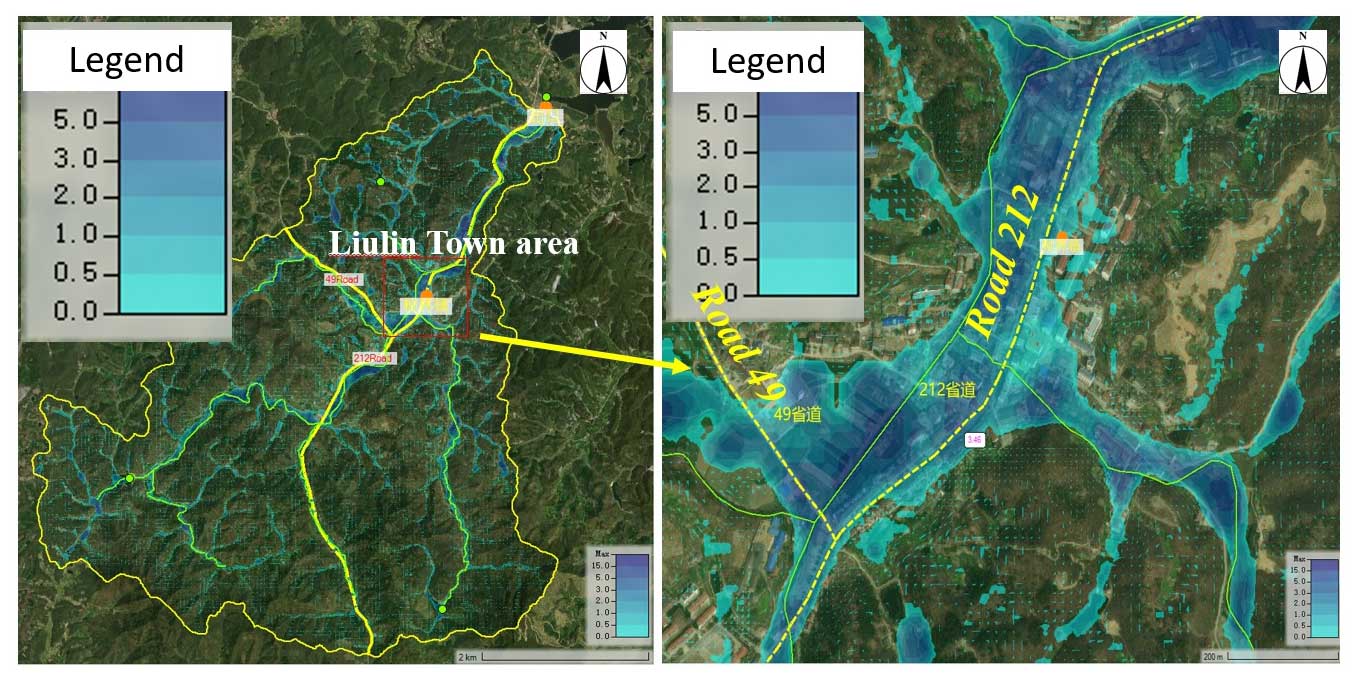
Figure 7Flood depth during the flash flood.
As for flood velocity, Fig. 8 presents the distribution of maximum flood velocity in Liulin Town, where the speeds in the flooded areas varies greatly, ranging among 1–5 m s−1 in most areas, and reaching up 7 m s−1 in some steep areas. Moreover, the flood speeds along Road 212 were generally among 3–5 m s−1, and some areas up to 7 m s−1.
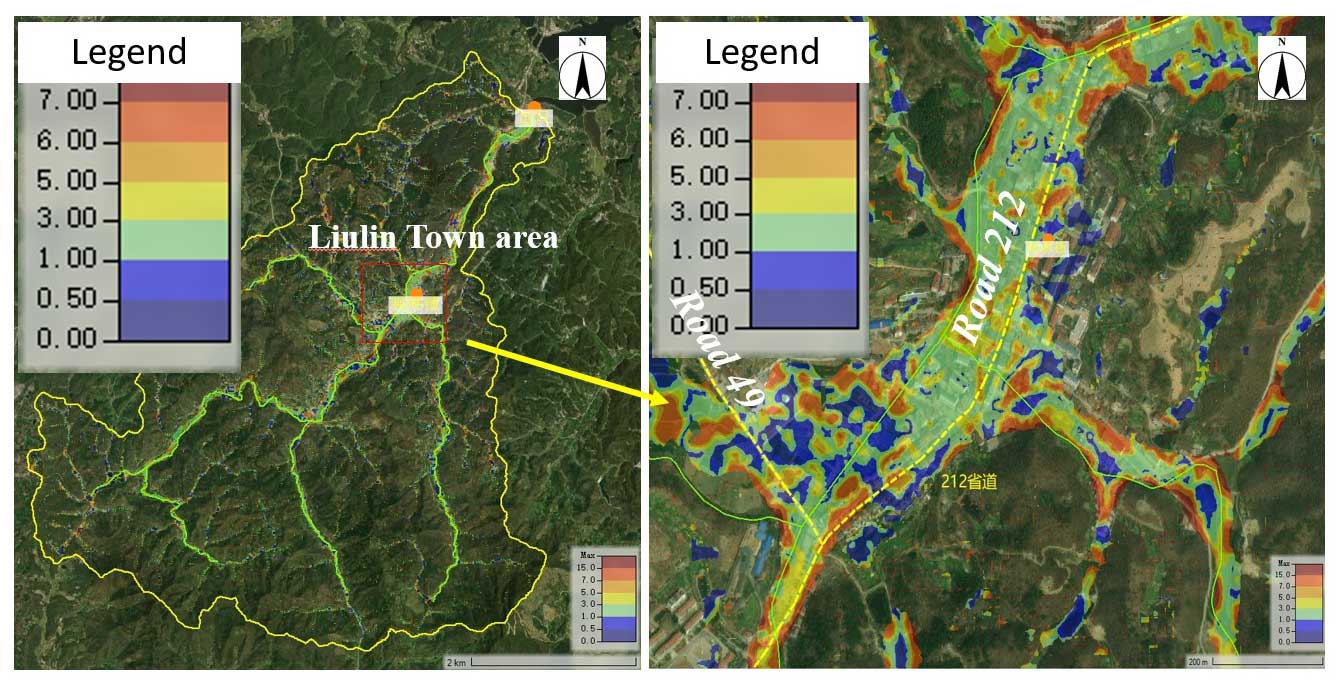
Figure 8Flow velocity during the flash flood.
According to the above analysis on flood depth and velocity, two points need to be strengthened to improve public awareness of flash flood risk: (1) studies (Smith et al., 2014; Wang et al., 2019) indicate that people or cars in flood with deep flood depth and high velocity are very dangerous (see Fig. 9), so, no one should take any chances to evacuate in flash flood, but keep away from it as far as possible; (2) in terms of permanent buildings closing to the river threatened by flood, indoor vertical evacuation passages, such as indoor upstairs and downstairs, should be considered below the third floor, and the authors strongly suggest it should be involved in building codes. In this event, most people were killed indoor by flood water, because they have no indoor vertical evacuation channels, and could not open the rolling gates due to high water pressure, let alone reaching the outdoor staircases to move to high places.
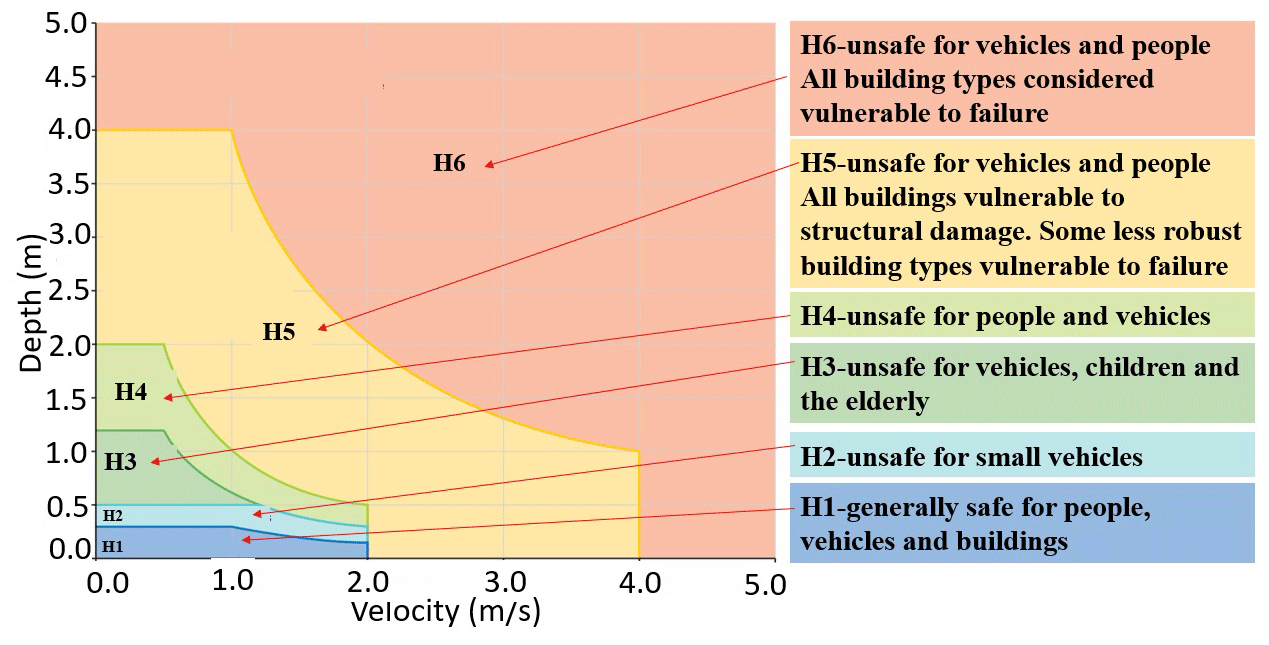
Figure 9Combined Flood Hazard Curves (Smith et al., 2014).
Taking the flash flood disaster in Liulin Town as an example, this paper discussed the causes of flash flood disaster in the Liulin Town, performed simulation on the flood using shallow water equations, and then, combined with the specific situation of the Langhe River Basin, discussed the influence of time intervals of rainstorm, the flood peak discharge and flood control capacity, flood process and early warning, flood depth and velocity of flood and flash flood risk, rainfall process interval and flood peak, with purpose of finding technical strategies and approaches to mitigate disasters for similar cases. The main conclusions are as follows:
-
The early warning system should adopt a sliding accumulation rainfall with a finer time interval to improve the accuracy of early warning.
-
The Liulin Town is surrounded by mountains on three sides and located at the bottom of a slightly closed valley. The downstream valley of this town is narrow and the flood conveyance capacity is not so high, and some room for flood has been occupied by human actions. For towns at similar locations in catchment like the Liulin Town, it is necessary to evaluate flash flood risk at catchment scale and to make enough room for floods.
-
Flash floods are characterized by high depth and rapid flow, therefore, in addition to timely evacuation, residents threatened by flash floods need to rebuild some necessary structures for live-saving in emergent situations, such as indoor vertical evacuation passages, which should be encouraged in building codes and can save lives at some extreme cases.
-
Currently, most of rain gages are usually installed in or near residential sites for the sake of operability of both installation and maintenance, which often results in inadequate, even no access to rainfall amount in upstream areas of a catchment. It is necessary to collect and integrate real rainfall and flood information to the early warning system in time at catchment scale, especially in case of rainstorm; moreover, the system needs to be smart enough to give a judgement on the hazard level based on the rainfall depth and tensity.
All of the simulation in this paper was done based on HEC-RAS software, a free and publicly available software.
All of the underlying research data in this study were from the Report for “8.12” Flash 35 Flood Disaster in Liulin Town, Hubei Province, China, which was investigated by the Yangtze River Work Group and submitted to the Ministry of Water Resources, PRC. This report is not publicly accessible.
CL: conceptualization, supervision, funding acquisition, writing – review & editing; MZ: data curation, formal analysis, writing – original draft preparation; QL: validation, visualization; and BH: funding acquisition, resources.
The contact author has declared that none of the authors has any competing interests.
Publisher's note: Copernicus Publications remains neutral with regard to jurisdictional claims made in the text, published maps, institutional affiliations, or any other geographical representation in this paper. While Copernicus Publications makes every effort to include appropriate place names, the final responsibility lies with the authors.
This article is part of the special issue “ICFM9 – River Basin Disaster Resilience and Sustainability by All”. It is a result of The 9th International Conference on Flood Management, Tsukuba, Japan, 18–22 February 2023.
This research has been supported by the project of the Ministry of Science and Technology of the People's Republic of China (grant no. 2019YFC1510700) and IWHR Project “Theoretical and Technical Exploration on Flash Flood Mitigation and Control”.
This paper was edited by Miho Ohara and reviewed by two anonymous referees.
Abbs, D. and Rafter, T.: Impact of Climate Variability and Climate Change on Rainfall Extremes in Western Sydney and Surrounding Areas: Component 4 – dynamical downscaling, Report to the Sydney Metro Catchment Management Authority and Partners, CSIRO, PMB No 1, Aspendale, Victoria, 3195, 81 pp., 2009.
Bates, B. and Westra, S.: Climate Change Research Plan - Summary. Report for Institution of Engineers Australia, Australian Rainfall and Runoff Guideline: Project 1, Engineers Australia Water Engineering, https://arr.ga.gov.au/__data/assets/pdf_file/0016/40570/ARRCCS_ResPlan_Summary_17Jan2013.pdf (last access: 9 November 2022), 2013.
Edenhofer, O., Pichs-Madruga, R. Y., Sokona, V., Barros, C. B., Field, T., Zwickel, S., Schloemer, K., Ebi, M., Mastrandrea, K., Mach, C., and von Stechow, C.: Workshop Report of the Intergovernmental Panel on Climate Change Workshop on Socio-Economic Scenarios, IPCC Working Group III Technical Support Unit, Potsdam Institute for Climate Impact Research, Potsdam Germany, 51 pp., 2012.
Smith, G. P., Davey, E. K., and Cox, R. J.: Flood Hazard, UNSW Australia Water Research Laboratory, Technical Report 2014/07, 2014.
Trenberth K. E.: Changes in precipitation with climate change, Clim. Res., 47, 123–138, https://doi.org/10.3354/cr00953, 2011.
USACE (US Army Corps of Engineers): HEC-RAS Hydraulic Reference Manual, CPD-69, https://www.hec.usace.army.mil/ publications/ (last access: 5 October 2022), 2020.
Wang, J., Li, N., and Wang, S.: Review on flood hazard assessment index and grade classification, China Flood and Drought Management, 29, 21–26, https://doi.org/10.16867/j.issn.1673-9264.2019213, 2019 (in Chinese).
YRWG (Yangzte River Work Group): Report for “8.12” Flash Flood Disaster in Liulin Town, Hubei Province, China, YRWG (Yangzte River Work Group), MWR, China, 48 pp., 2021 (in Chinese).