the Creative Commons Attribution 4.0 License.
the Creative Commons Attribution 4.0 License.
 | 19 Apr 2024
Study on a flood damage reduction countermeasure by installing a spillway on a riverine levee for promoting the initiative of River Basin Disaster Resilience and Sustainability by All
Osamu Itagaki
Miho Ohara
Toshio Koike
In light of the frequent occurrence of unprecedented heavy rains and floods attributable to climate change effects, the importance of the “River Basin Disaster Resilience and Sustainability by All” initiative is being emphasized and promoted strongly in Japan. For promoting discussions on a wide range of countermeasures for flood damage reduction by the initiative, this paper presents a trial estimation result of quantitative flood damage reduction effect by spillway installation on a riverine levee in a protected area where severe flood disasters have occurred in recent years. The result shows that the countermeasure considerably reduce the flooded area, the days required for drainage, and house flood depths. Results also indicate that the average annual damage to paddy fields in the area can be expected to decrease, although the inundation frequency will increase.
- Article
(3095 KB) - Full-text XML
- BibTeX
- EndNote


In response to an unprecedented increase in torrential rains and floods due to the impact of climate change associated with global warming, it is necessary to accelerate the development of flood control structures, as well as, for example, land use regulation, and community resilience enhancement. It emphasizes the need for “River Basin Disaster Resilience and Sustainability by All” (Ryuuiki-chisui) initiative aimed at sustainable development through building a resilient society prepared for water disasters, such as devising ways to live, evacuating in the event of a disaster, reducing economic damage, and swift recovering and reconstructing after a disaster.
This study aims to provide material for promoting discussion on a wide range of countermeasures for flood damage reduction through the initiative by presenting a trial estimation result of quantitative flood damage reduction effect by spillway installation on a riverine levee in a protected area. This kind of damage mitigation measures include “Nokoshi”, a measure with lowering a part of a levee system to avoid severe damage such as destruction of an irrigation weir downstream, which has been recorded since the Edo period (from 17 to 19 century) in Japan (Tanabe and Okuma, 2001), and the “Managed Overtopping” of the US Army Corps of Engineers (US Army Corps of Engineers, 2019). This research is conducted on a trial basis in one of the areas where severe floods occurred in recent years.
2.1 Classification of flood damage reduction countermeasures
Figure 1 shows the classification of countermeasures (including risk tolerance) based on two axes: flood scale/recurrence period and scale of hazard (flood depth at each location etc.). “Risk tolerance” refers to cases in which no countermeasures are taken based on the recurrence period of a disaster etc., and “Low-frequency severe flood countermeasures” refers to countermeasures against floods that have a long recurrence period but are expected to cause severe damage when they do occur. In the figure, the left-pointing arrows indicate that the recurrence period of heavy rainfall is shortened due to climate change, and the recurrence period of flooding is shortened.

Figure 1Classification of flood countermeasures according to flood scale and the hazard scale (modified from Itagaki et al., 2022).
The above-mentioned installing a spillway to reduce damage by reducing the flood water volume is considered to be one of the low-frequency severe flood countermeasures, and are considered to be countermeasure options to bridge the gap between the development of flood control structures (level 1 countermeasures) and the protection of human lives through evacuation (level 2 countermeasures). They are damage prevention and mitigation countermeasures (so to speak, level 1.5 countermeasures) that fill the gap, including not only lives but also assets and livelihoods.
2.2 Study method for countermeasures to reduce flood water volume into protected areas
Figure 2 shows the procedure for examining countermeasures to reduce the flood water volume into the protected area. In the following chapter, some items are omitted due to space limitations.
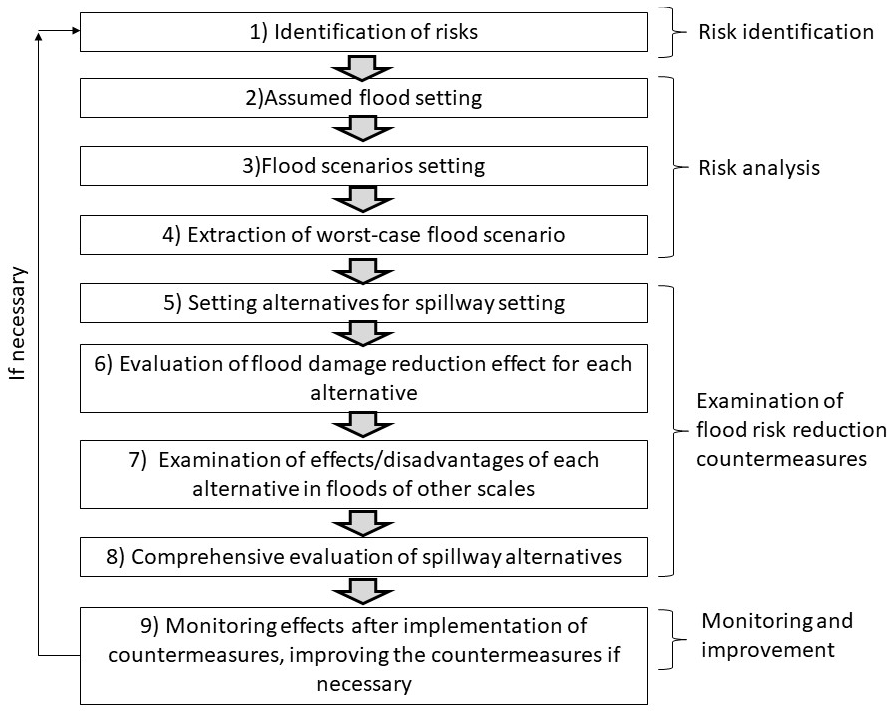
Figure 2Procedure for examining spillway installation in riverine levee system (Itagaki et al., 2022).
3.1 Overview of trial examination area
Figure 3 shows an area where trial examination is conducted. The Tsuruta-gawa River in the Takagi-gawa River system siphons across the Yoshida-gawa River in the Naruse-gawa River system.
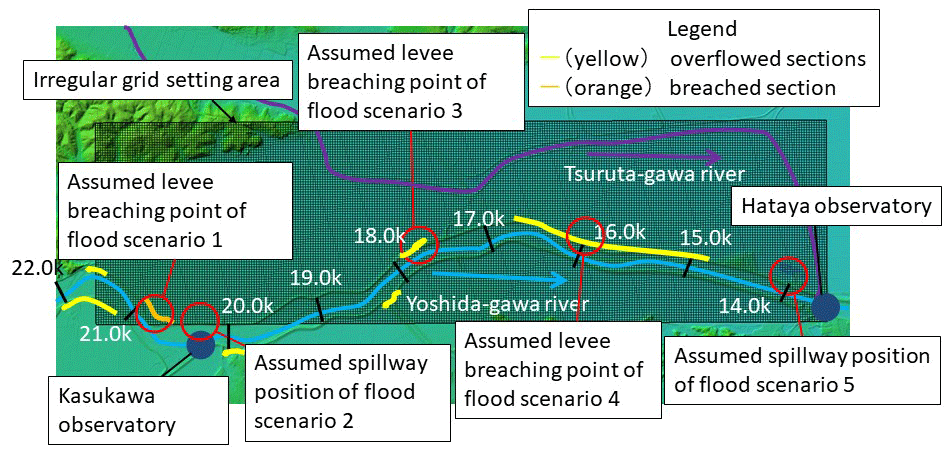
Figure 3Trial application area (Itagaki et al., 2022). * Created by iRIC, using the Geospatial Information Authority color-coded elevation map as the background (same for Figs. 5, 6, and 7).
The trial application area is about 2.1 km × 7.4 km, and the riverbed slope of the series of reaches including the reaches within the area is about for the Yoshida-gawa River and about to for the Tsuruta-gawa River.
In the flood caused by Typhoon No. 19 (East Japan Typhoon) in 2019 (hereinafter referred to as “Actual Flood”), farmlands were submerged and it took 12 d for drainage, and residential houses were flooded near the ceiling of the first floor and some residents moved out after the disaster.
3.2 Setting flood scenarios
Figure 3 shows overflowed sections of the Yoshida-gawa River during Actual Flood (yellow indicates overflowed, orange indicates levee breached after overflow) (Naruse-gawa River Levee Investigation Committee, 2020). The maximum overflow depth was about 0.4 m at the levee breach point (near 20.9 kp (kilo meter post)). Based on assumed levee breach points on the left bank of the Yoshida-gawa River based on the major overflowed sections during Actual Flood, and the options for levee breach prevention measures in Sect. 3.5, a group of flood scenarios (conditions of flood into the protected area) were set as shown in Table 1. Figure 4 shows the flood simulation procedure, and Fig. 5a shows the flood simulation result of flood scenario 1 (reproduction simulation of Actual Flood).
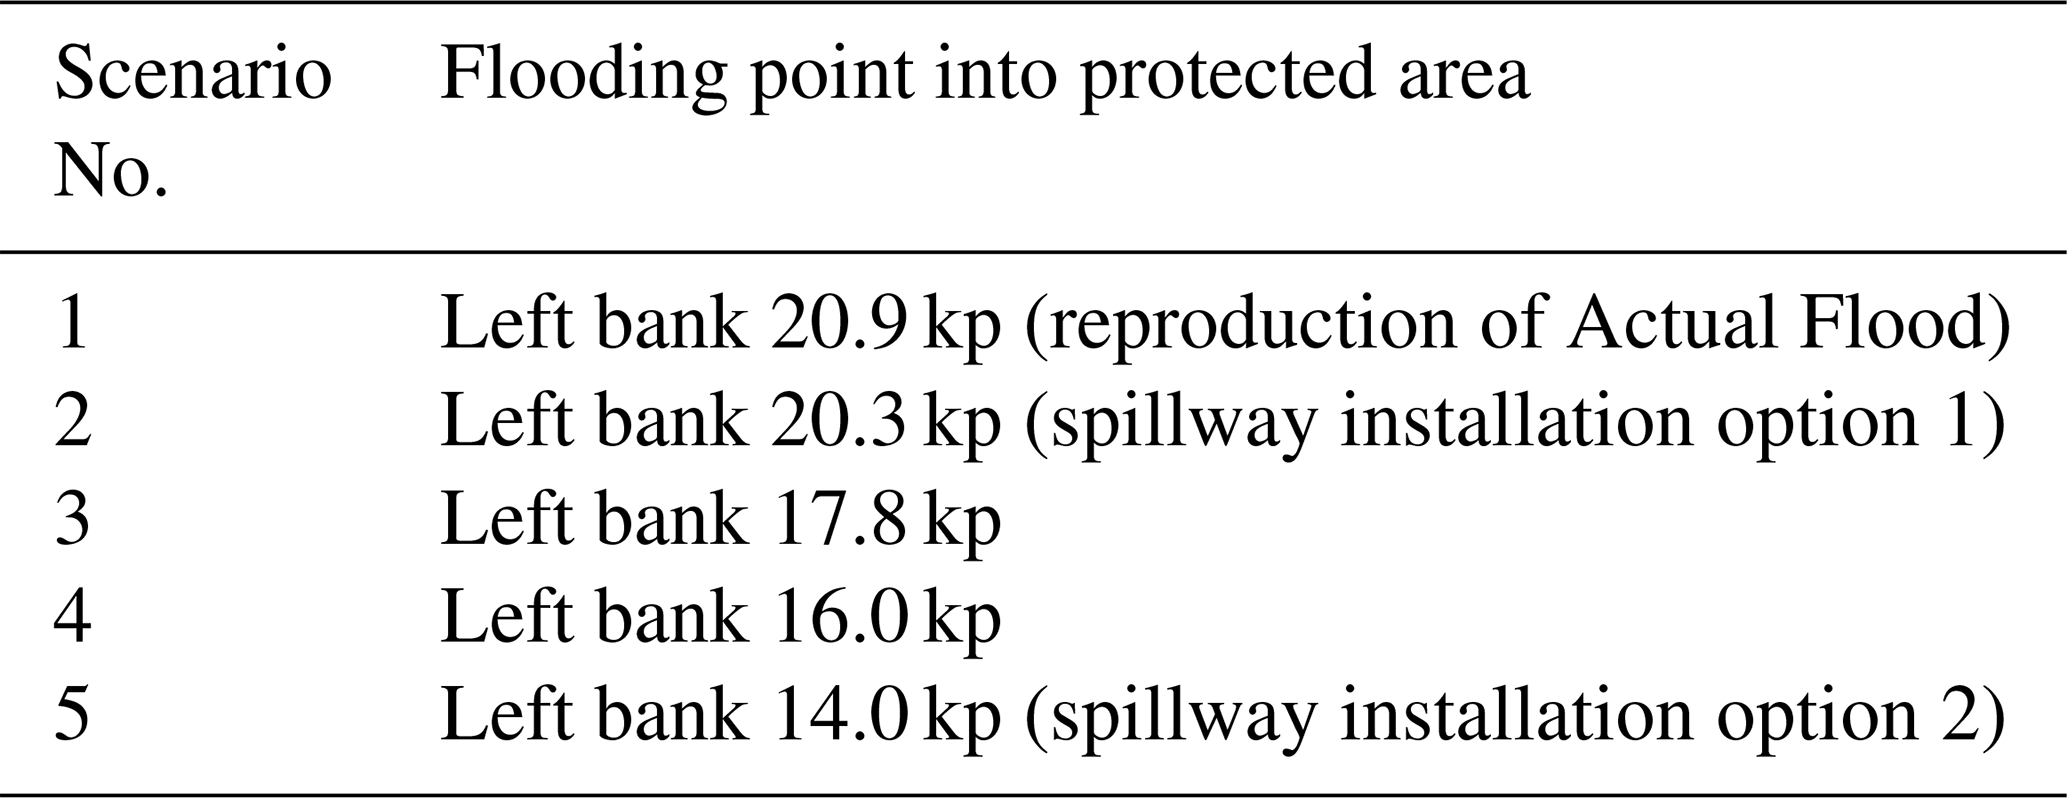
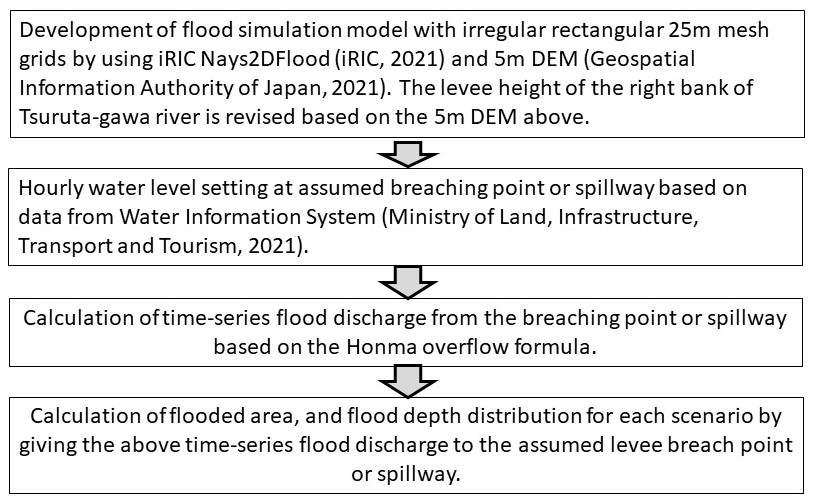
Figure 4Flood simulation procedure (Itagaki et al., 2022).
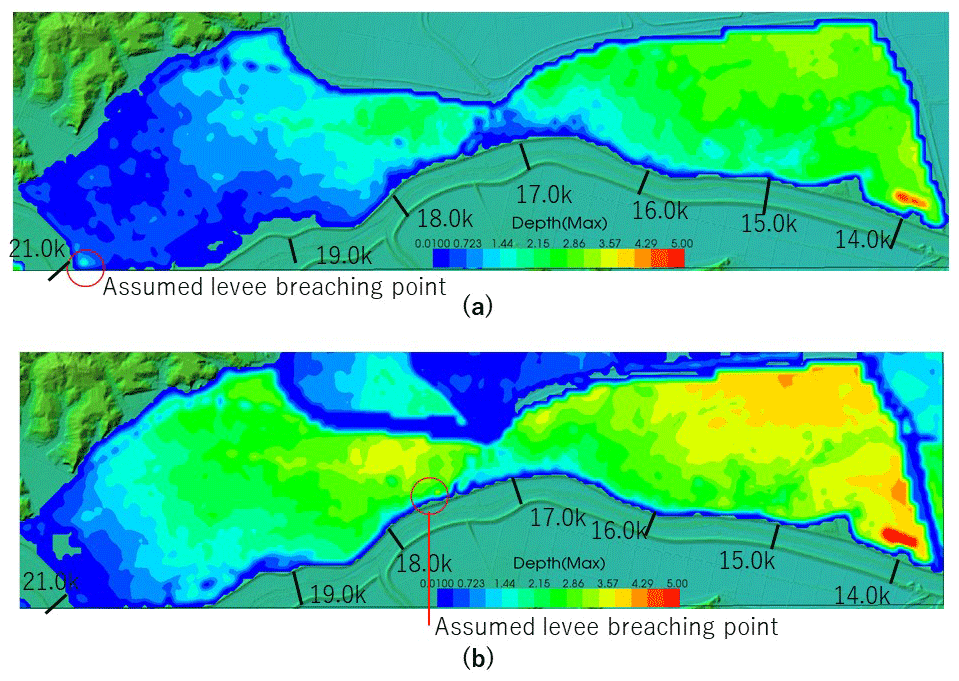
Figure 5Maximum inundation depth distribution ((a) flood scenario 1, (b) flood scenario 3) (Itagaki et al., 2022).
3.3 Verification of flood simulation accuracy
A visual comparison between estimated inundation depth distribution map by Geospatial Information Authority of Japan and Fig. 5a reveals no significant difference in the extent and the maximum depth of inundation in the area between the Yoshida-gawa River and Tsuruta-gawa River. When comparing the trace inundation depth (12 points) (2019 Typhoon No. 19 Flood Disaster Survey Team, Hydraulic Engineering Committee, Japan Society of Civil Engineers, 2020) (Umeda, 2019) with the maximum inundation depth of the flood simulation result of scenario 1, the difference between the two was about 0.2 to 1.8 m, and the average absolute value of the difference was about 0.85 m. The difference between the two is large near embankments, near the levee breach point, and at points where the ground height is about 1 m higher than the surrounding area. The number of days required for drainage was 14 d in flood scenario 1, and the difference from the actual 12 d was 17 %. Here, the number of days required for drainage is roughly estimated by simply dividing the flood water volume in the protected area by the drainage capacity, based on the drainage capacity of the existing drainage pump station near 14.0 kp on the left bank of the Yoshida-gawa River, which is 8.5 m3 s−1.
3.4 Extraction of worst case scenario
Comparing flood scenarios 1, 3 (Fig. 5b), and 4 (omitted), scenario 3 exhibits the largest flooded area, and scenario 4 the maximum flood depth. Therefore, flood scenarios 3 and 4 are the worst flood scenarios among these three scenarios, 3 for flooded area and 4 for the maximum flood depth.
3.5 Setting countermeasure options for flood water volume reduction
By installing a spillway whose crest height is equal to the design high water level of Yoshida-gawa River with water energy dissipator, part of river water will flow into the area protected by the levee, and the water level of the Yoshida-gawa River will be lowered. Countermeasures to prevent overflowing from levees other than the spillway as much as possible were examined. In this trial examination, based on local hearings, the target is set to avoid flooding above the floor of residential houses, and reduce the number of days required for drainage to 3 d or less.
It is also assumable that human damage can be reduced by extending the time from overflow to levee breach by introducing overflow-resilient levees (crisis management-type hardware countermeasures) across the entire levee system, but there could be an argument for downstream risk transfer. In addition, since the method of evaluating the functioning of overflow-resilient levees is still under study, we did not treat it as an option in this paper. Besides, we think that it is not realistic to replace the entire levees of the Yoshida-gawa River with a length of about 8 km in the area with spillways, because a vast area will be required for installing water energy dissipators on both banks.
Option 1 was set to install a spillway directly downstream of the village on the left bank near the upper end of the Yoshida-gawa River in the area, and option 2 to install a spillway near the lower end of the Yoshida-gawa River in the area, where the lowest elevation in the area. Here, the width of the spillway (length in the downstream direction of the Yoshida-gawa River) was set at 50 m (see Itagaki et al., 2022).
Figure 6 shows the flood simulation result for each option. In both cases, the inundation area and depth were smaller than those of scenarios 1, and 3.

Figure 6Maximum inundation depth distribution of spillway installation options ((a) option 1 (scenario 2), (b) option 2 (scenario 5)) (Itagaki et al., 2022).
3.6 Comprehensive evaluation of countermeasure options for flood water volume reduction
In option 2 (in parentheses for option 1), the inundation area during Actual Flood was reduced to about 34 % (82 %) of the minimum inundation area among flood scenarios 1, 3, and 4, and the maximum flood depth was reduced to about 57 % (54 %). In addition, while the number of days required for drainage was 14 to 25 d for scenarios 1, 3 and 4, it was significantly shortened to about 2 d for option 2, approximately 86 % reduction (5 d for option 1, approximately 64 % reduction).
Comparing inundation depths of residential houses inside the white dashed line on the right side of Fig. 6b between scenario 1 and scenario 5 (spillway installation option 2), the latter decreased by about 2 m compared to the former. In other words, even in places where the flood depth was such that near the ceiling of the first floor of the house was submerged during Actual Flood, it is possible to reduce the damage to subfloor flooding level by raising the height of the residential land by about 1 m in addition to the spillway installation.
The disadvantage of this countermeasure is that the installation of the spillway increases the frequency of water overflowing into the protected area. In order to grasp this concretely, we simulated the maximum inundation depth distribution of a flood with a peak water level higher than the design high water level by 0.6 m that is the half of 1.2 m which is the difference between the design levee height and the design high water level (Fig. 7). The result showed that the number of days required for drainage was only about one day.
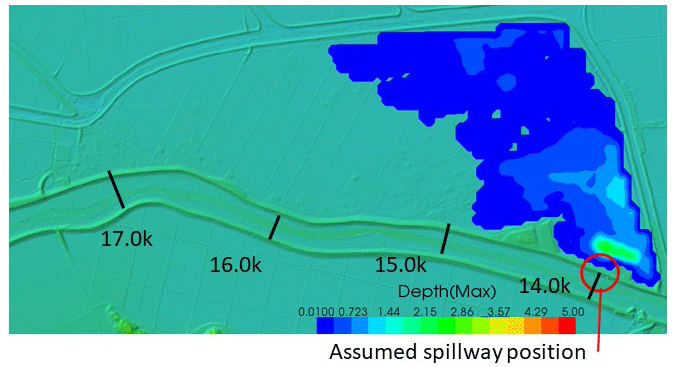
Figure 7Maximum inundation depth distribution of flood with peak water level of 0.6 m higher than the design high water level, spillway installation option 2 (Itagaki et al., 2022).

Figure 8Comparison of adaptability to climate change (Itagaki et al., 2022).
In addition, the annual exceedance probability for each assumed flood was roughly evaluated based on annual maximum water level data at each observatory (Ministry of Land, Infrastructure, Transport and Tourism, 2021), and the expected annual damage to crops was roughly estimated (assuming uniform paddy rice fields, without considering damage by sedimentation, damage to houses, agricultural facilities, roads, etc.). The expected annual damage was reduced to about of the minimum expected annual damage among flood scenarios 1, 3, and 4. Finally, with using a diagram of the effect of countermeasures (the diagram shows the increase in damage due to the impact of climate change by flood return period) (Climate Change Adaptation Research Group, NILIM, MLIT, 2017), we compared the existing levee system and spillway installation option 2 on the degree of adaptation to the impact of climate change. In Fig. 8, the same scale of flood damage is assumed when the flood scale is larger than Actual Flood, and is indicated by dashed lines. Due to the impact of climate change, the flood recurrence period (the recurrence period of Actual Flood based on the observed water level data at Hataya observatory station is roughly estimated to be about 265 years) will be shortened. Besides, we do not enter into the discussion of how much the recurrence period is shortened, but we assumed that the relationship curve would simply shift to the left. Figure 8 shows the case where the recurrence period of Actual Flood is shortened to about 100 years. These years correspond to the positions where the curve rises from the horizontal axis. The increase in damage in option 2 is significantly reduced compared with scenario 3, the largest damage scenario among scenarios 1, 3, and 4.
The effect of lowering the water level of the Yoshida-gawa River at the time of Actual Flood by installing a spillway (about option 2 which is more effective than option 1) in the trial application area is as follows:
-
Maximum overflowing depth is reduced by approximately 0.25 m from approximately 0.39 m (estimated from nearby water level observations) to approximately 0.14 m.
-
The length of the section where the water level exceeds the design levee crest height has been shortened by approximately 3.8 km from approximately 6 km to approximately 2.2 km.
-
The duration of overflowing was shortened by about 1 h and 50 min from about 4 h to about 2 h and 10 min.
It is estimated that the maximum overflowing depth among the sections where water overflowed during Actual Flood but not breached was about 0.36 m, and the duration of overflow was about 3 h (Naruse-gawa River Levee Investigation Committee, 2020). Therefore, by installing a spillway, both the depth and duration of overflow are reduced to below those in the above-mentioned non-breach sections. In addition, by raising the height of some residential lands by about 1 m, the target of preventing over-floor flood damage can be achieved. Besides, it is important to make the levee resilient against overflow, because great uncertainty cannot be avoided in the functioning of the levee when the river water level exceeds the design high water level.
Besides, it is essential to equalize the damage burden by supporting the raising of houses and roads to reduce flood damage in areas where the frequency of inundation increases.
Based on the results of this research, we would like to continue to promote concrete discussion on potential countermeasures for flood damage reduction by River Basin Disaster Resilience and Sustainability by All initiative.
Code is available at https://i-ric.org/solvers/nays2dflood/ (iRIC, 2021).
Data is available at https://fgd.gsi.go.jp/download/menu.php (Geospatial Information Authority of Japan, 2021) and http://www1.river.go.jp/ (Ministry of Land, Infrastructure, Transport and Tourism, 2021).
Conceptualization and validation were carried out by all three co-authors. Supervision was carried out by TK. Data curation, formal analysis, investigation, methodology, visualization, original draft preparation were carried out by OI.
At least one of the (co-)authors is a guest member of the editorial board of Proceedings of IAHS for the special issue “ICFM9 – River Basin Disaster Resilience and Sustainability by All”. The peer-review process was guided by an independent editor, and the authors also have no other competing interests to declare.
Publisher's note: Copernicus Publications remains neutral with regard to jurisdictional claims made in the text, published maps, institutional affiliations, or any other geographical representation in this paper. While Copernicus Publications makes every effort to include appropriate place names, the final responsibility lies with the authors.
This article is part of the special issue “ICFM9 – River Basin Disaster Resilience and Sustainability by All”. It is a result of The 9th International Conference on Flood Management, Tsukuba, Japan, 18–22 February 2023.
We would like to express our sincere gratitude to Makoto Umeda of Nihon University for providing the valuable field data, everyone involved in the Osaki City Flood-Resilient Urban Development Expert Council, and everyone from the Water and Disaster Management Bureau, and the National Institute for Land and Infrastructure Management of the Ministry of Land, Infrastructure, Transport and Tourism, Japan, for helpful discussions.
This paper was edited by Shinji Egashira and reviewed by two anonymous referees.
2019 Typhoon No. 19 Flood Disaster Survey Team, Hydraulic Engineering Committee, Japan Society of Civil Engineers: Report of 2019 Typhoon No. 19 Flood Disaster Survey Team (Tohoku area), Hydraulic Engineering Committee, Japan Society of Civil Engineers, Japan Society of Civil Engineers, 63, https://committees.jsce.or.jp/report/system/files/taifu19.pdf (last access: 8 March 2024), 2020.
Climate Change Adaptation Research Group, National Institute for Land and Infrastructure Management, Ministry of Land, Infrastructure, Transport and Tourism: Research on climate change adaptation in river & coastal management, Project Research Report of NILIM, No. 56, 201–203, ISSN 1880-0114, https://www.nilim.go.jp/lab/bcg/siryou/kpr/prn0056.htm (last access: 8 March 2024), 2017.
Geospatial Information Authority of Japan: 5m DEM, https://fgd.gsi.go.jp/download/menu.php, last access: 29 October 2021.
iRIC: Nays2DFlood, https://i-ric.org/solvers/nays2dflood/, last access: 29 October 2021.
Itagaki, O., Ohara, M., and Koike, T.: Study of flood damage reduction by spillway installation on a riverine levee in a protected area, J. Jpn. Soc. Hydrol. Water Res., 35, 325–338, https://doi.org/10.3178/jjshwr.35.1739, 2022.
Ministry of Land, Infrastructure, Transport and Tourism: Water Information System, http://www1.river.go.jp/, last access: 29 October 2021.
Naruse-gawa River Levee Investigation Committee: Naruse-gawa River Levee Investigation Committee report, 2-11–3-16, https://www.thr.mlit.go.jp/Bumon/B00097/k00360/saigai-info/2019_taihuu19gou/2006teiboutyousa_naruse.pdf (last access: 8 March 2024), 2020.
Tanabe, T. and Okuma, T.: The study on the roles and effects of “NOKOSHI” on the Jobaru-river Basin Example of flood control that allows overflowing and its future possibility, Historical Studies in Civil Engineering, 21, 147–158, https://doi.org/10.2208/journalhs1990.21.147, 2001.
Umeda, M.: 2019 Typhoon No. 19 trace flood water level data, 2019.
US Army Corps of Engineers: Managed overtopping of levee systems, Engineering and Construction Bulletin No. 2019-8, 12, https://wbdg.org/ffc/dod/engineering-and-construction-bulletins-ecb/usace-ecb-2019-8 (last access: 8 March 2024), 2019.
- Abstract
- Introduction
- Level 1.5 flood damage reduction countermeasures
- Experimental examination of countermeasure options to reduce flood water volume into protected areas
- Conclusions
- Code availability
- Data availability
- Author contributions
- Competing interests
- Disclaimer
- Special issue statement
- Acknowledgements
- Review statement
- References