the Creative Commons Attribution 4.0 License.
the Creative Commons Attribution 4.0 License.
 | 19 Apr 2024
Assessment of flood damage to agricultural crops under climate change scenarios using MRI-AGCM outputs in the Solo River basin of Indonesia
Badri Bhakta Shrestha
Mohamed Rasmy
Tomoki Ushiyama
Ralph Allen Acierto
Takatoshi Kawamoto
Masakazu Fujikane
Hiroyuki Ito
Takafumi Shinya
Understanding the effects of climate change on agricultural crops is an essential part of flood-risk management and adaptation measures. However, the quantitative impact of flood damage on agricultural crops under climate change is still not clearly understood. It is thus crucial to investigate flood damage to agricultural crops under climate change scenarios to understand future crop damage better. In this study, we first explored the relationship between extreme rainfall and damaged paddy area for a historical period, and then focused on the quantitative analysis of flood impact on rice crops under climate change using MRI-AGCM3.2S climate model outputs for the past (1979–2002) and future (2075–2098) climate periods for the Solo River basin in Indonesia. We developed a quantitative damage assessment method by coupling water and energy budget-based rainfall-runoff-inundation model outputs and a flood loss model. Flood damage to rice crops was defined as a function of flood depth and duration, and depth-duration-damage curves were applied to quantify the damage. The results show that flood damage to rice crops will be more severe in the future than in the past, and the findings can be useful in establishing risk reduction and adaptation measures.
- Article
(5264 KB) - Full-text XML
- BibTeX
- EndNote


Floods are the most frequently occurring natural disaster in many countries (Komolafe et al., 2019). Flood damage to crops causes significant economic losses and impacts food security and rural livelihoods, particularly in developing countries (Shrestha et al., 2016). Flood damage may be more serious in the future because of the increasing frequency and intensity of extreme weather events due to climate change. Therefore, understanding the impact of climate change on agricultural crops and quantitatively assessing flood damage to agricultural crops under climate change scenarios are essential for planning and implementing flood prevention and adaptation measures. However, the quantitative impacts of flood damage to agricultural crops and other sectors under climate change have not been clearly understood since they have spatially heterogeneous characteristics. Therefore, this study focused on the quantitative analysis of flood impact on rice crops under extreme climate change scenarios using atmospheric general circulation model (AGCM) outputs produced by the Meteorological Research Institute (MRI) (MRI-AGCM3.2S).
We selected the Solo River basin (SRB) in Indonesia for this study. First, we explored the relationship between extreme rainfall and damaged paddy area for a historical period based on linear regression analysis. Then, we formulated a flood damage assessment framework for rice crops under climate change to quantify the damage by coupling hydrologic-hydraulic model outputs and a flood damage estimation model, and assessed the rice crop damage for the past (1979–2002) and future (2075–2098) periods using MRI-AGCM3.2S climate model outputs.
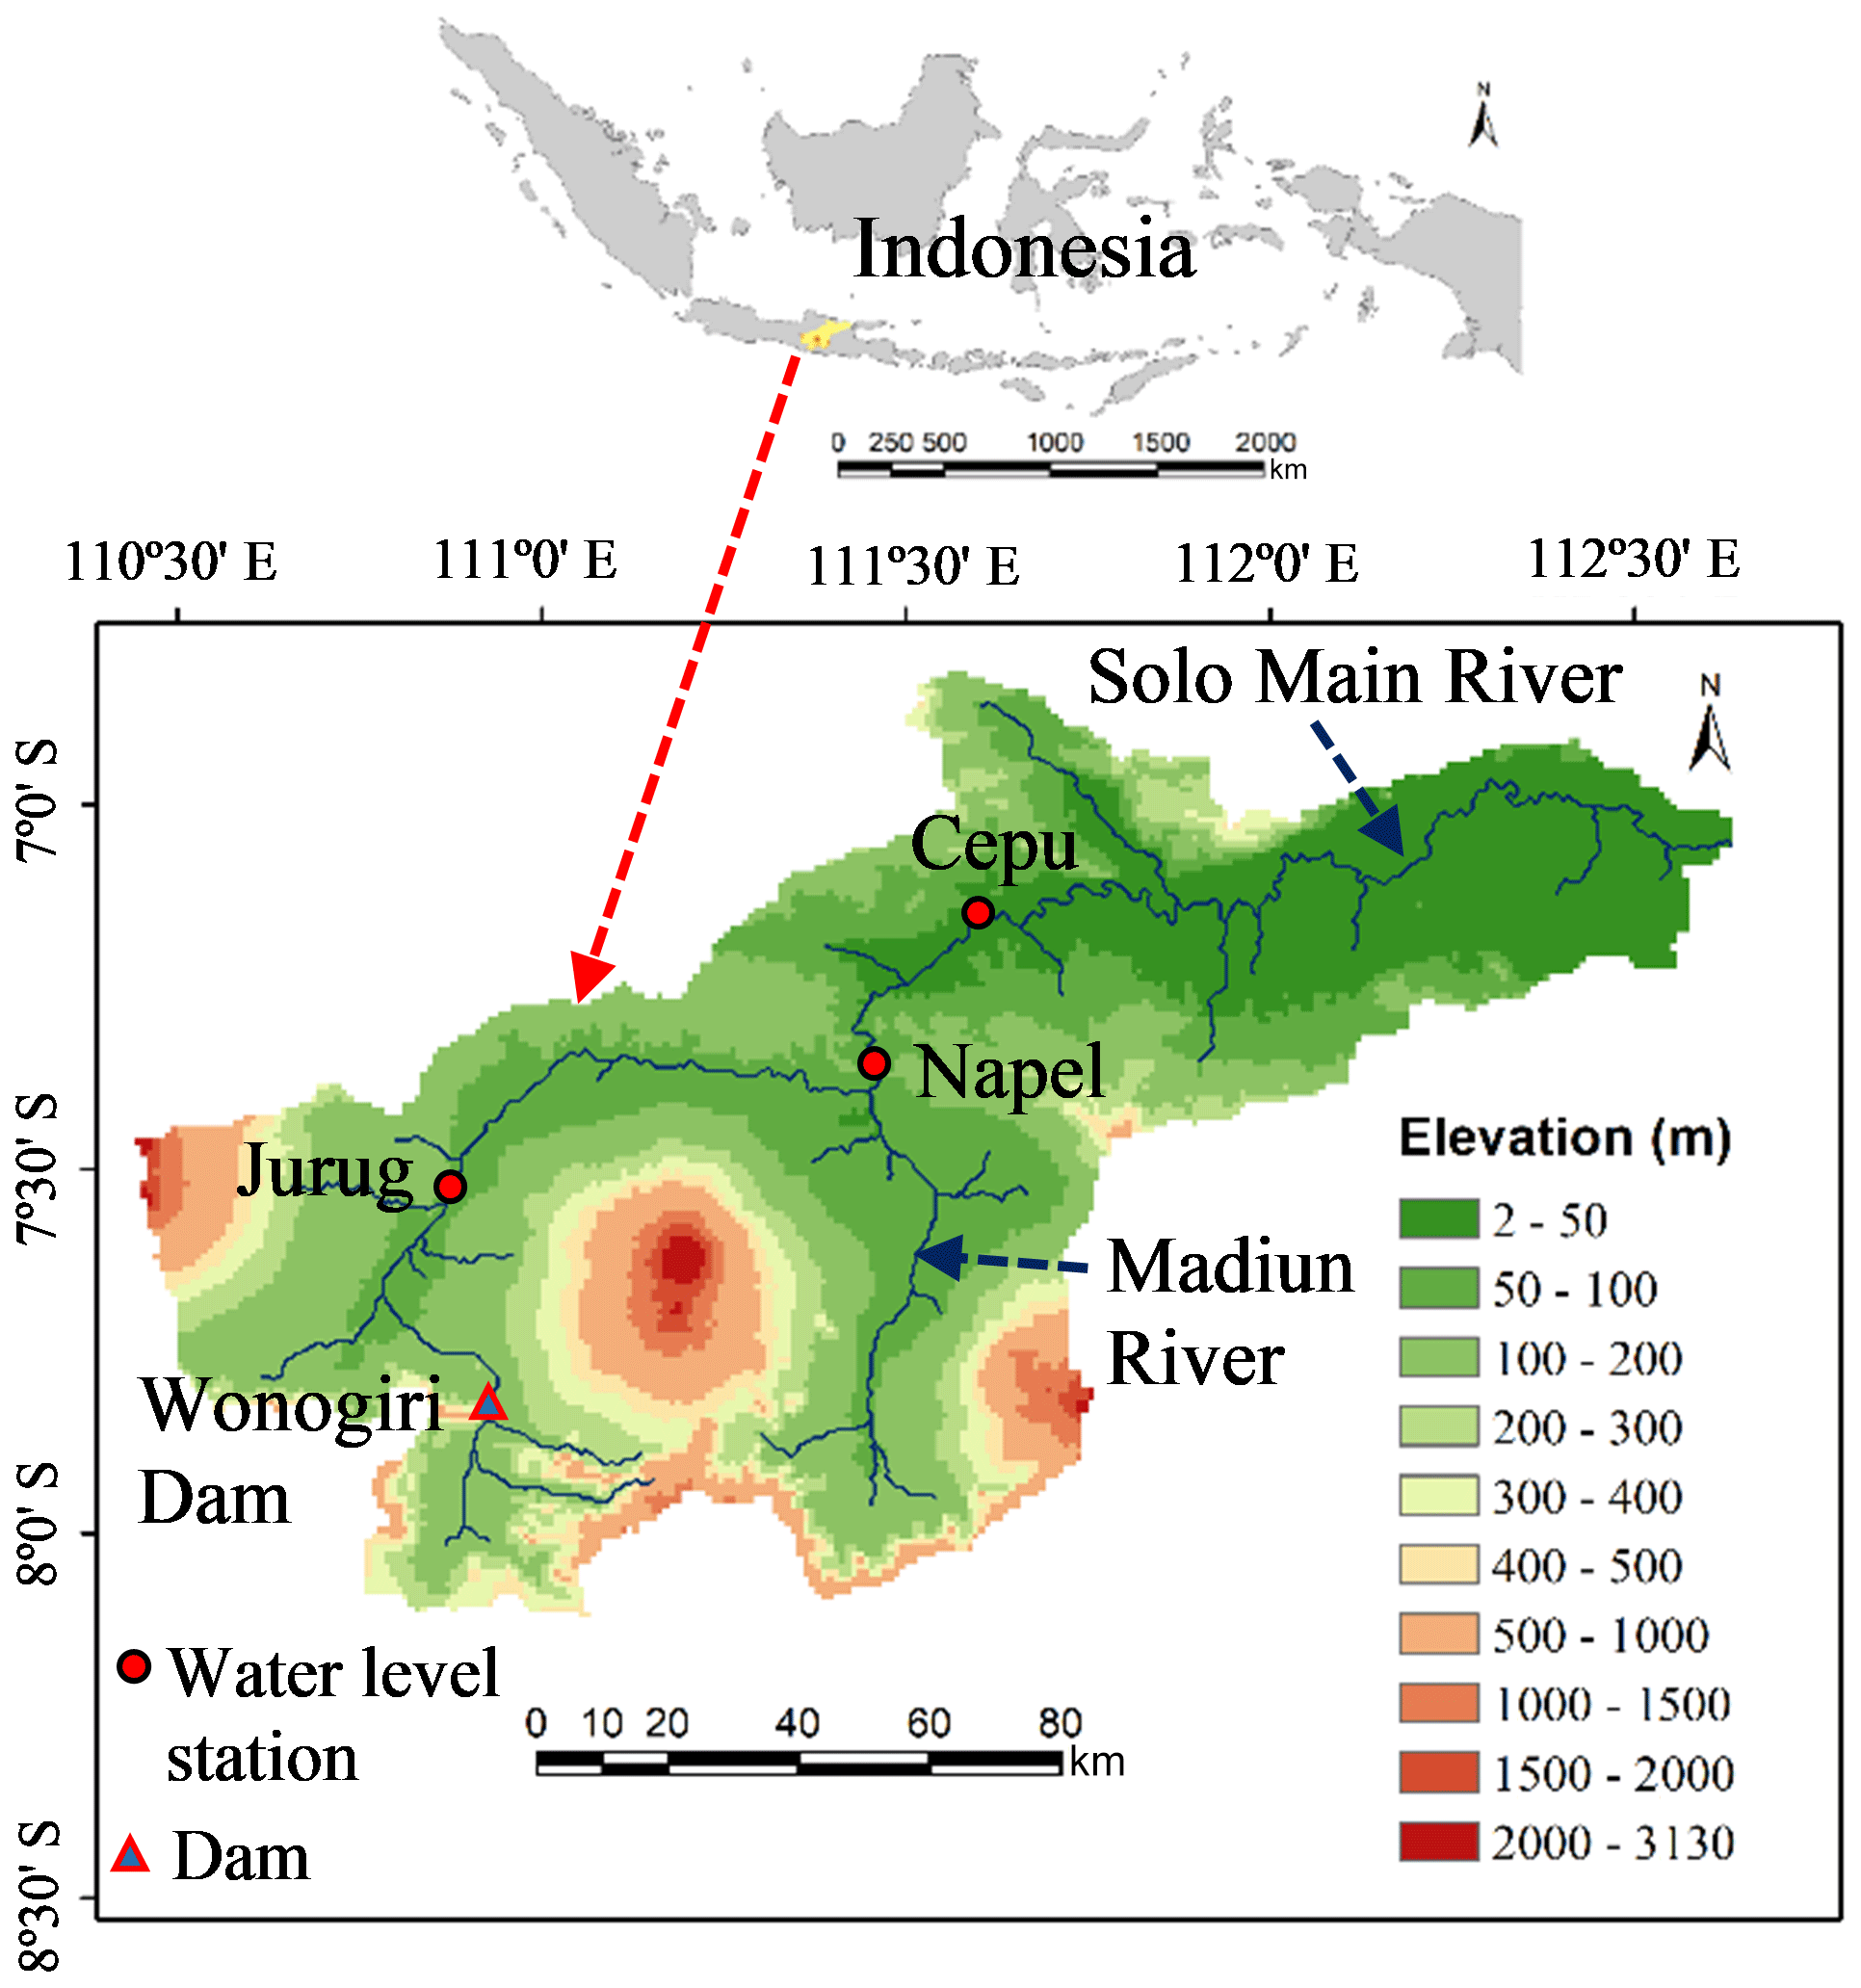
Figure 1Location of the Solo River basin, Indonesia (Elevation data: HydroSHEDS digital elevation model).
The SRB is located in Java Island in Indonesia (Fig. 1). The catchment area of the study boundary is about 15 752 km2, and the main Solo River is approximately 600 km long. The Wonogiri multipurpose dam, with a reservoir capacity of 730×106 m3, is in the upper part of the basin. The SRB is one of the country's important river basins in terms of agriculture production. However, agricultural crops are often damaged due to flooding in the area. Therefore, the assessment of flood damage to agricultural crops under climate change in this basin is essential to implement effective preventive and adaptation measures.
We collected data on damaged paddy area for 1997–2009 from the Directorate of Food Crop Protection (DFCP, 2010). The collected data were used to study the relationship between extreme rainfall and damaged paddy area based on linear regression analysis. Figure 2 shows the plot between monthly rainfall and total monthly damaged paddy area for the regencies in the study area. The figure shows that flood damage to rice crops usually occurred in December–March, when the basin average monthly rainfall was higher than 200 mm. The figure shows that a significantly large area of rice paddies was affected during the flood in December 2007–January 2008, and the basin average monthly rainfalls in these months were 455 and 270 mm, respectively.
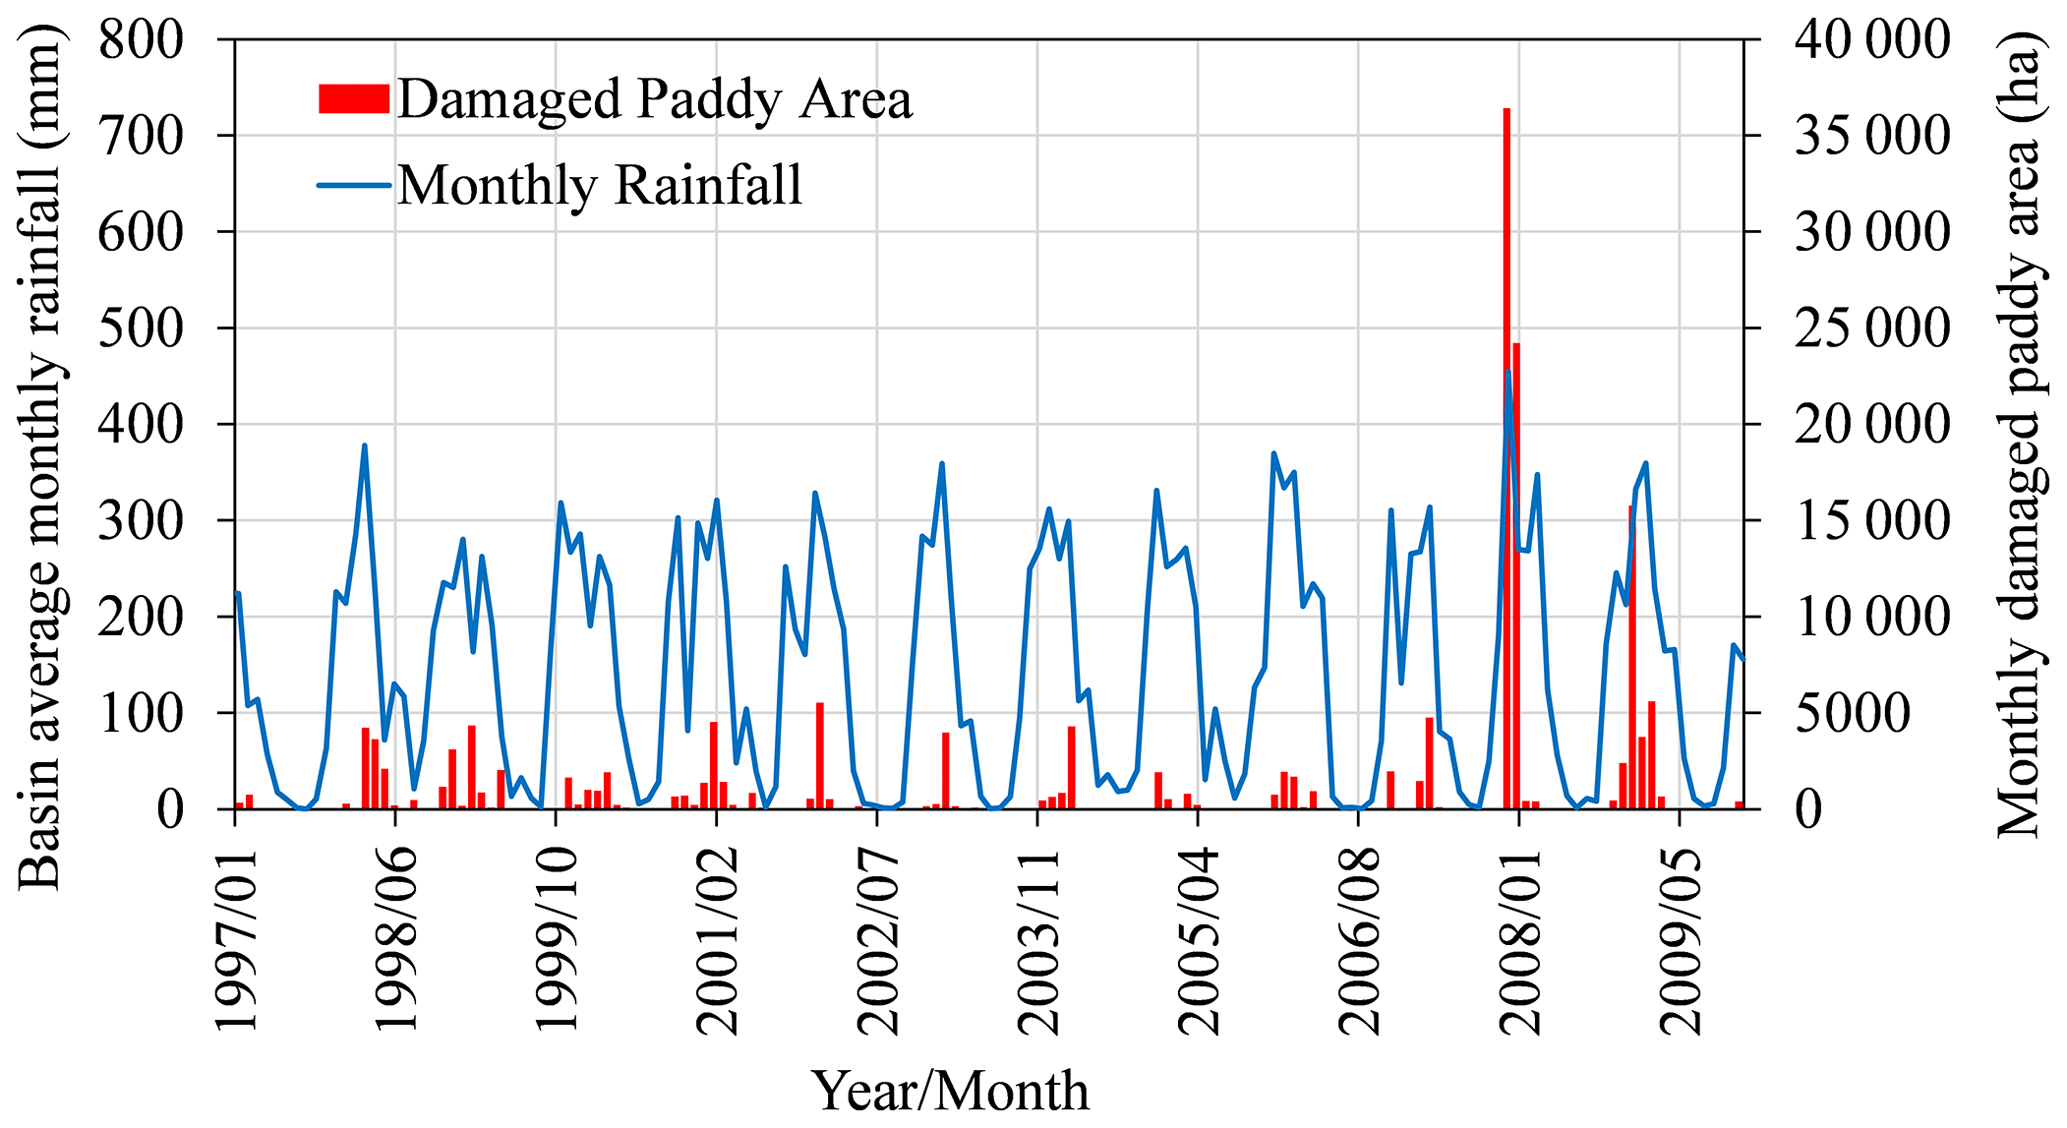
Figure 2Monthly rainfall and monthly damaged (affected) paddy area from January 1997 to December 2009.
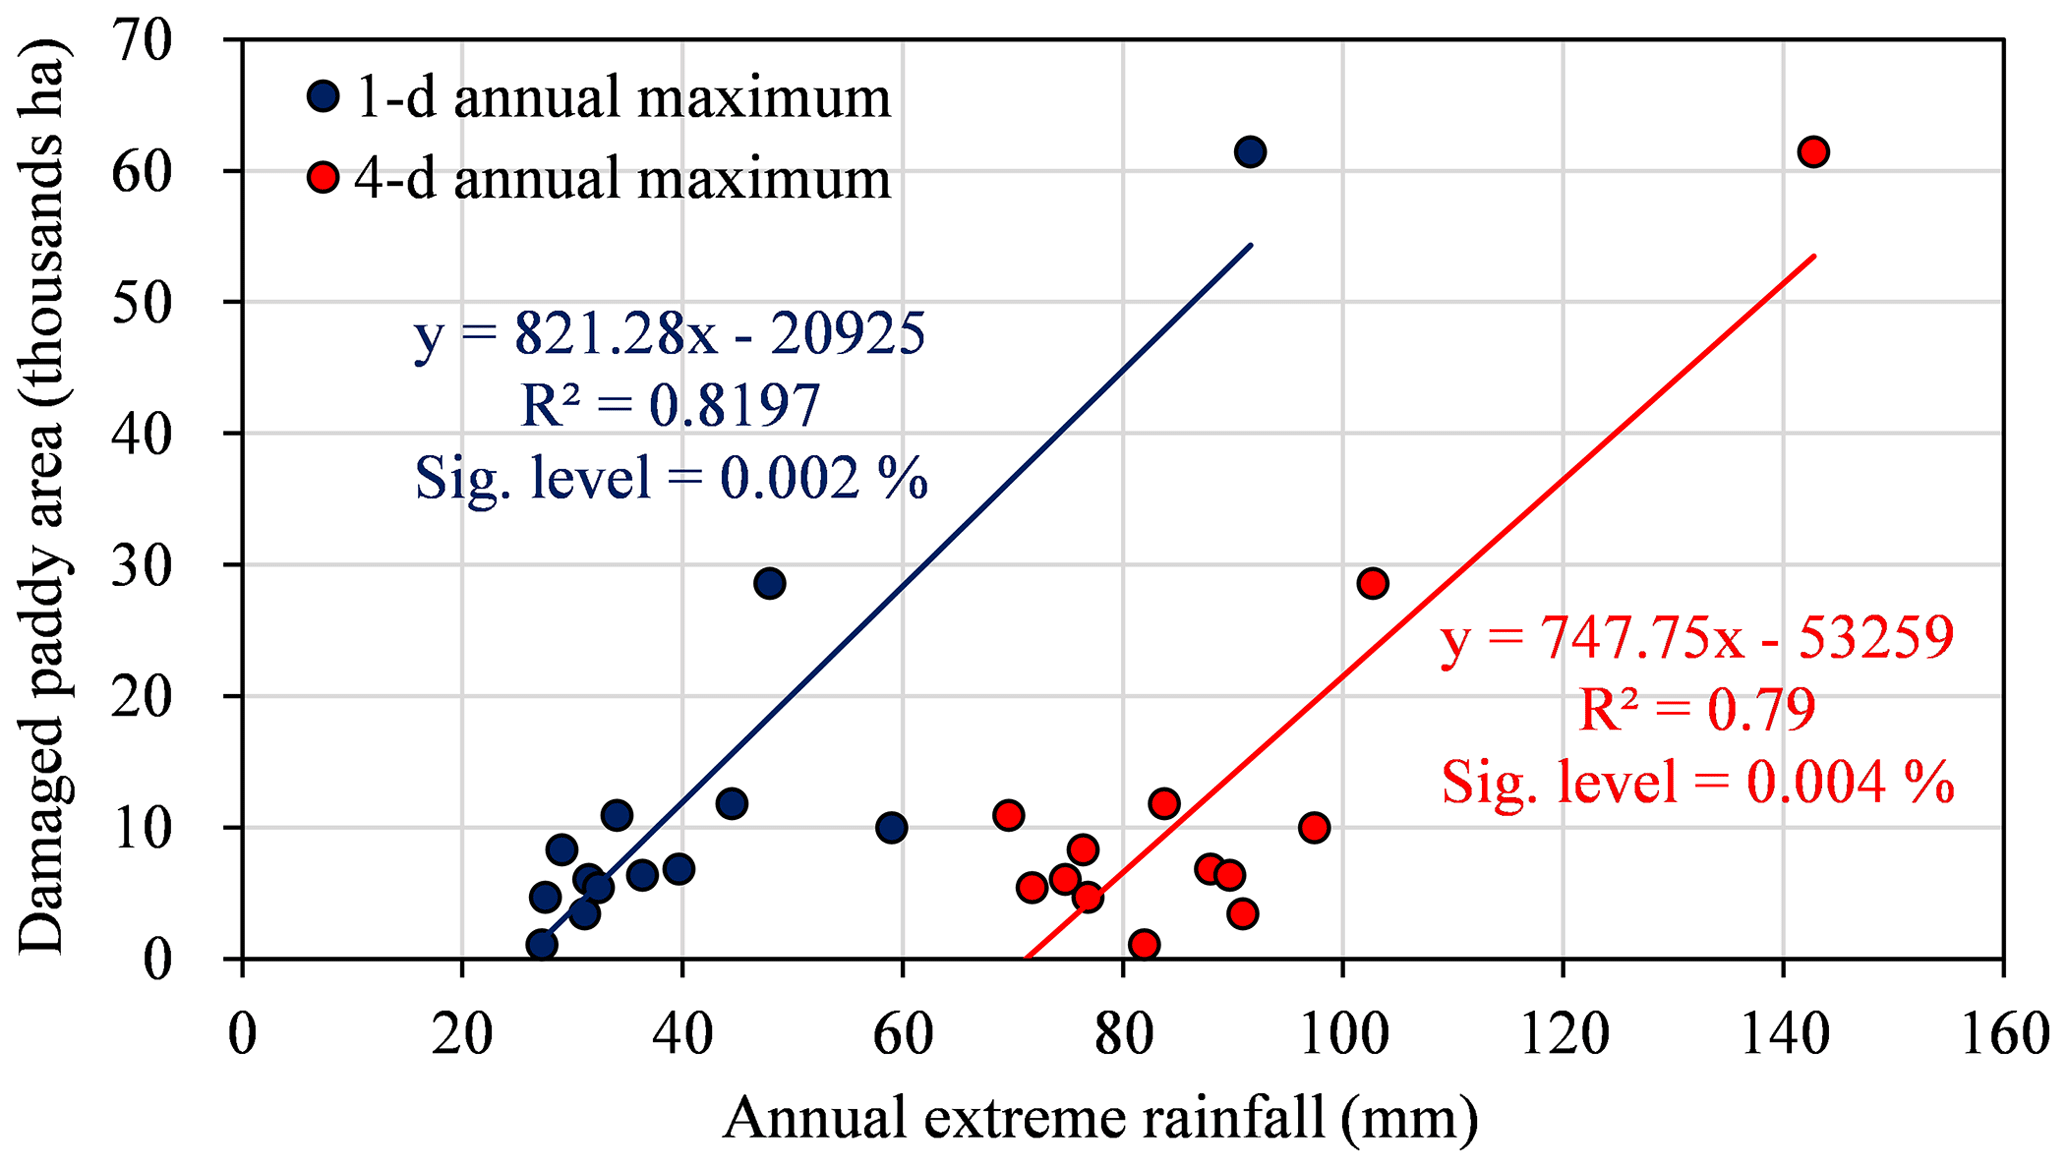
Figure 3Plots between damaged paddy area and annual extreme rainfall (1 or 4 d annual maximum) and their linear relationships (Sig. = Significance).
In SRB, the monsoon period is from November to April, and floods usually occur between December and March. We thus defined the period from 1 August (beginning from the month with the least rainfall in a year) to the end of July as the hydrological year. The relationship between damaged paddy area (i.e., flooded paddy area with rice crop damage reported by local government (DFCP, 2010)) and extreme rainfall was analyzed using the annual data for the hydrological year. The 1 and 4 d maximum rainfall were considered for analysis to represent floods due to heavy rainfall over a single day or several days, based on rainfall and discharge characteristics. Figure 3 shows the linear relationship between the annual damaged paddy area and the 1 or 4 d annual maximum basin average rainfall. The damaged paddy area varies positively with the extreme rainfall, and the linear relationship between the damaged paddy area and the 1 or 4 d maximum rainfall was statistically significant, with a significance level of less than 0.005 %. The linear trends show that floods may affect rice paddies when 1 or 4 d rainfall exceeds 25 or 71 mm, respectively, although flooding may depend on the spatial distribution and the occurrence time of rainfall. The 1 and 4 d maximum basin average rainfalls during the 2007–2008 flood event, the largest recorded flood event in the basin, were 91.6 and 142.7 mm, respectively.
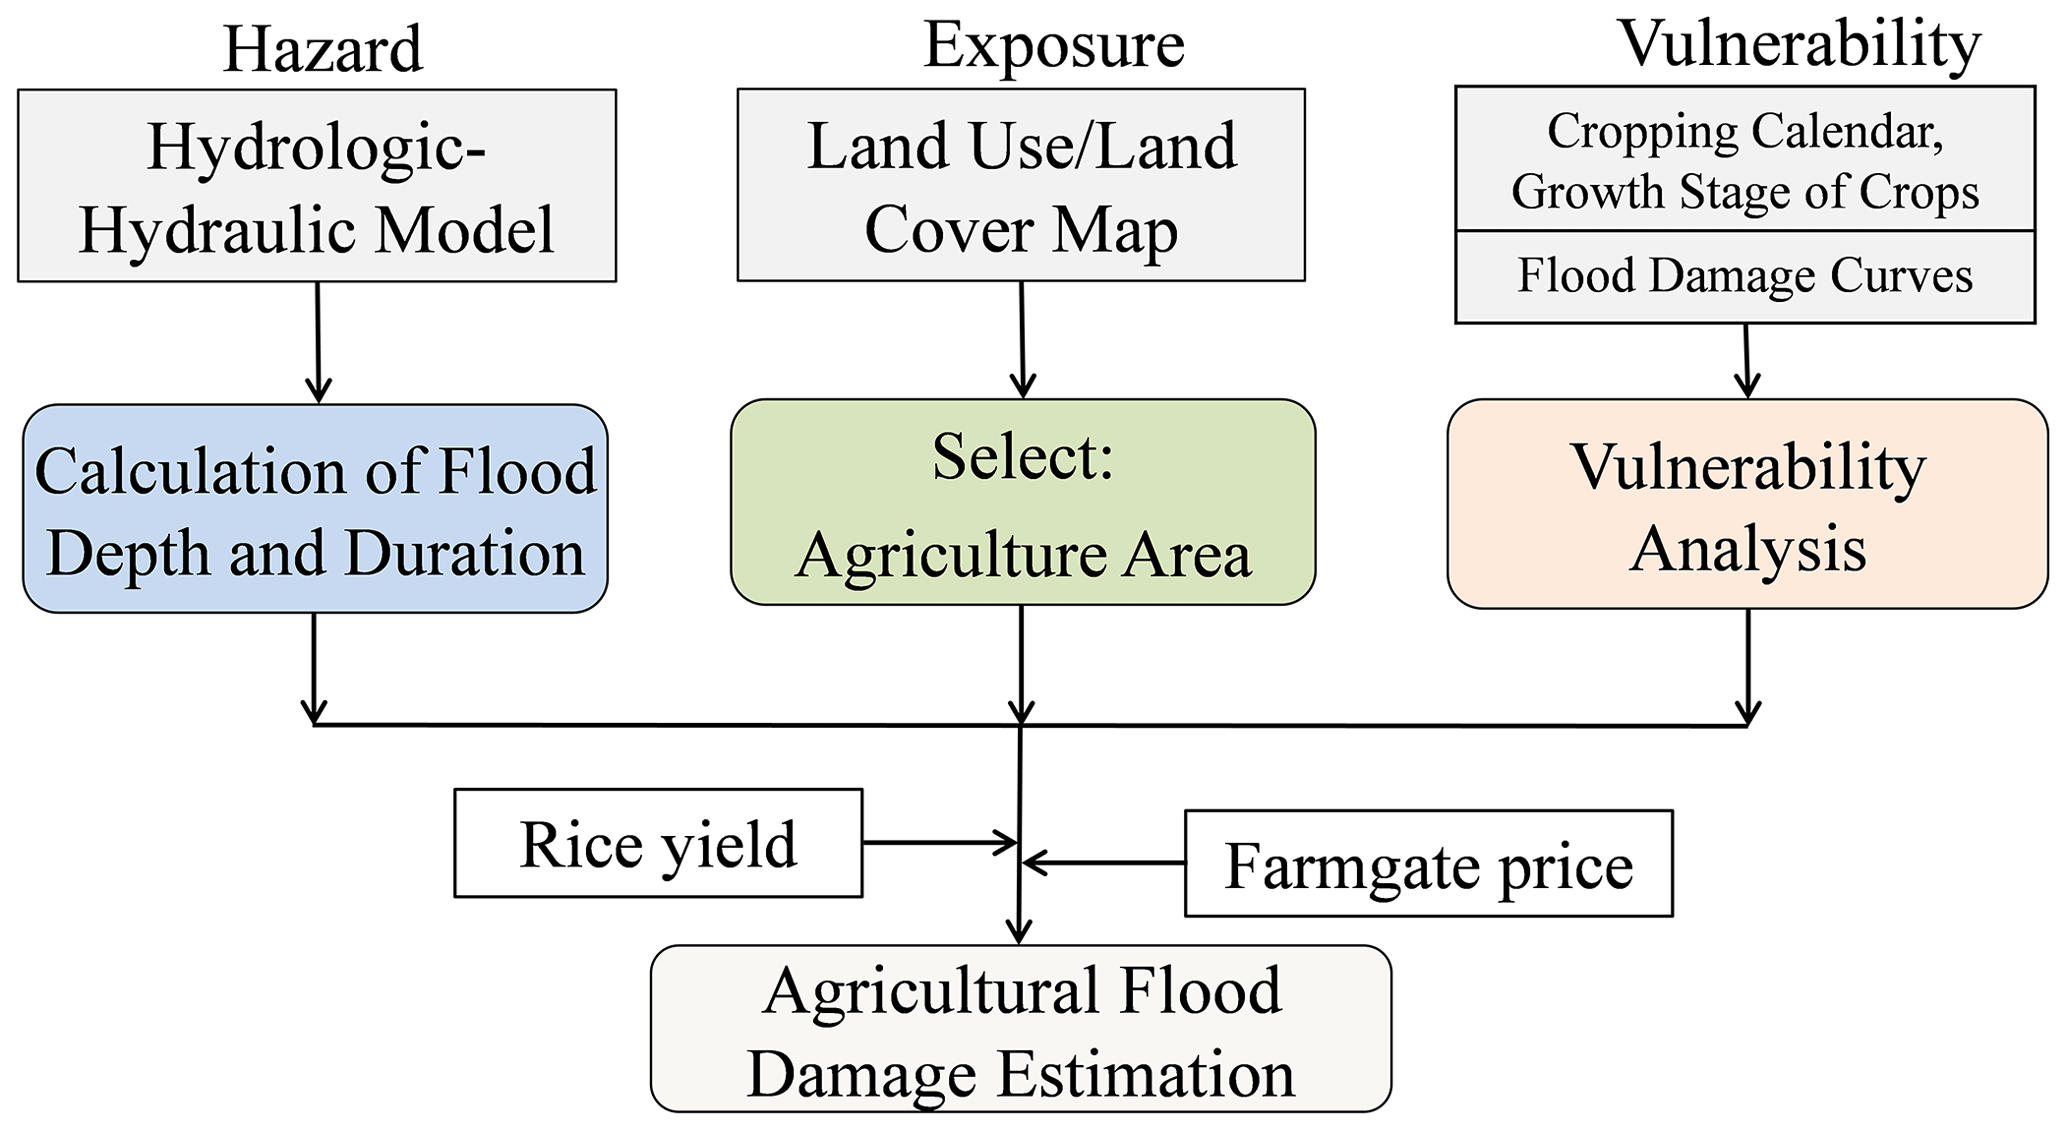
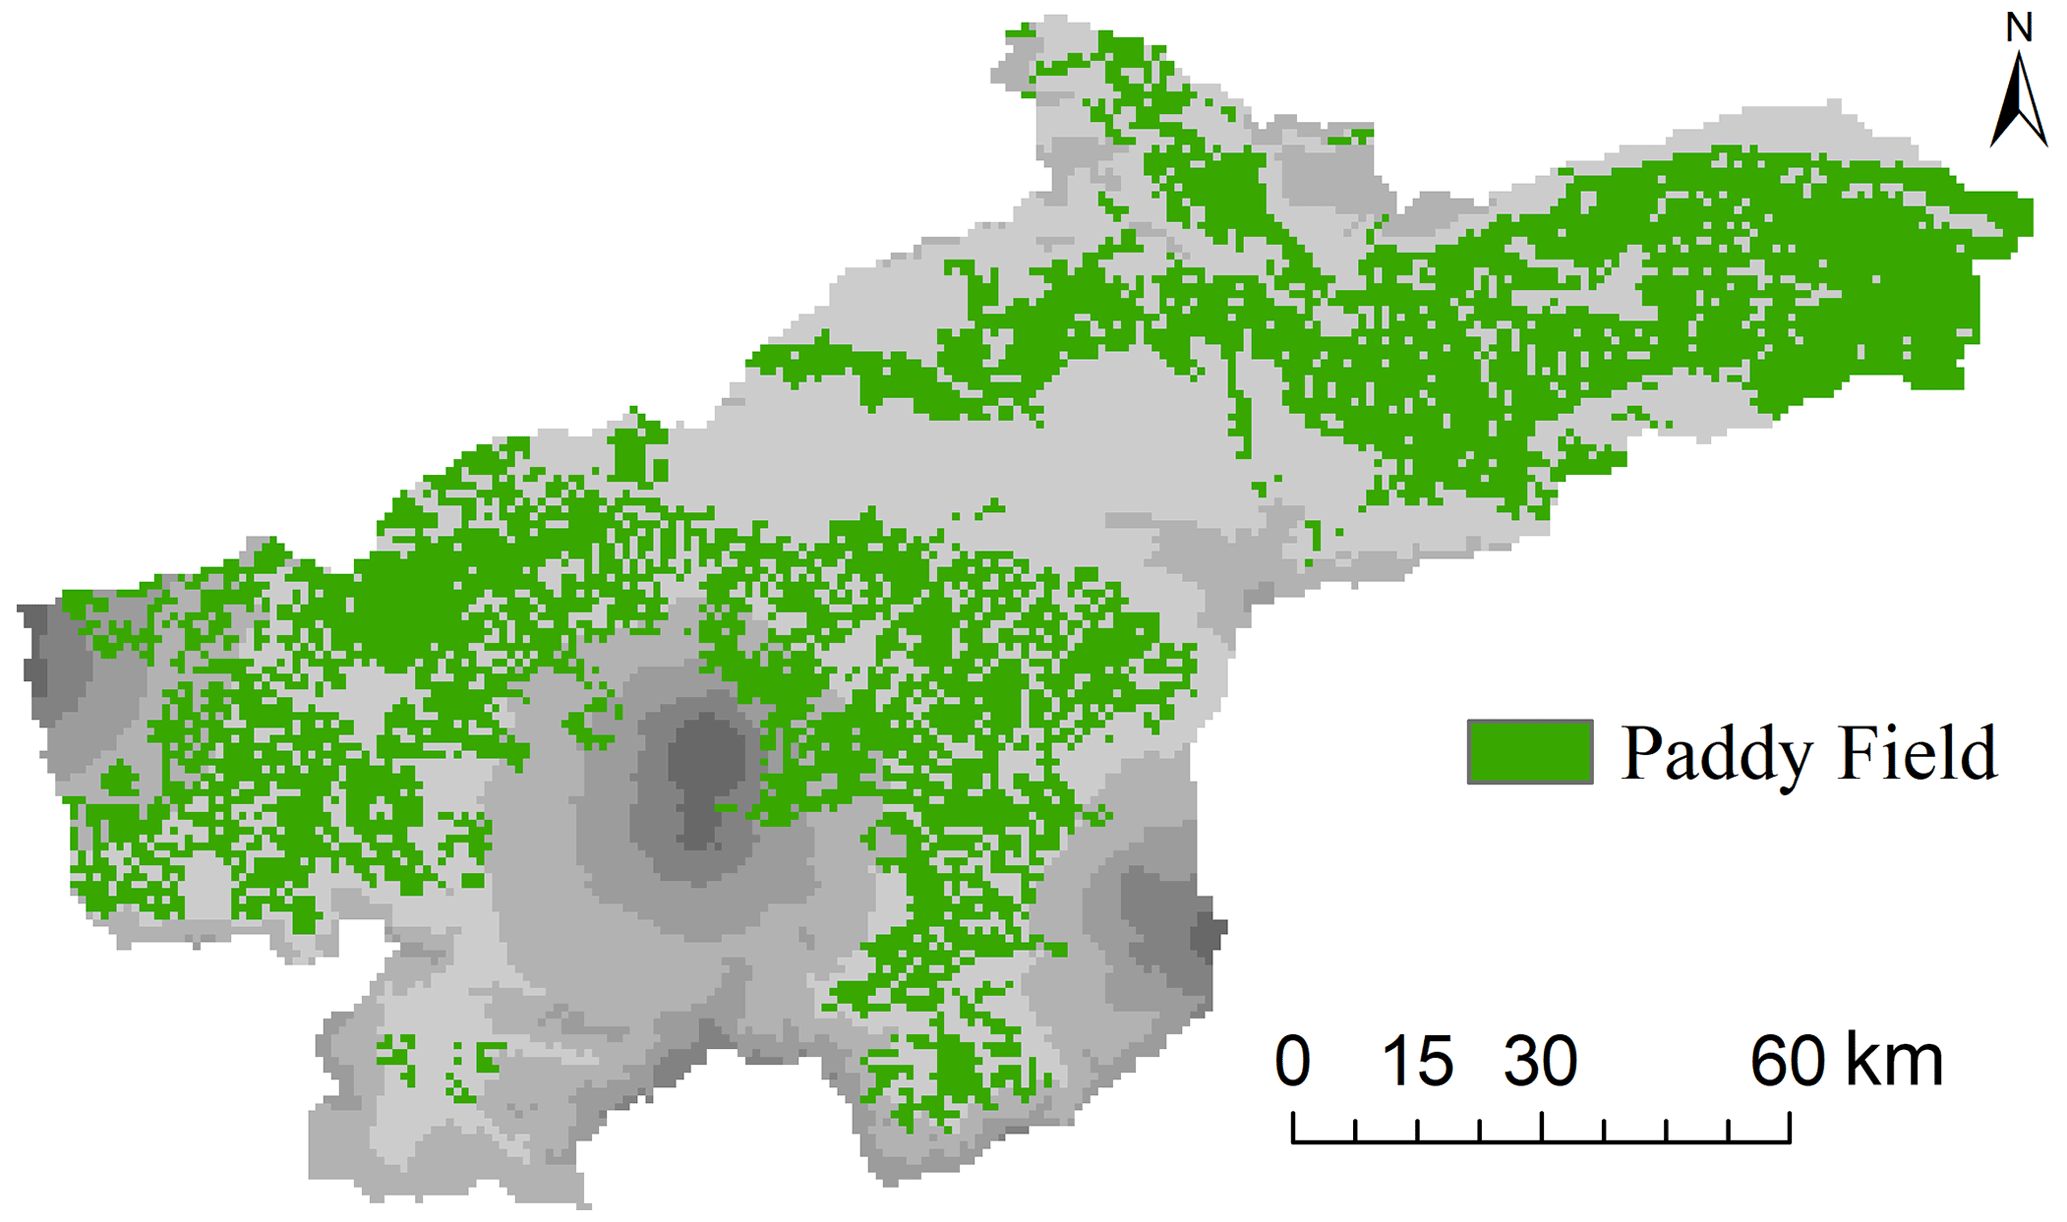
Figure 5Paddy area based on the 2006 land cover produced by the Ministry of Environment and Forestry, Indonesia.
4.1 Global climate model outputs
This study used the global climate model (GCM) outputs of MRI-AGCM3.2S, which are the high-resolution climate outputs from the Climate Model Intercomparison Project-phase 5. The GCM outputs of MRI-AGCM3.2S (past period: 1979–2002, future period: 2075–2098), which were dynamically downscaled to a 5 km domain using a weather research forecasting model and statistically corrected the bias using ground-observed rainfall data for the past period, were employed to simulate flood hazard conditions under climate change scenarios. For the future period, the representative concentration pathway (RCP) 8.5 scenario, the high-end emissions scenario experiments, was used.
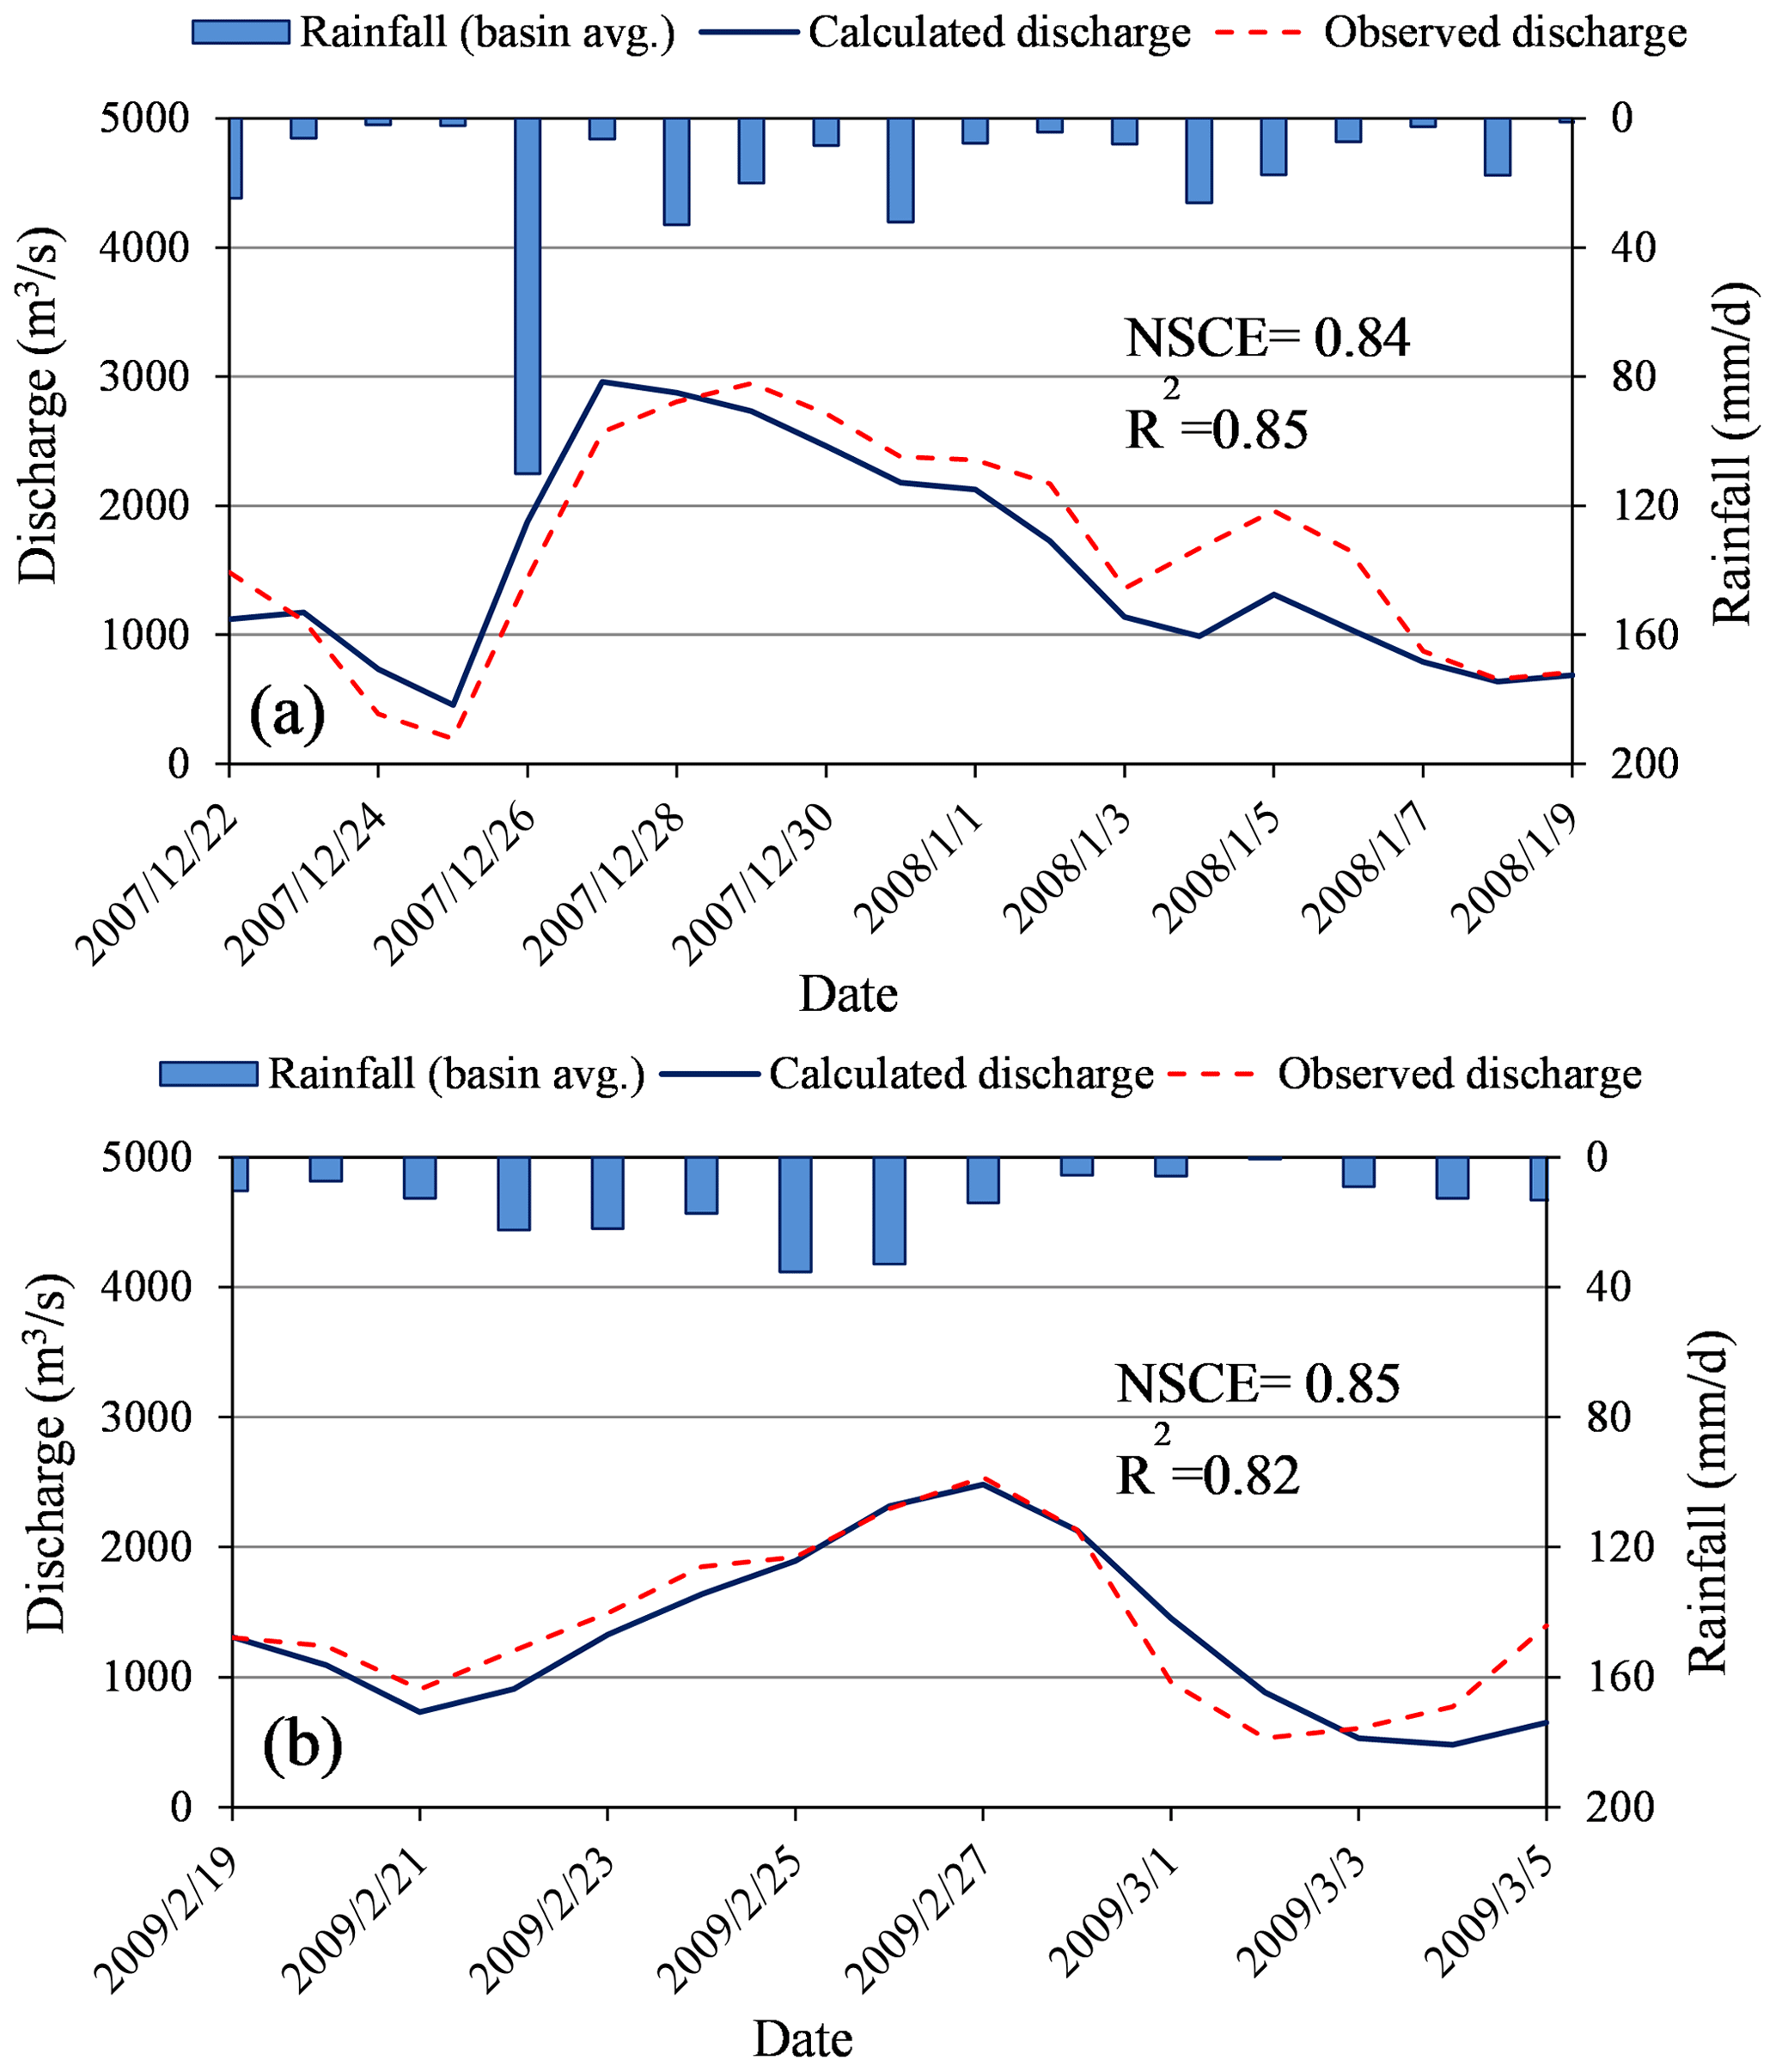
Figure 6Comparison of calculated and observed discharges at the Cepu station for flood events in 2007/2008 and 2009.
4.2 Flood hazard analysis
We used the water and energy budget-based rainfall-runoff-inundation (WEB-RRI) model developed by Rasmy et al. (2019) for flood hazard simulation. The WEB-RRI model takes into account all the natural hydrological processes in a catchment and simulates evapotranspiration, the rainfall-runoff process, infiltration, and flood inundation. We used the digital elevation model data obtained from the HydroSHEDS. First, the parameters of the WEB-RRI model were calibrated and validated by comparing calculated discharges with observed discharges for past flood events. Outflows from the Wonogiri dam were also considered for the flood events of calibration and validation. Then, flood simulations were conducted using the calibrated and validated WEB-RRI model with MRI-AGCM3.2S outputs for the past and future climate periods. The WEB-RRI model was set up using bias-corrected rainfall data and other forcing data, such as temperature and radiation, obtained from downscaled MRI-AGCM for the past and future climates. The details on other required data for WEB-RRI model and their sources can be found in Rasmy et al. (2019). Natural flow conditions (i.e., no dam conditions) were considered in flood simulations for the past and future climate periods. Inundation may occur due to fluvial flooding when water overflows the river banks or pluvial flooding when extreme rainfall accumulates in the area.
4.3 Flood damage assessment
Figure 4 shows the process of estimating flood damage to rice crops. The flood damage to rice crops in terms of economic losses was calculated as the product of the value of the exposed rice crops in hazardous areas and flood vulnerability. Flood depth and duration were considered as key flood parameters that affect rice crops during flooding. The paddy fields in the study area were extracted from the land cover map for 2006 produced by the Ministry of Environment and Forestry, Indonesia (Fig. 5).
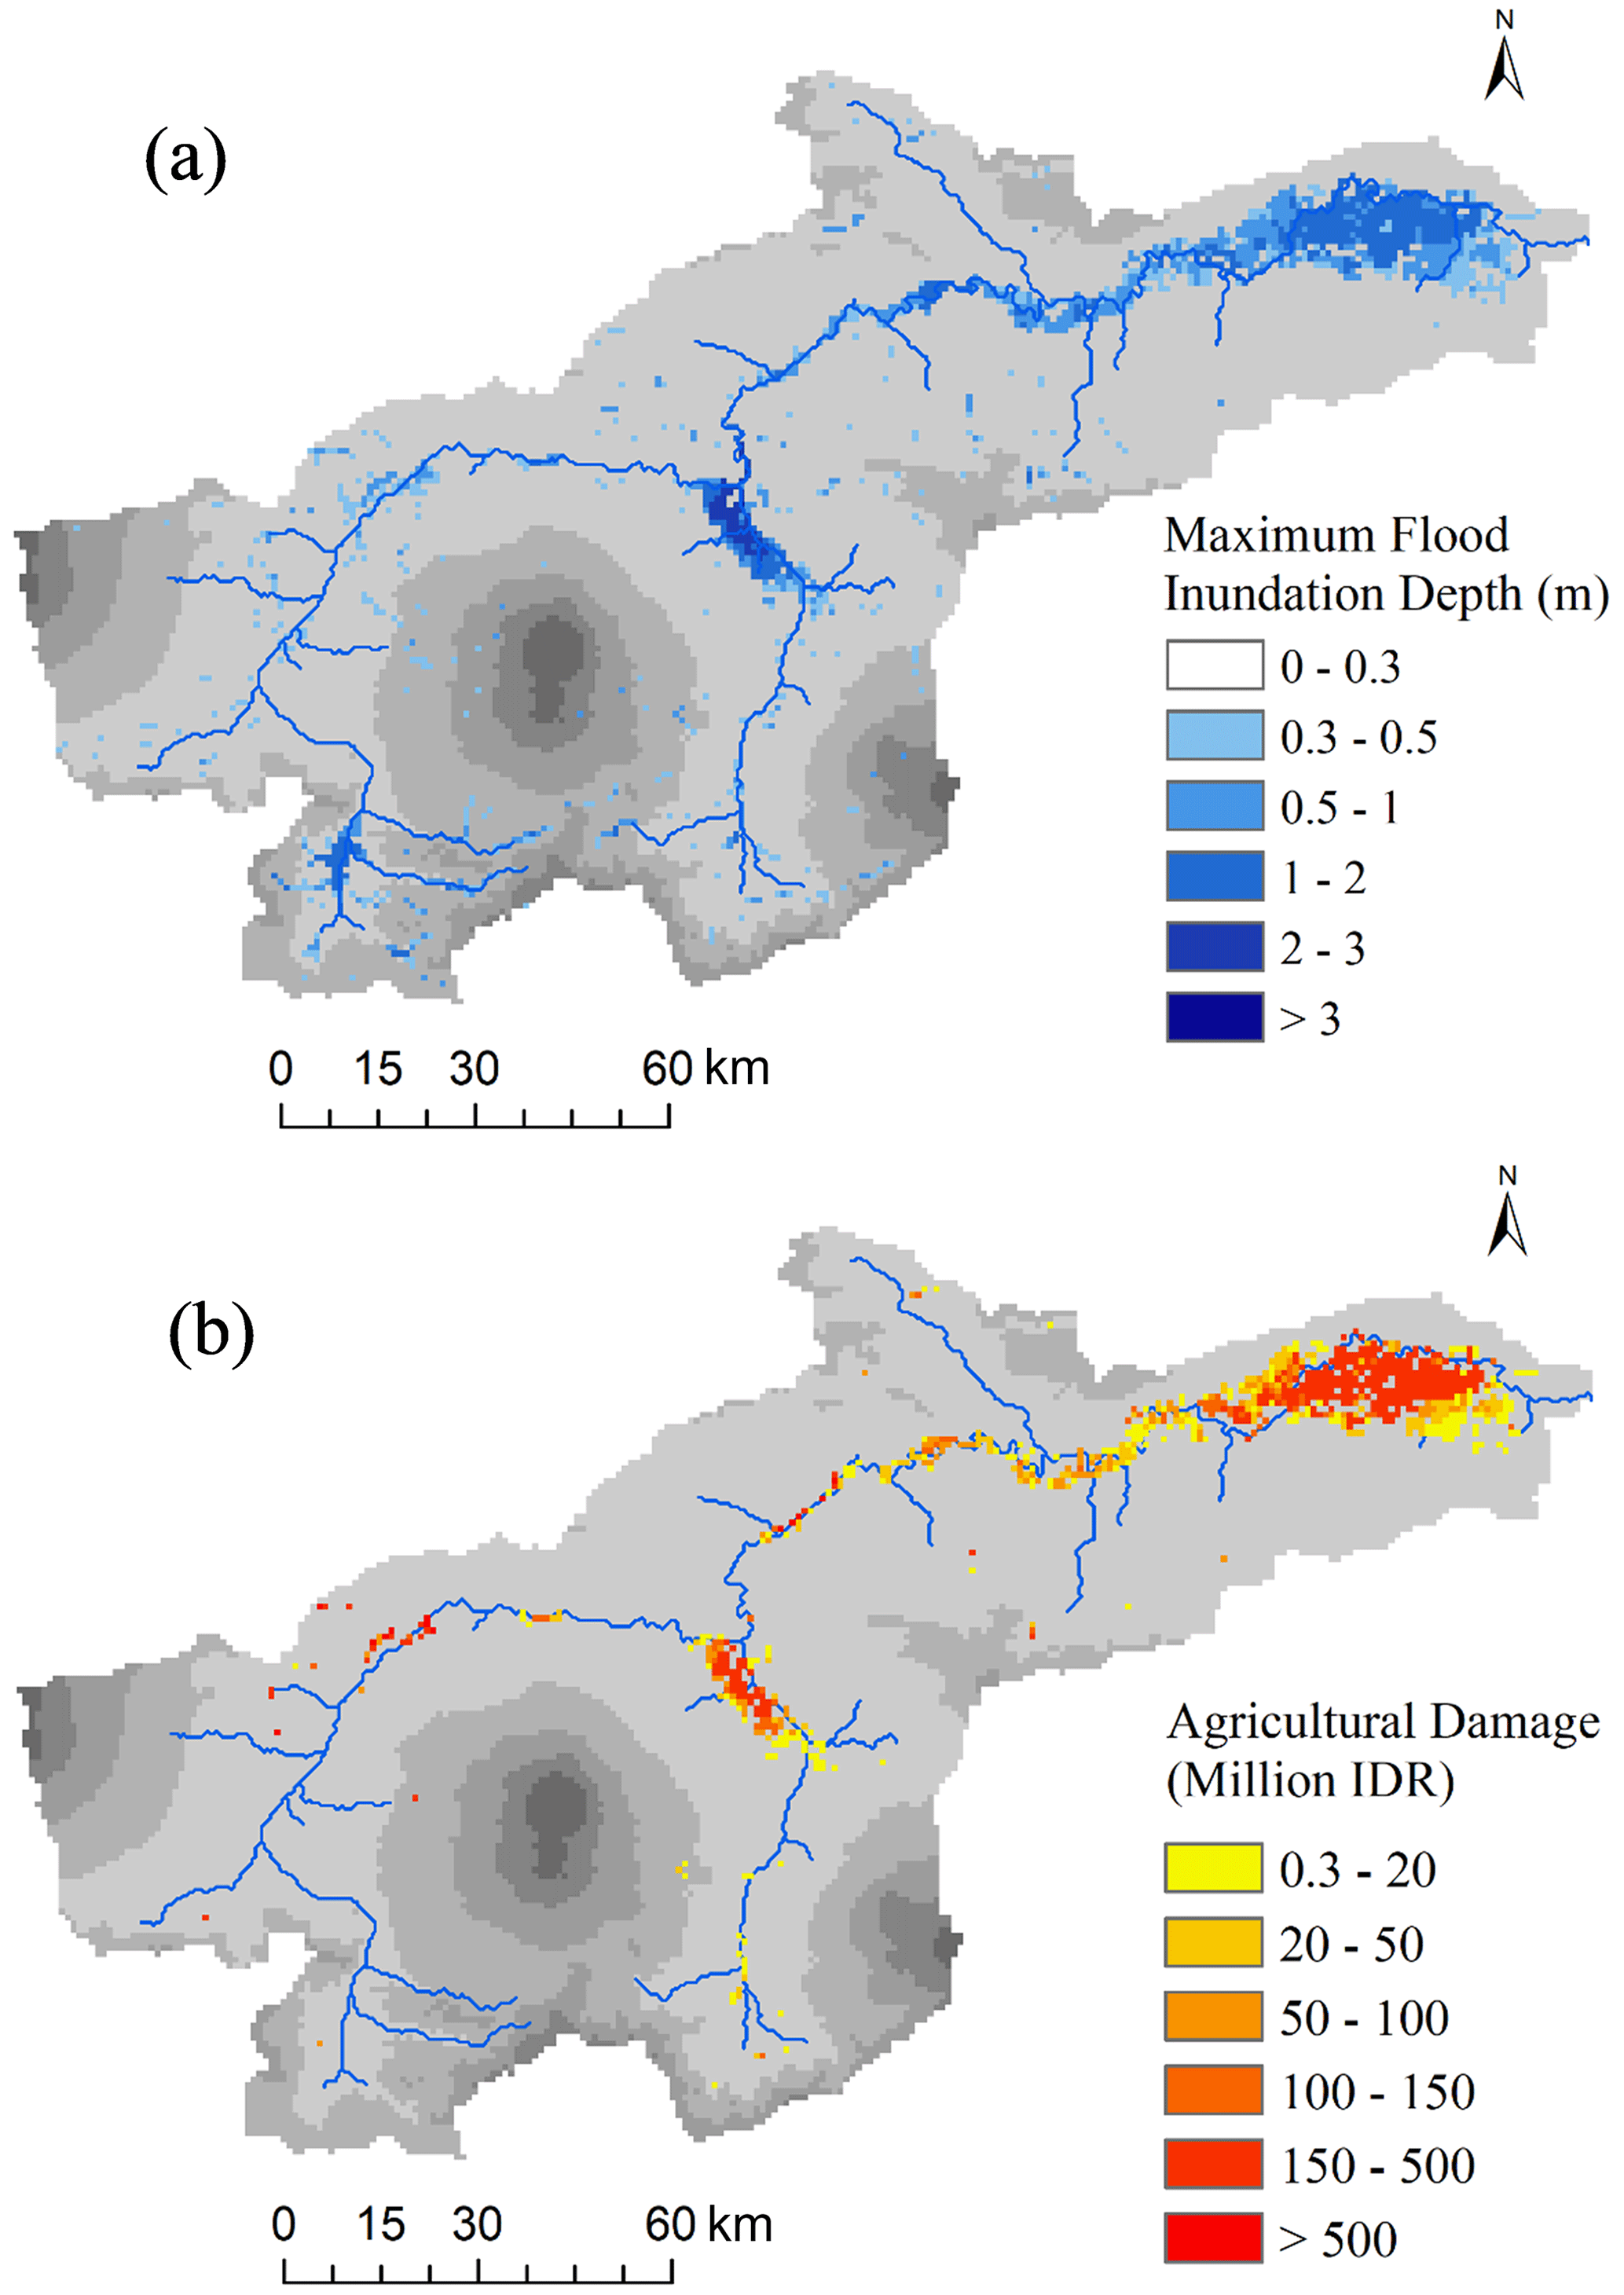
Figure 7(a) Calculated flood inundation depth and extent and (b) estimated rice-crop damage, during 2007/2008 flood.
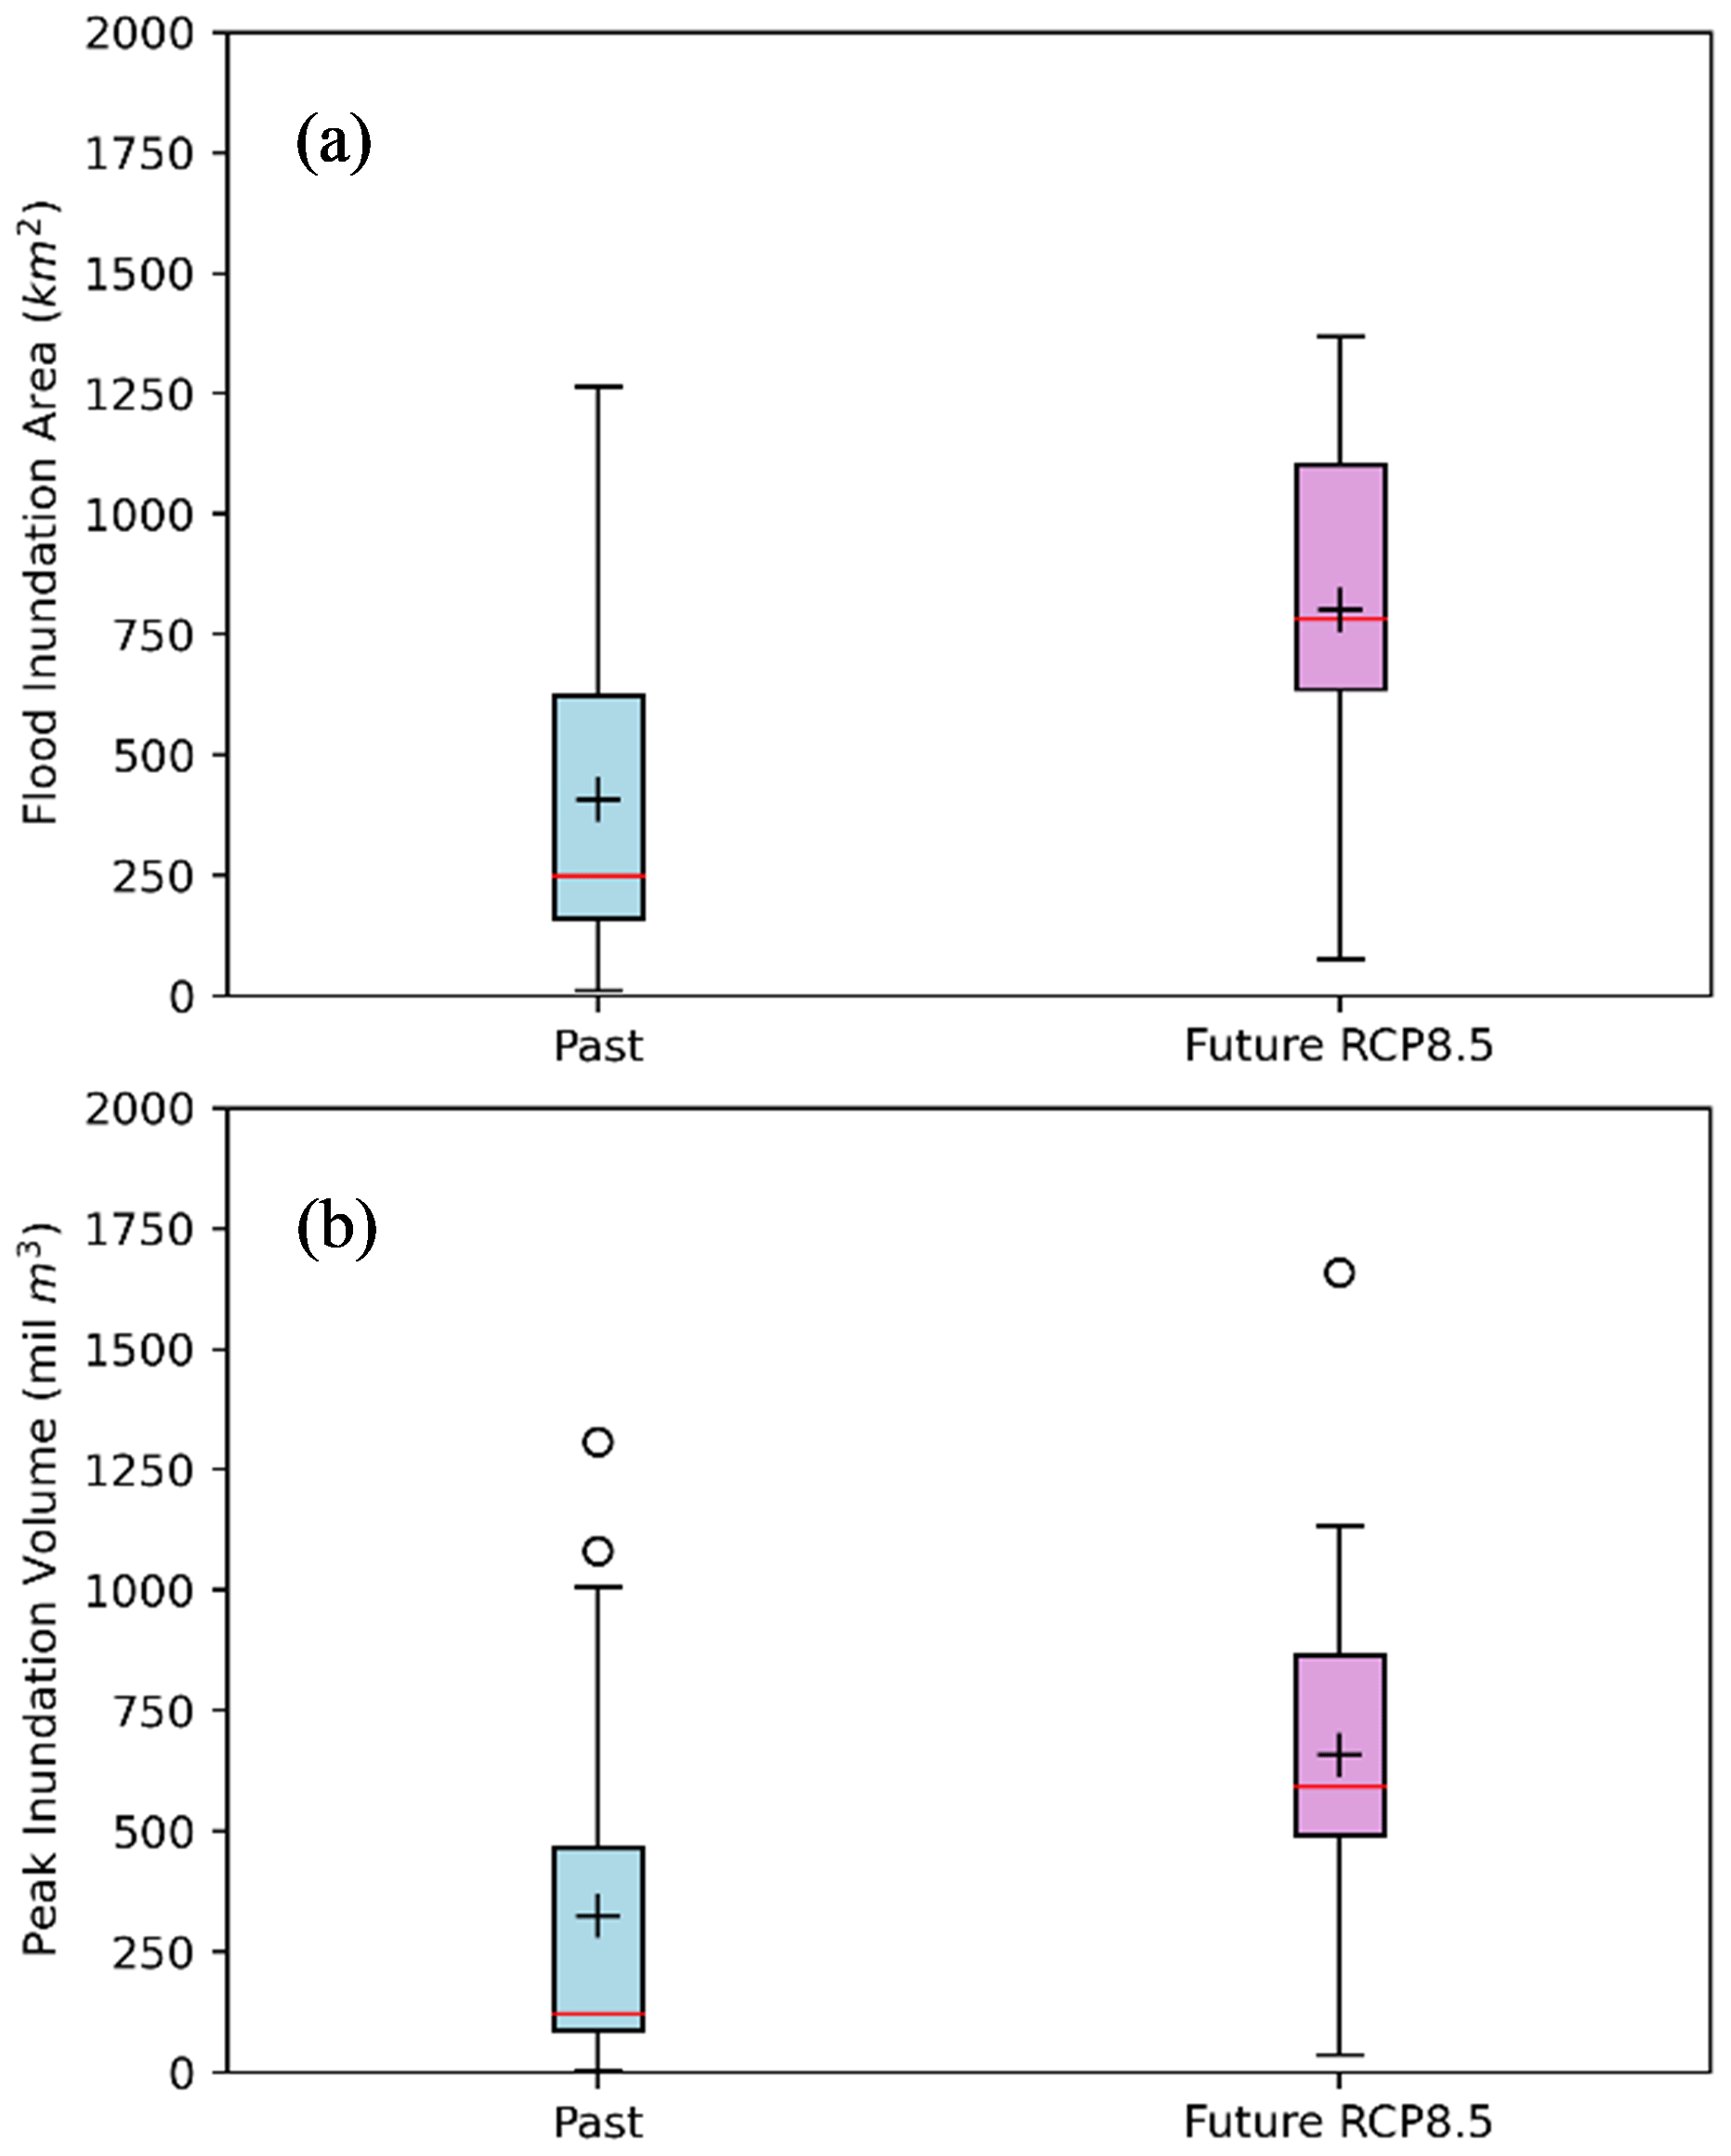
Figure 8Boxplots of (a) flood inundation area and (b) peak inundation volume for the past and future climate periods (plus mark: average value).
The flood damage curves (FDCs) for rice crops presented by Shrestha et al. (2016) were applied to quantify the damage, which can be applied to the study area because major rice crops grown in Southeast Asia are similar types (Shrestha et al., 2021). FDCs were defined as the function of flood depth, duration, and crop growth stage. The applicability of FDCs or the damage assessment method was also validated by comparing the calculated damage with reported data for past floods. When flooding occurs during the vegetative stages, farmers normally replant rice crops, and in such a case, the value of rice crop damage was estimated as losses of the cost of input. However, when flooding occurs during the reproductive and maturity stages of rice plants, the value of rice crop damage was estimated as the volume of production losses with farmgate price. The volume of rice production losses was estimated as the product of rice yield, damaged paddy area, and yield loss (Shrestha et al., 2016). The volume and value of rice crop loss were estimated using the following values: a rice yield of 5230 kg ha−1 (Panuju et al., 2013), a farm gate price of IDR 4650 per kg (Wright and Meylinah, 2014), and a cost of input of IDR 1 970 414 per ha (Zakaria et al., 2004). The growth stage of the rice plant during the past flood events was identified with reference to the duration of each growth stage of the rice plant (Shrestha et al., 2016) and the cropping calendar published by DSRI (2001). After the validation of the method, flood damage to rice crops was assessed for the past (1979–2002) and future (2075–2098) periods under climate change scenarios using MRI-AGCM3.2S outputs with scenarios of different rice growth stages.
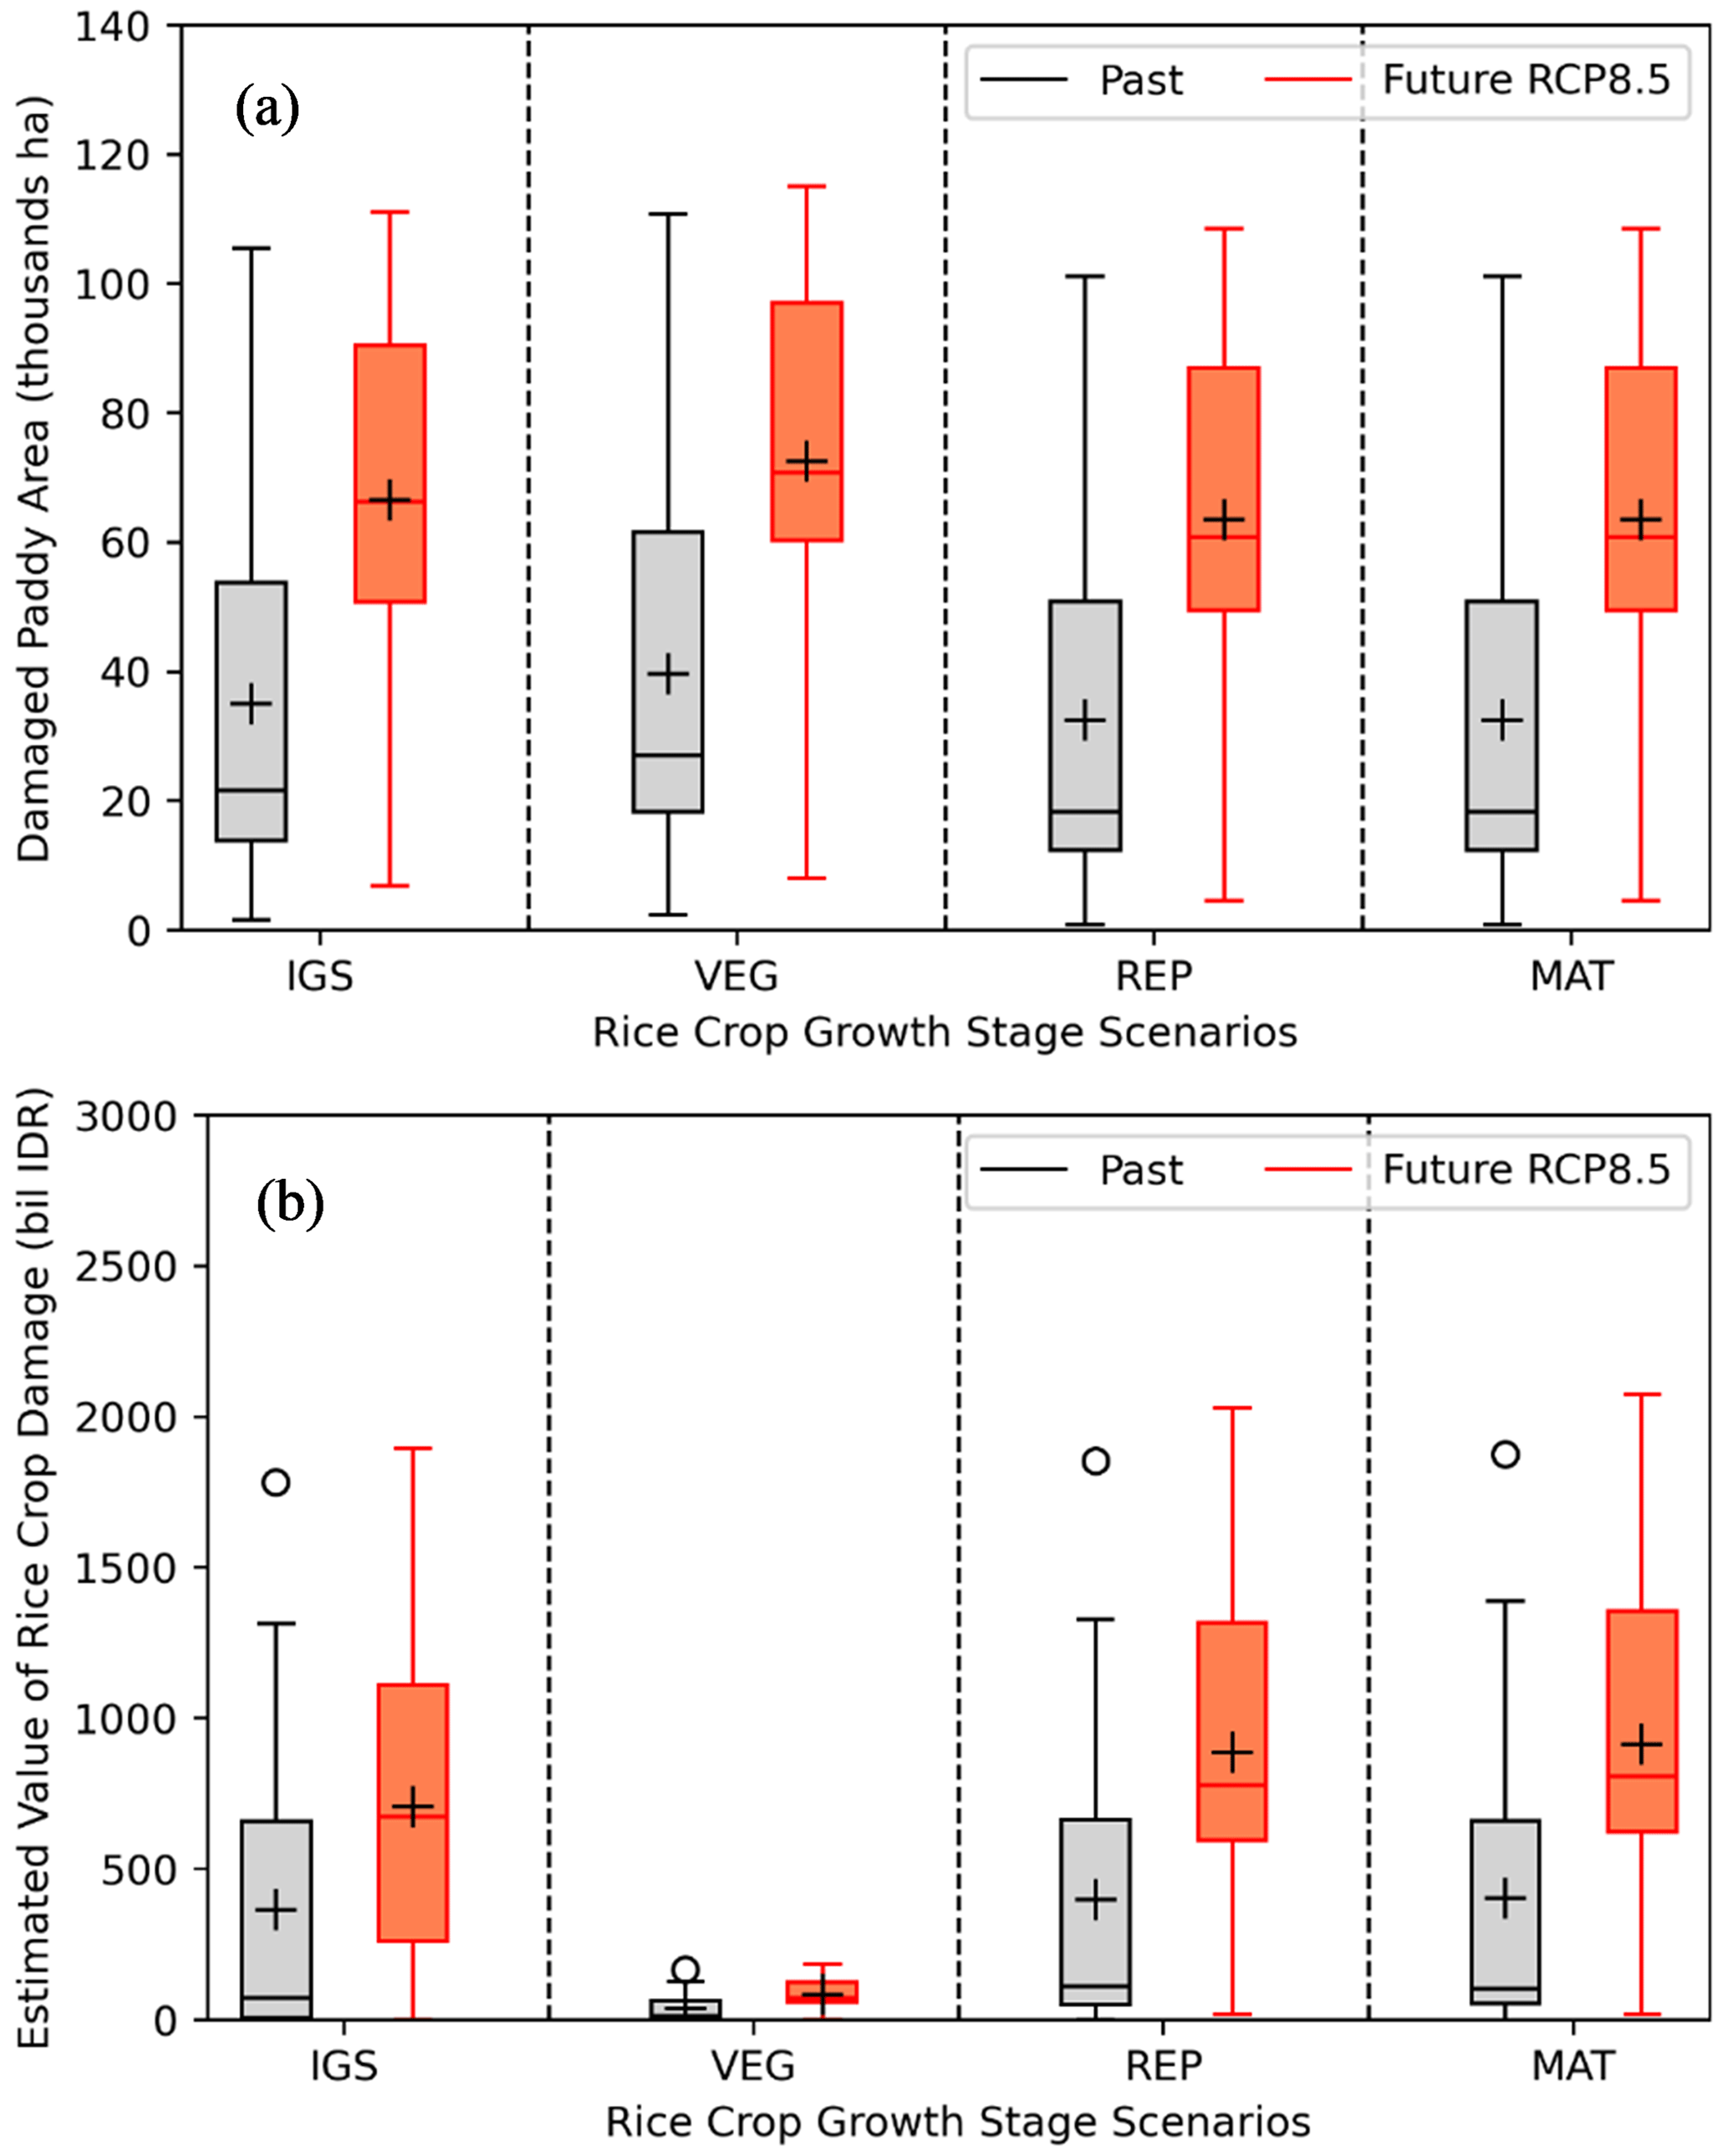
Figure 9Boxplots of (a) calculated damaged paddy area and (b) estimated rice-crop damage for the past and future climate periods (plus mark: average value).
Figure 6 compares the calculated discharge using the WEB-RRI model with the observed discharge at the Cepu for the 2007/2008 and 2009 floods. The results show good model performance with high values of the Nash-Sutcliffe coefficient of efficiency (NSCE) and R-squared. Figure 7 shows the calculated flood inundation depth and the estimated rice-crop damage for the 2007/2008 flood. Based on the cropping calendar and the duration at each rice growth stage, the rice plant during the 2007/2008 flood was at the vegetative and maturity stages in the downstream and upstream parts of the basin, respectively. The estimated value and area of rice crop damage during the 2007/2008 flood were 89.1 billion IDR and 73 324 ha, respectively, while their reported values were 93.3 billion IDR (Hidayat et al., 2008) and 60 630 ha (DFCP, 2010).
Figure 8 shows the boxplots of the flood inundation area and the peak inundation volume for the past and future periods. The figure shows that the first quartile values of the flood inundation area and the peak inundation volume for the future climate period were comparatively higher than the third quartile values of those for the past period, which indicates that floods with a larger inundation area and a higher flood depth may frequently occur in the future.
Figure 9 shows the boxplots of calculated damaged paddy area and estimated rice-crop damage for the past and future periods with different scenarios of rice growth stages, (i.e., identified approximate rice growth stage during flooding based on cropping calendar (IGS) and also assumed if floods occur during the vegetative stage (VEG) or reproductive stage (REP) or maturity stage (MAT)). The figure shows that the first or third quartile values of the calculated damaged paddy area and the estimated rice-crop damage for the future period (RCP8.5) were comparatively higher than the first or third quartile of those for the past period. The results indicate that rice paddies will be frequently affected by highly damaging floods in the future. The average rice crop damage per year is approximately two times higher at all growth stages for the future period than for the past period, suggesting that rice crop damage can be more serious in the future due to climate change.
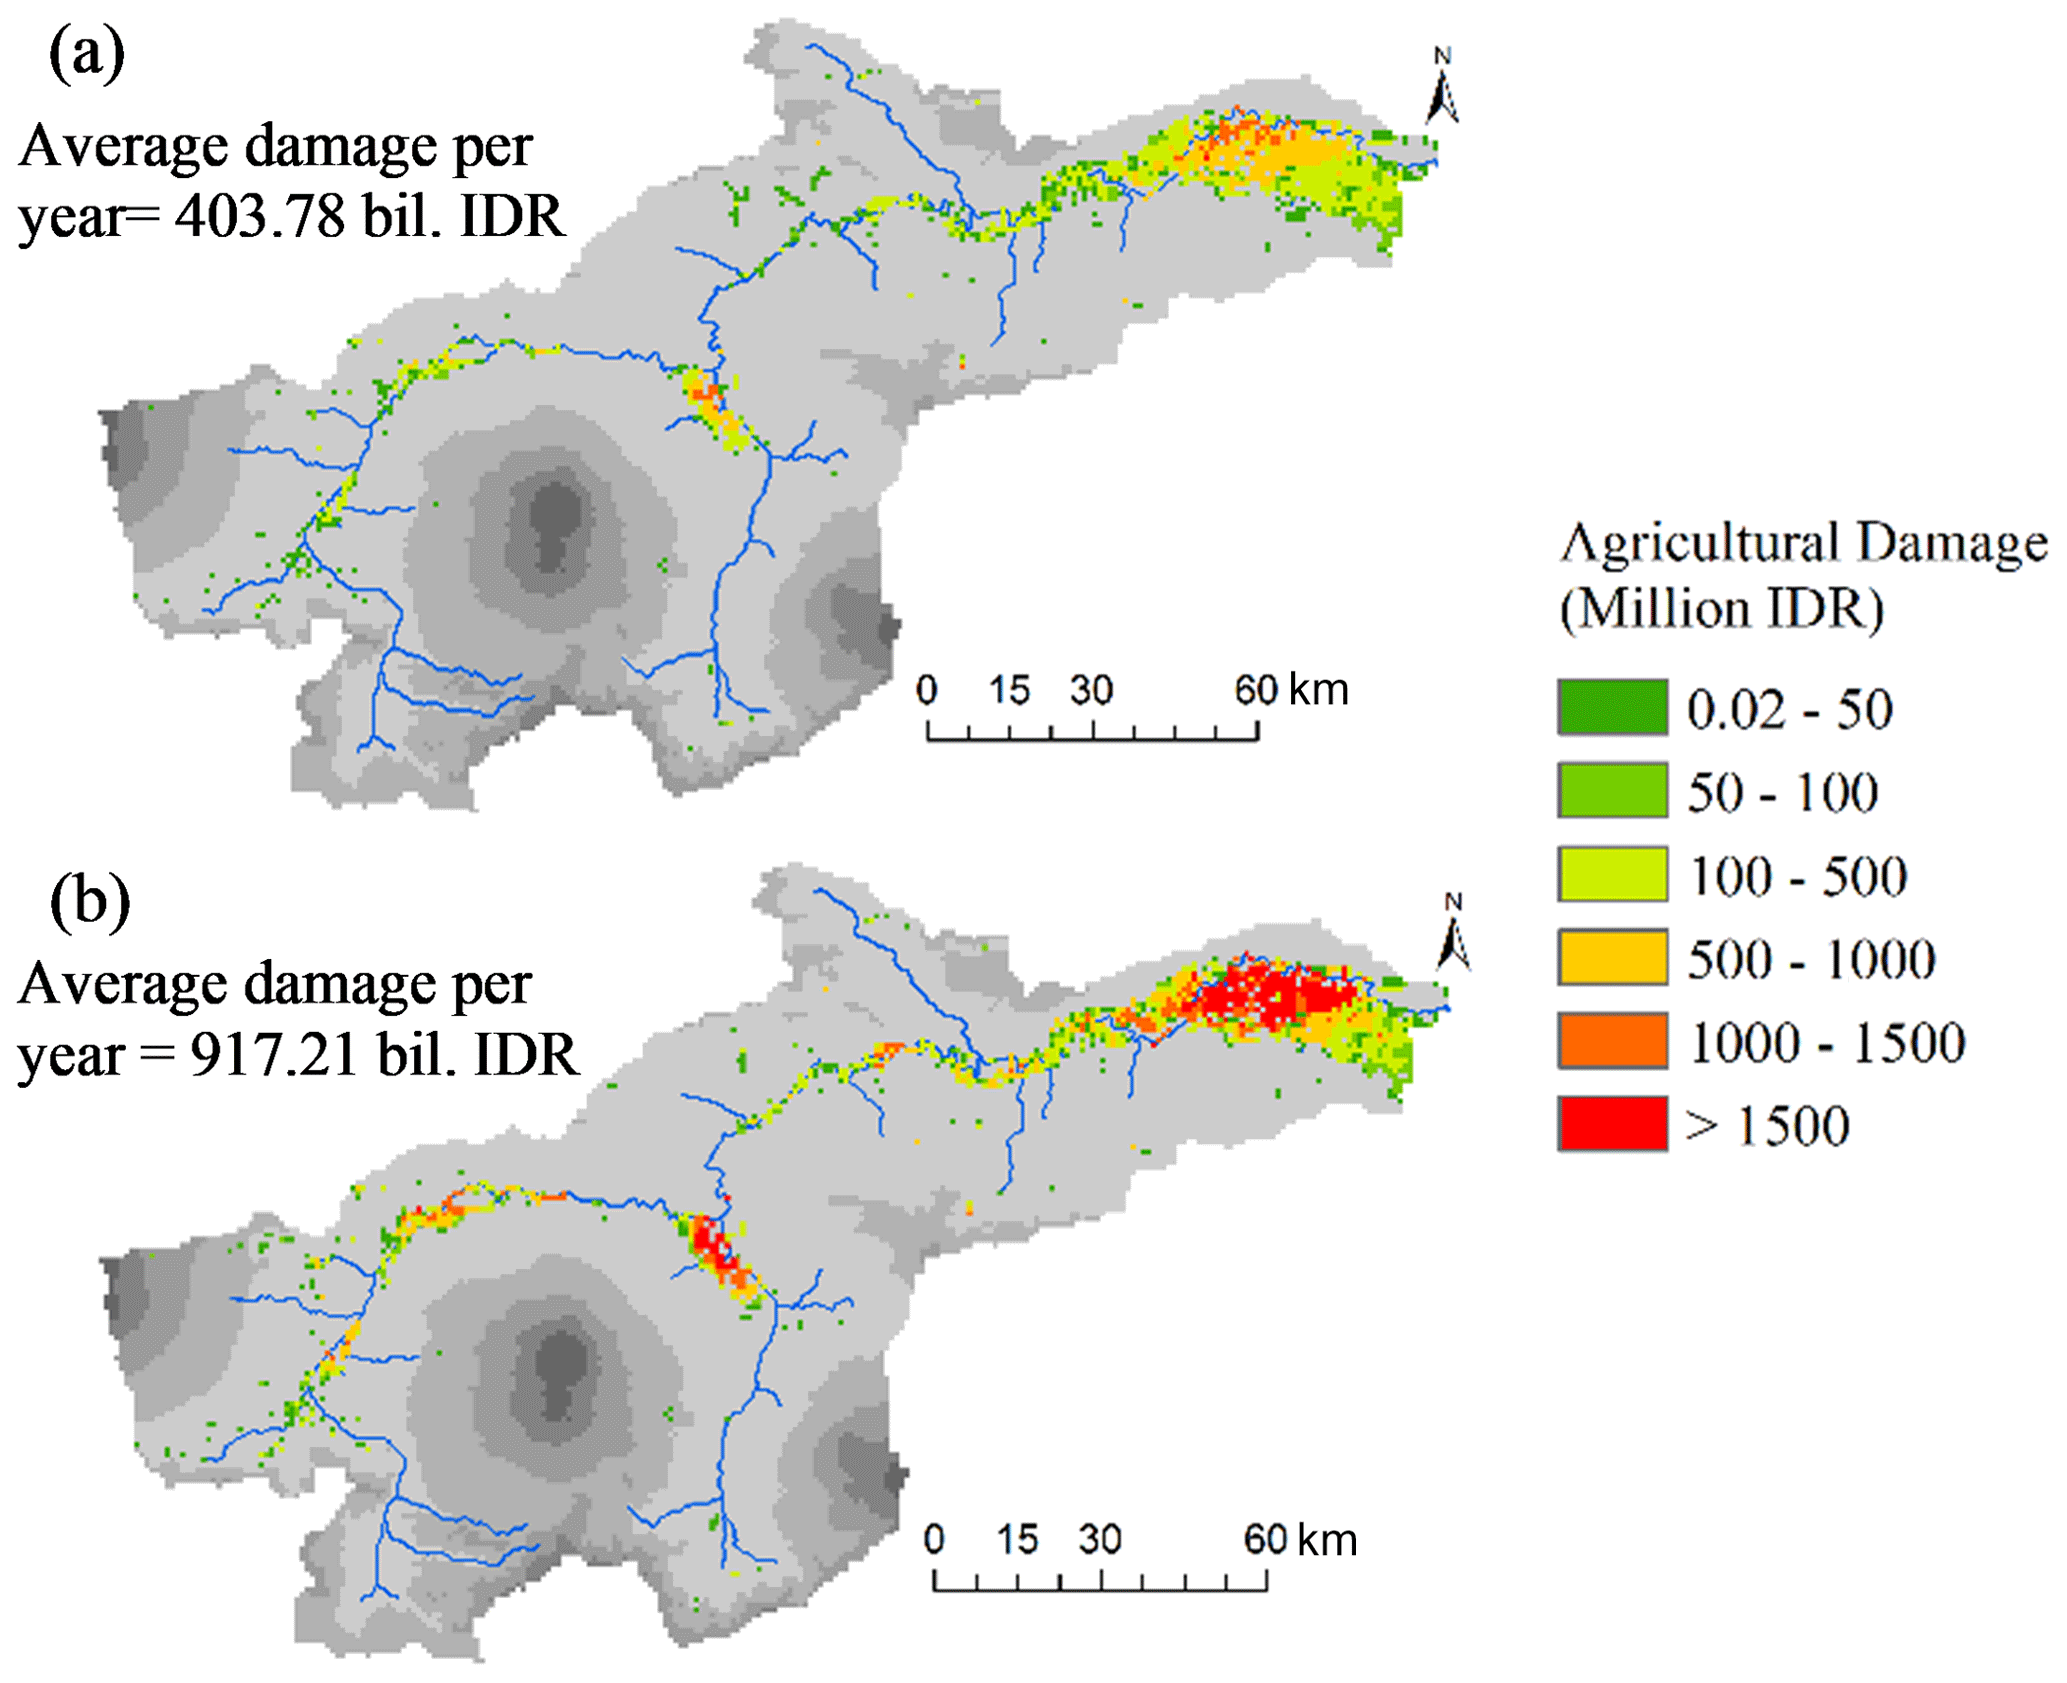
Figure 10Spatial distribution of average rice crop damage at the maturity stage case for (a) past and (b) future periods (in million rupiah per unit grid at approximately 920 m).
Figure 10 shows the comparison of the spatial distribution of the average rice crop damage (in million rupiah per unit grid at approximately 920 m) at the maturity stage case for the past and future periods. The results show that the rice crop damage in the future will be more severe in the areas farthest downstream of the basin and immediately upstream of the Madiun River confluence point.
We explored the relationship between extreme rainfall and damaged paddy area and assessed flood damage to rice crops under climate change scenarios. The findings show a strong correlation between extreme rainfall and damaged paddy area in the historical period. The results also show that flood inundation and rice crop damage might be more severe due to climate change in the future under the RCP8.5 scenario than in the historical period. The findings indicate that floods with a larger inundation area and a higher flood depth may frequently occur in the future. The rice paddies might be frequently affected by floods, suffering severe crop damage. To reduce such rice crop damage in the future, the development and implementation of adaptation measures and land-use plans are necessary. Using flood submergence-tolerant rice varieties in flood-prone areas or changing the timing of rice cultivation could also help to reduce rice crop damage in the future. The findings of this study can be useful in changing agricultural practices under climate change.
The DEM data are available at https://www.hydrosheds.org/hydrosheds-core-downloads (Lehner et al., 2008). The damaged paddy area data are available from the DFCP (2010), and the hydro-meteorological data from the Ministry of Public Works and Housing, Indonesia. The data is not available directly.
BBS, MR, and TU conceived and designed the research. All authors contributed to research, activities, and paper writing.
At least one of the (co-)authors is a guest member of the editorial board of Proceedings of IAHS for the special issue “ICFM9 – River Basin Disaster Resilience and Sustainability by All”. The peer-review process was guided by an independent editor, and the authors also have no other competing interests to declare.
Publisher’s note: Copernicus Publications remains neutral with regard to jurisdictional claims made in the text, published maps, institutional affiliations, or any other geographical representation in this paper. While Copernicus Publications makes every effort to include appropriate place names, the final responsibility lies with the authors.
This article is part of the special issue “ICFM9 – River Basin Disaster Resilience and Sustainability by All”. It is a result of The 9th International Conference on Flood Management, Tsukuba, Japan, 18–22 February 2023.
The authors would like to thank the Ministry of Public Works and Housing, Indonesia, for providing rainfall and discharge data; and the Ministry of Environment and Forestry, Indonesia, for providing land cover maps.
This research has been supported by the Integrated Research Program for Advancing Climate Models (TOUGOU) and the Program for the Advanced Studies of Climate Change Projection (SENTAN) from the Ministry of Education, Culture, Sports, Science and Technology, Japan.
This paper was edited by Shinji Egashira and reviewed by two anonymous referees.
DSRI (Department of Settlement and Regional Infrastructure): Comprehensive development and management plan study for Bengawan Solo River Basin under Lower Solo River Improvement Project, Final Report, DSRI, Directorate General of Water Resources, Indonesia, 3-1–3-73 pp., 2001.
DFCP (Directorate of Food Crop Protection): Indonesia broad flood damage in rice plant: Solo River Basin, Flood Damage Data Published by DFCP, Indonesia [data set], 2010.
Hidayat, F., Sungguh, H. M., and Harianto: Impact of climate change on floods in Bengawan Solo and Brantas River Basins, Indonesia, Proc. of 11th Int. Riversymp., 1–4 September 2008, Brisbane, Australia, http://archive.riversymposium.com/index.php?element=HIDAYAT (last access: 28 September 2020), 2008.
Komolafe, A. A., Herath, S., and Avtar, R.: Establishment of detailed loss functions for the urban flood risk assessment in Chao Phraya River basin, Thailand, Geomatics, Nat. Hazard. Risk, 10, 633–650, 2019.
Lehner, B., Verdin, K., and Jarvis, A.: New global hydrography derived from spaceborne elevation data, Eos, Transactions, American Geophysical Union [data set], 89, 93–94, https://www.hydrosheds.org/hydrosheds-core-downloads (last access: 8 June 2021), 2008.
Panuju, D. R., Mizuno, K., and Trisasongko, B. H.: The dynamics of rice production in Indonesia 1961–2009, J. Saudi Soc. Agric. Sci., 12, 27–37, 2013.
Rasmy, M., Sayama, T., and Koike, T.: Development of water and energy Budget-based Rainfall-Runoff-Inundation model (WEB-RRI) and its verification in the Kalu and Mundeni River Basins, Sri Lanka, J. Hydrol., 579, 124–163, 2019.
Shrestha, B. B., Okazumi, T., Miyamoto, M., and Sawano, H.: Flood damage assessment in the Pampanga River basin of the Philippines, J. Flood Risk Manag., 9, 355–369, 2016.
Shrestha, B. B., Kawasaki, A., and Zin, W. W.: Development of flood damage functions for agriculture crops and their applicability in regions of Aisa, J. Hydrol.-Reg. Stud., 36, 100872, https://doi.org/10.1016/j.ejrh.2021.100872, 2021.
Wright, T. and Meylinah, S.: Indonesia grain and feed annual report 2014, GAIN Report Number ID1407, https://apps.fas.usda.gov/newgainapi/api/report/downloadreportbyfilename?filename=Grain and Feed Annual_Jakarta_Indonesia_4-23-2014.pdf (last access: 7 March 2024), 2014.
Zakaria, W. A., Aring, H. L. D., and Indriani, Y.: The impact of irrigation development on rice production in Lampung Province, Research Report, University of Lampung, Indonesia, https://citeseerx.ist.psu.edu/document?repid=rep1&type=pdf&doi=4a0ef2eddfafed4606e6c4983ab2e77417be69ba (last access: 7 March 2024), 2004.
- Abstract
- Introduction
- Study area
- Relationship between extreme rainfall and damaged paddy area
- Flood damage assessment under climate change
- Results and discussion: flood damage assessment
- Conclusions
- Data availability
- Author contributions
- Competing interests
- Disclaimer
- Special issue statement
- Acknowledgements
- Financial support
- Review statement
- References