the Creative Commons Attribution 4.0 License.
the Creative Commons Attribution 4.0 License.
 | 19 Apr 2024
Flood Simulation Studies with Rainfall-Runoff-Inundation (RRI) Model, Over Yangon City, Myanmar
Pyae Pyae Phyoe
Tatsuhiko Uchida
Flood risks are increasing due to climate change and human activities in river basins. Flooding is one of the most common disasters in Myanmar, as well as in many other countries. The floods occur during the southwest monsoon season, which is from May to October. Yangon City is at risk of flooding when heavy monsoon rainfall coincides with high tides. In this study, the Yangon area was used as a case study, and the Rainfall-Runoff-Inundation (RRI) model was applied. The RRI model is one of the models that has been applied in various river basins to estimate river discharges and flood inundation from rainfall data. The model is a two-dimensional model capable of simulating rainfall-runoff and flood inundation simultaneously. This study aimed to clarify the characteristics of the model's parameters, such as lateral saturated hydraulic conductivity ka and soil depth hd, for a flat river basin in Yangon. Eighty numerical simulations were conducted for four flood events in 2011, 2012, 2013, and 2014, with six soil depths hd and five different ka values in the Bago River. The discharge hydrographs with different ka and soil depths hd values for this river basin were compared. The results show that ka and soil depth hd values significantly differ between Myanmar and other countries due to the geological characteristics and climate zones of the countries.
- Article
(2347 KB) - Full-text XML
- BibTeX
- EndNote


According to a global disaster database, flood and storm are the primary causes of disasters in Myanmar (World Meteorological Organization, 2011). Flooding is one of the most devastating natural phenomena in the world. It occurs when the watershed system experiences heavy or continuous rainfall events, causing the water flow rate to exceed the channel's capacity. There are three types of flood characteristics: pluvial floods, fluvial floods, and coastal floods (storm surges). Yangon City, located in the center of Lower Myanmar, which encompasses the coastal lowlands and the confluence of the Bago River and Hlaing River, is prone to fluvial and pluvial floods. These frequently occur during each rainy season. Fluvial floods in Yangon happen when the water levels in the surrounding rivers or canals are higher than those in areas within the city. Pluvial floods can also occur even at low tides in some locations due to blockage of the drainage system by solid waste. Flood inundations, with over 0.5 m and a duration of 3 to 5 h, occurs 6 to 10 times per year. Based on records from 1947 to 2008, there is a 3.2 % annual probability that Yangon City has been affected by a tropical cyclone and a 6.7 % probability that a storm surge has occurred in nearby coastal areas (Asian Development Bank, 2016). Severe flood events occurred in the city in 1973, 1974, 1976, 1988, 1991, 1997, 2002, 2004, 2007, and 2014. The flood event in Yangon in 2014 was different from previous floods, and this happened in the Yangon area in June and July due to continuous heavy rainfall. Nearly all the rivers and creeks overflowed, and the inundation lasted for more than seven days. The heavy rainfall in 2014 led to flooding in 14 townships in Yangon City, causing significant damages to infrastructure and economic losses for the residents.
There is a strong need for an available model that simulates rainfall-runoff, and flood inundation models have been developed and successfully applied to river basins in many parts of the world (Bates and De Roo, 2000; Leandro et al., 2014; Liu et al., 2015). A one-dimensional analysis method is generally used for predicting flood flows through the rivers in rainfall runoff analysis (Collection of Hydraulic Formulas, 2019). To consider the rainfall distribution and topography, a distributed runoff model can be used. Recently, the Rainfall-Runoff Inundation (RRI) model was developed to analyze the processes of rainfall runoff, flooding, and inundation in an integrated manner using rainfall as input conditions (Sayama, 2014). The RRI model has also been developed and applied to evaluate river discharges and flood inundation depths in flood-prone areas (Shimizu et al., 2021a, b). In this paper, we selected part of the Bago River Basin, specifically the downstream section that includes Yangon City, as our case study area to investigate the rainfall and runoff characteristics of floods in Yangon City. In the Bago River basin, other researchers have previously applied the RRI model to both the upper and lower Bago River (Bhagabati and Kawasaki, 2017). They analyzed the applicability of the RRI model to a flat river basin and confirmed the model's performance by comparing the results with satellite-based data from UNOSAT (United Nations Satellite Centre). However, the basin area in this study differs from the previous research. Furthermore, the effect of parameters in the model on the discharge hydrograph has not been revealed for this basin. This paper discusses the applicability of the RRI model to a flat river basin to understand the runoff characteristics of floods in Yangon for future research considerations. The objectives of this study include understanding the rainfall and runoff characteristics of the 2014 flood in Yangon and clarifying the RRI parameters, specifically lateral saturated hydraulic conductivity ka values and soil depth hd for the large, flat river basin in Yangon.
Yangon City is located in the eastern part of the Ayeyarwady Delta, with a patchwork of rivers, creeks, and canal drains around the area. Yangon is 794.43 km2 in land area, and is situated at approximately 96.141762° longitude and 17.132582° latitude. Yangon has a tropical climate. The average annual temperature is around 26 °C, and the average annual rainfall is 93.5 in. (237.49 cm) (Asian Development Bank, 2016).
The area of the Yangon model basin is 22 700 km2, with approximately 1100 grid cells. The upper boundary of the catchment area is formed by the Hlaing River and Bago River, while the lower boundary is defined by the Yangon River and the coastal line. The location Map of the Yangon Basin Model is shown in Fig. 1. This map was generated 70 using ArcGIS Pro 3.2 (https://pro.arcgis.com/en/pro-app/latest/getstarted/download-arcgis-pro.htm, last access: 6 March 2024).
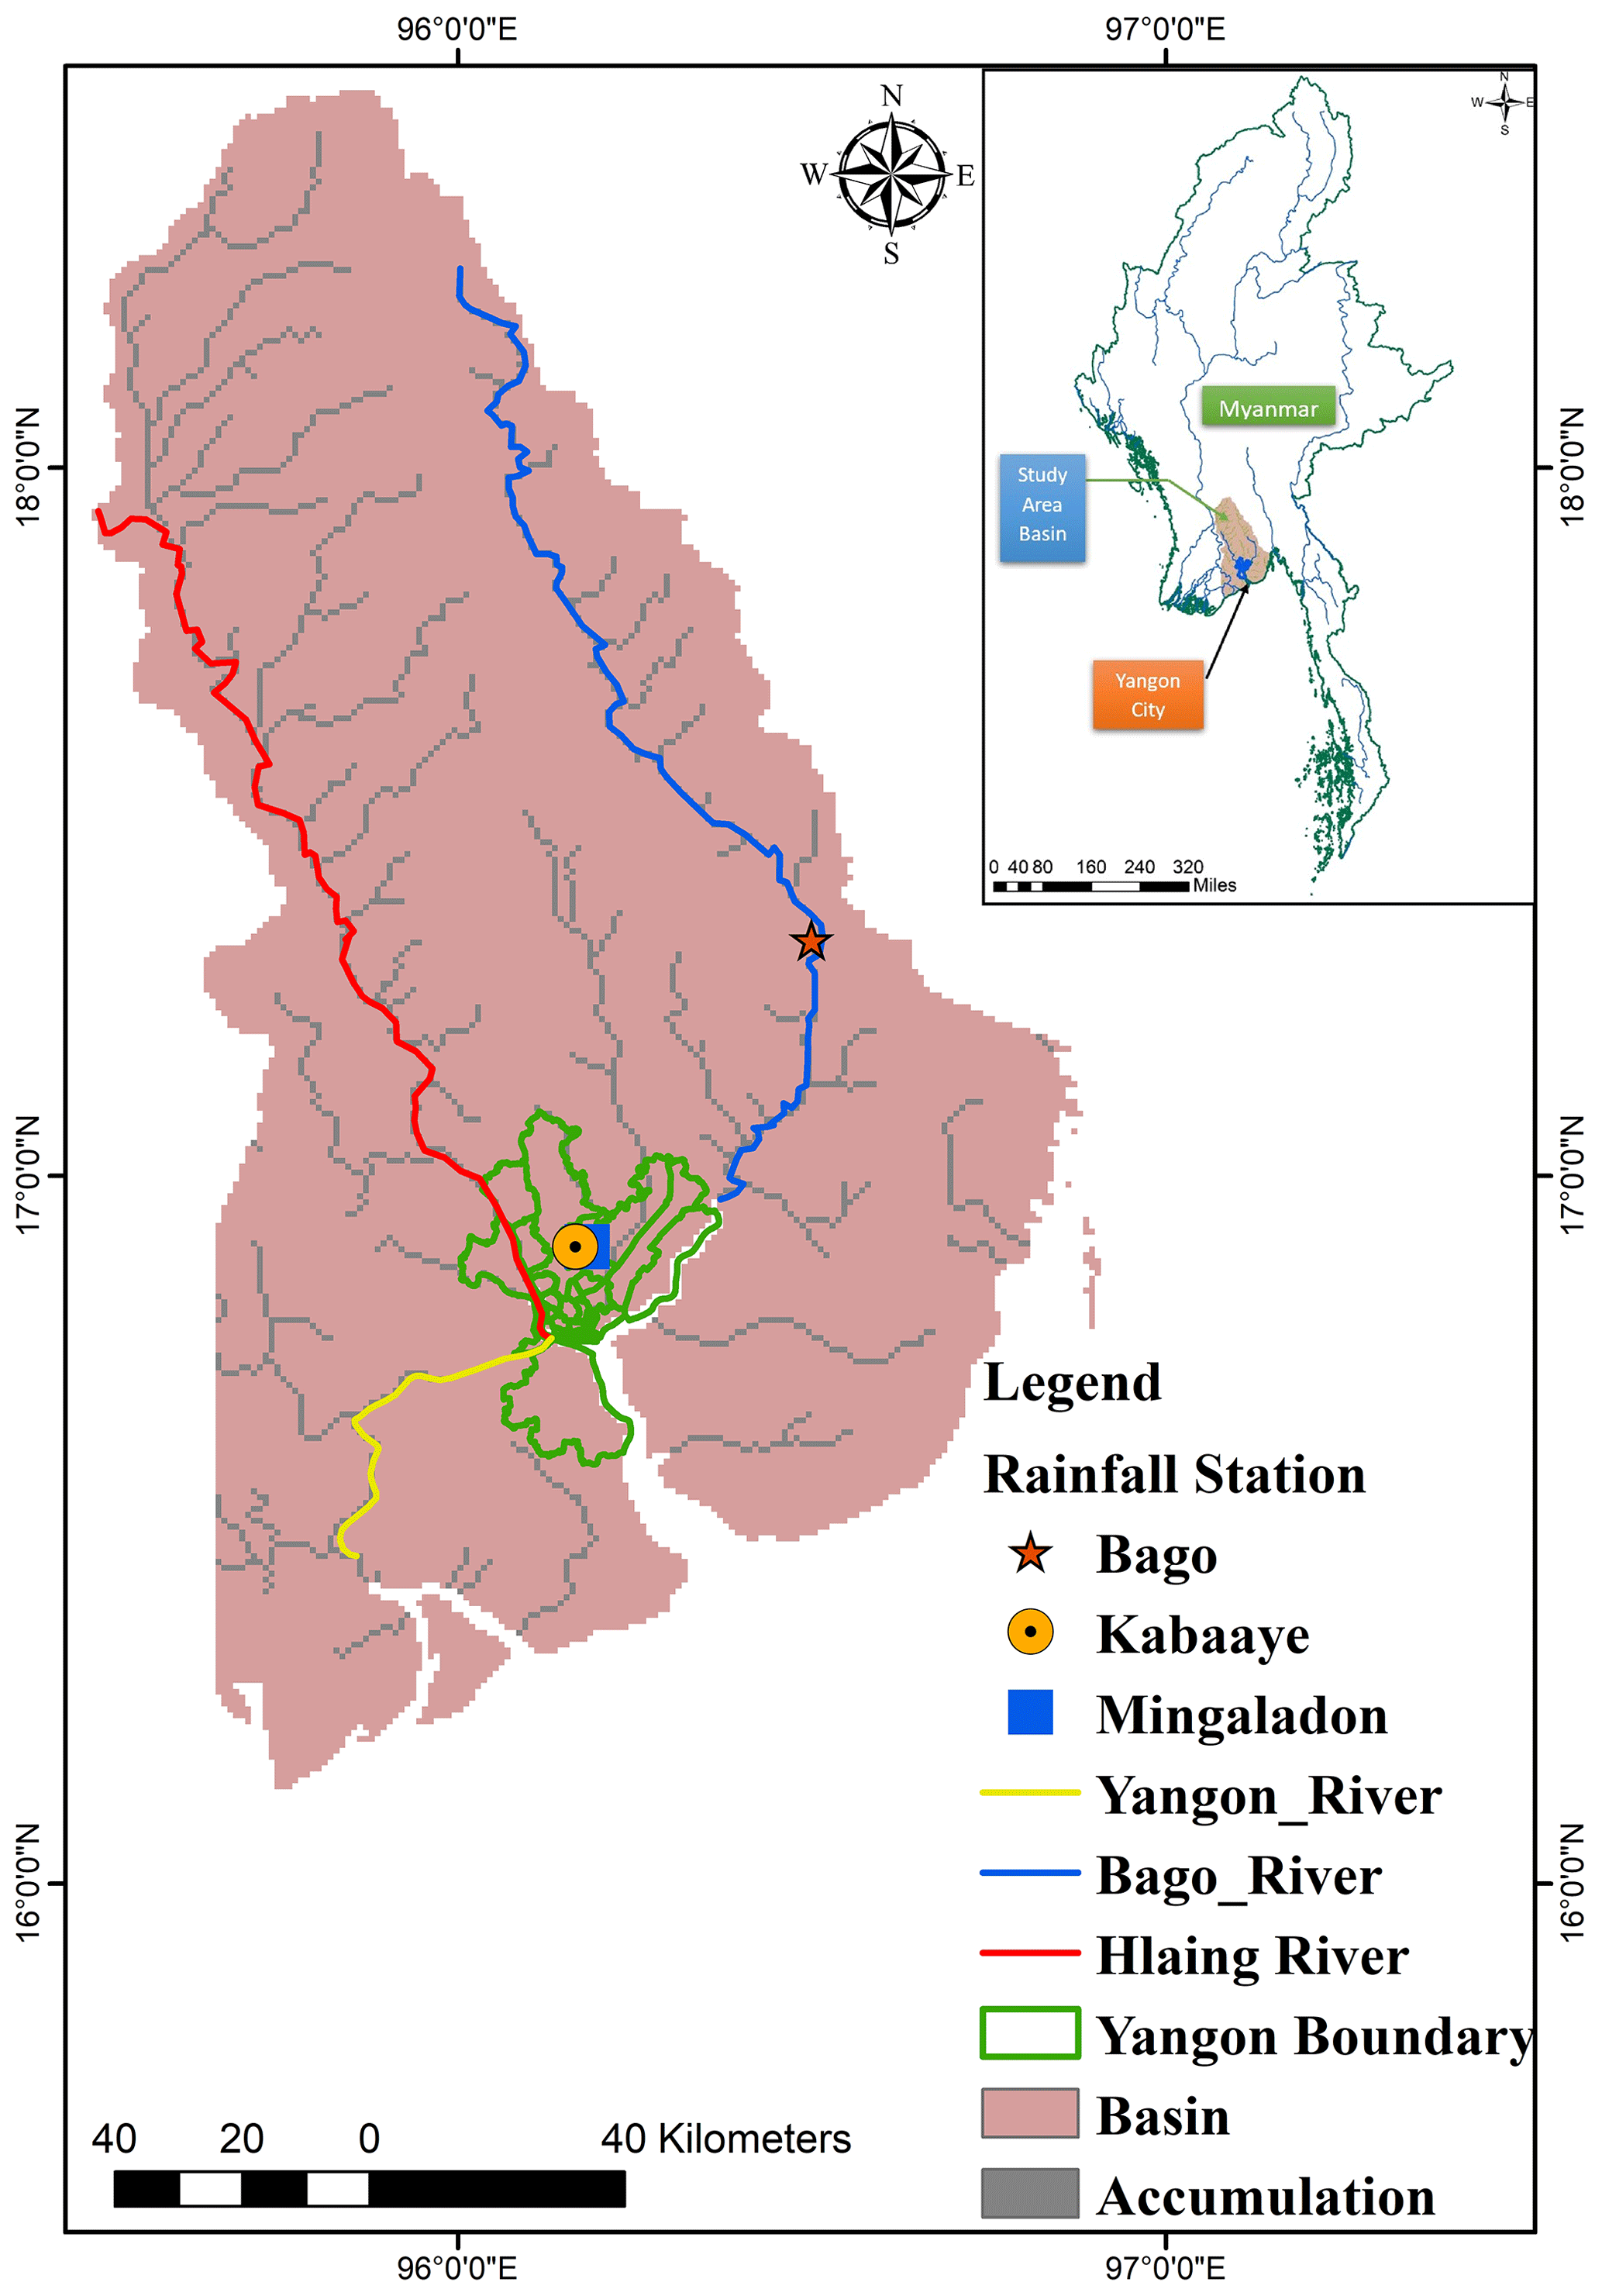
Figure 1Location Map of the Yangon Basin Model.
This basin area comprises of eleven townships: Yangon, Kungyangon, Kyauktan, Thongwa, Hlegu, Hmawbi, Htantabin, Taikkyi, Kawkhmu, Hinthada, and Bago. Among these, Yangon City is the largest.
Rainfall-Runoff-Inundation (RRI) model
The RRI model was developed to simulate the water flow mechanism between slope grid cells and river grid cells (Sayama, 2014). The continuity equation (Eq. 1) is solved to calculate the temporal variation in water volume within the grid of watershed slopes.
where, zs = water level, qx, qy, = unit width flow rate in the x,y direction, r = rainfall intensity, f = vertical penetration intensity. The unit width flow rates are divided into surface flow and penetrating flow. Generally, the unit width flow rate in the x and y directions is described by the shallow water equation as:
where, g = gravitational acceleration, τ0x,τ0y = shear stress terms in x, y directions which can include other flow resistance such as vegetation. In the RRI model, a diffusion wave is assumed for surface flow, in which the convection terms in Eq. (2) are ignored. In this study, Eq. (3) was used to calculate the surface flow flux (Shimizu et al., 2021a, b).
where, n = the roughness coefficient of Manning. The flow in the ground was divided into the basin slope, the plain area, and the mountainous area. In the mountainous area, vertical seepage flow was not considered (f=0), and lateral seepage flow was calculated using Darcy's law as shown in Eq. (4).
where qx and qy = unit width flow rate in the x, and y direction, respectively ka = saturated hydraulic conductivity, and hd = water depth in the soil layer, where the lateral infiltration flow is saturated and surface flow occurs.
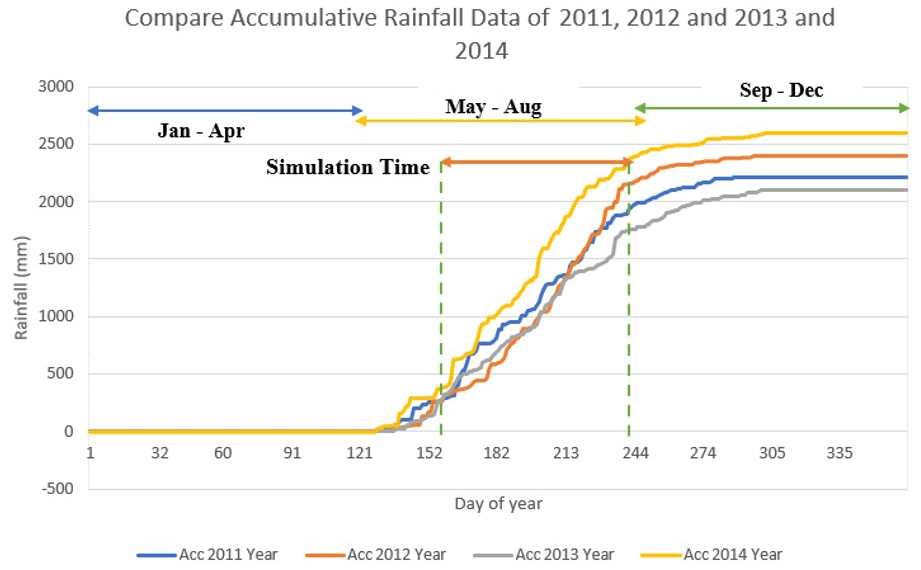
Table 1The calibration parameter values base on three land areas.
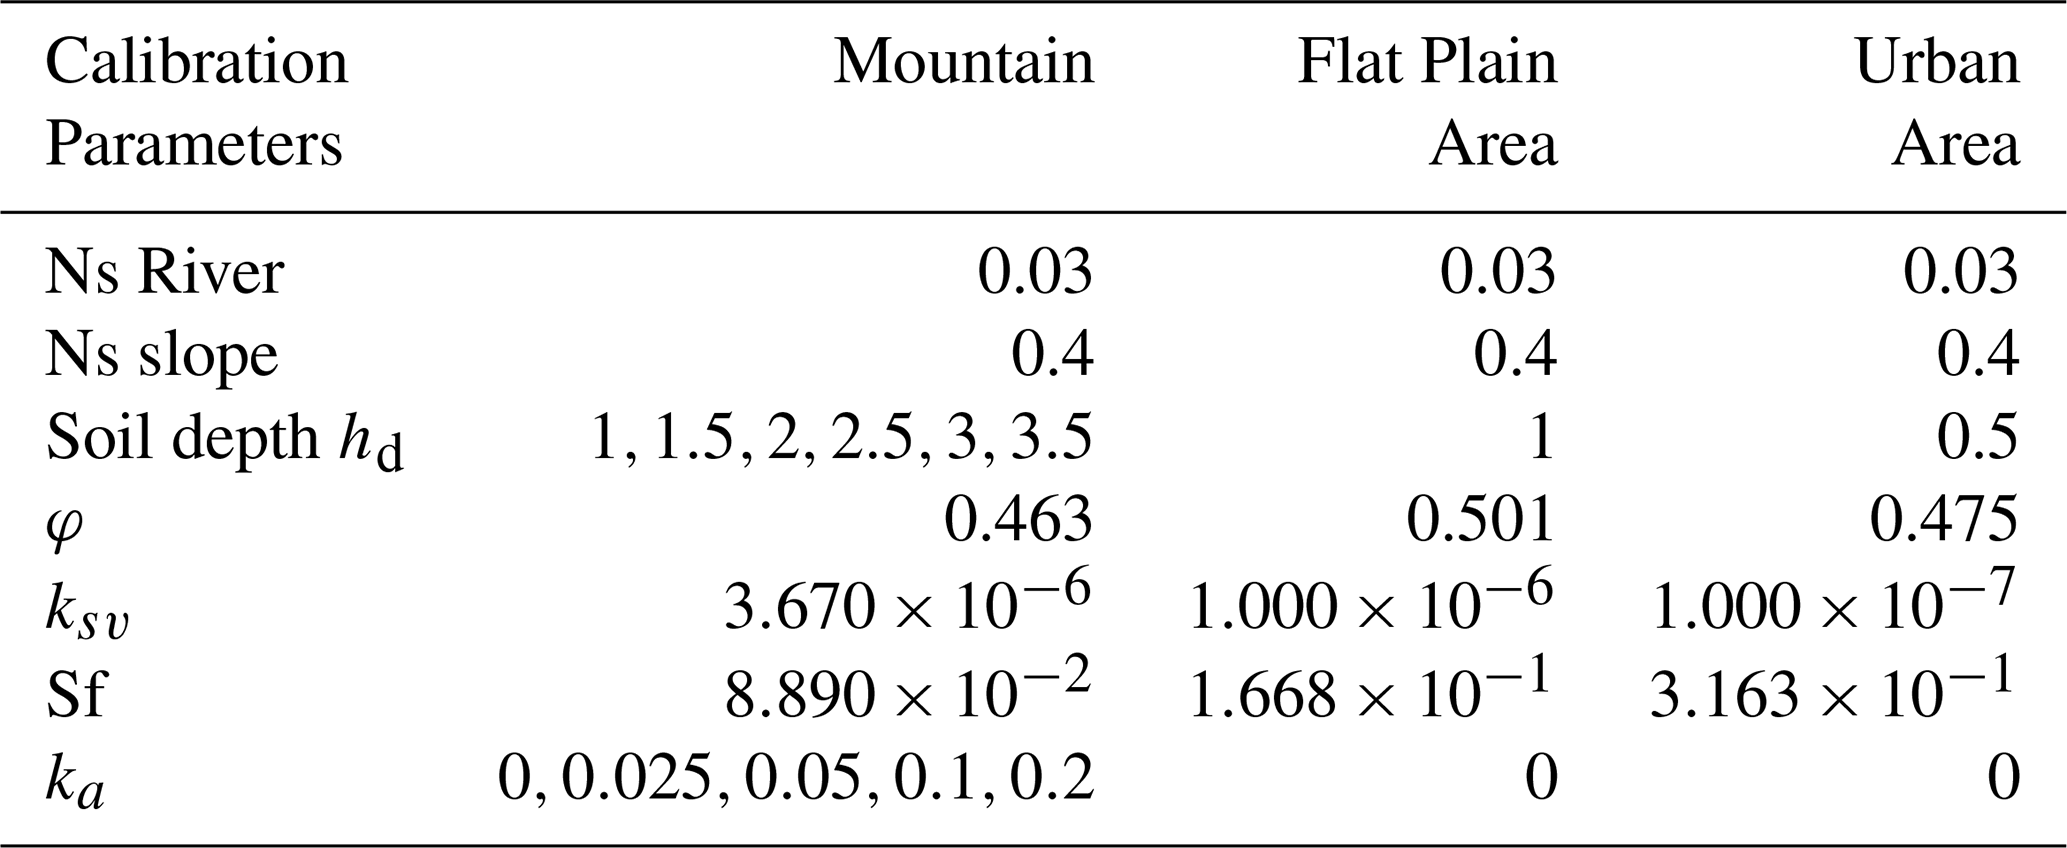
Table 2The best Nash-Sutcliff efficiencies in calibration process for different event with different ka value and soil depth hd.
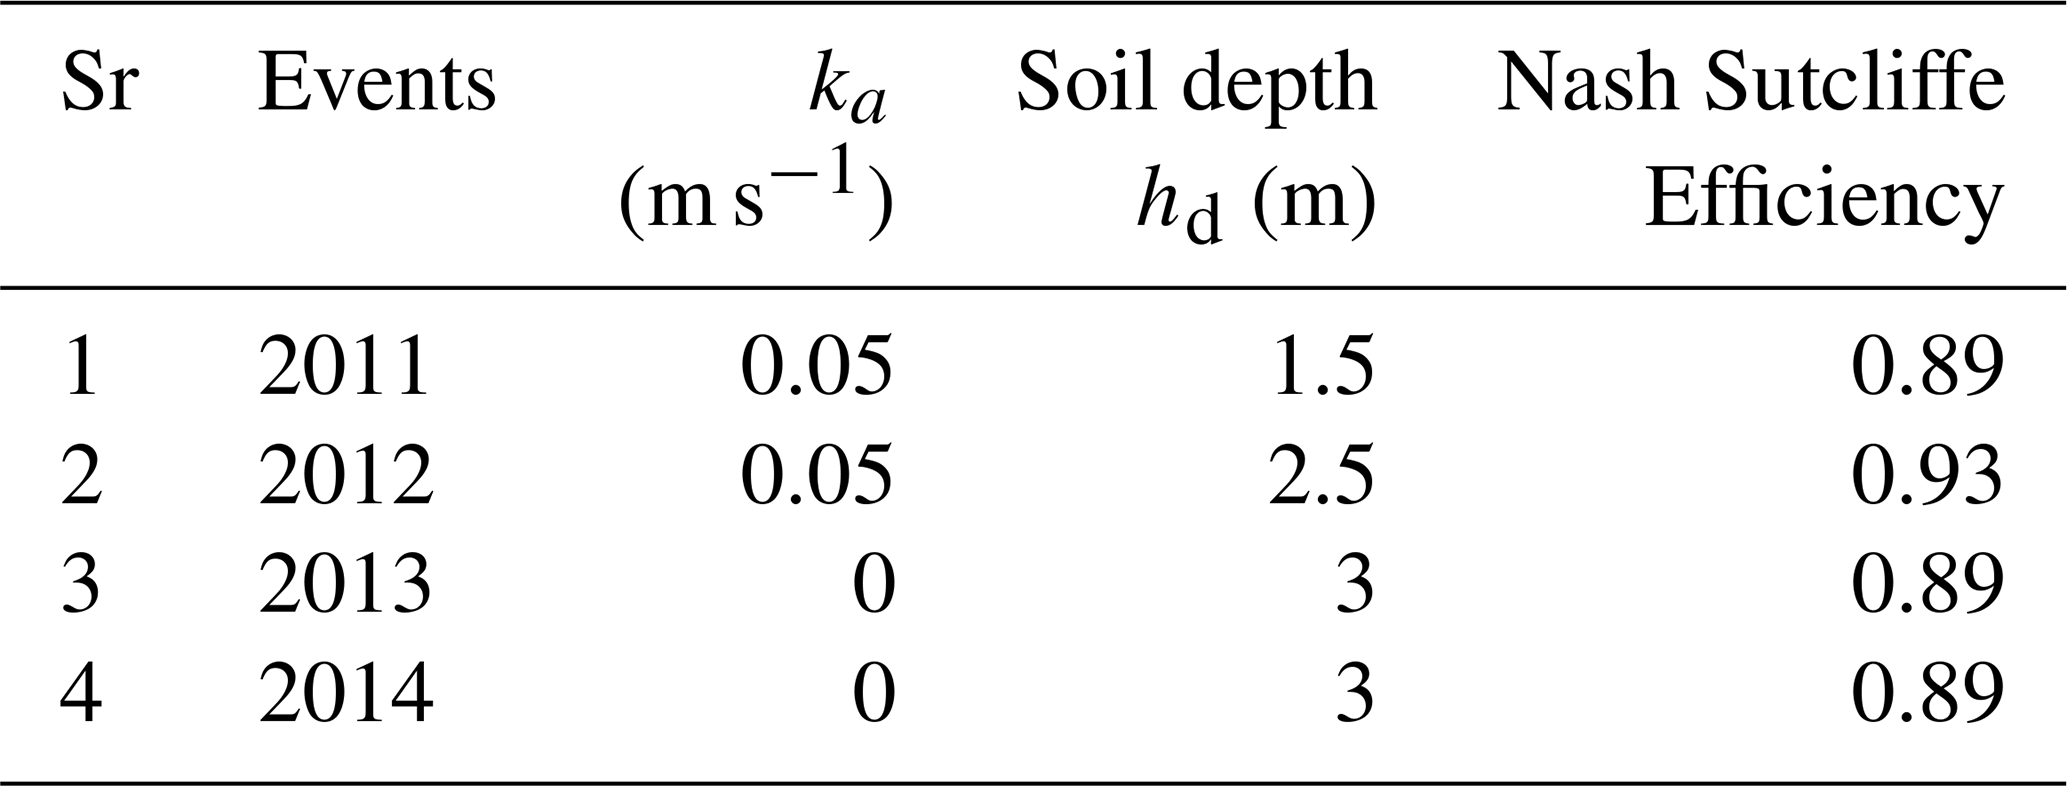
Calibration was performed using known rainfall data and observed river discharge data, adjusting selected model parameters in the model to match the model's outputs with the observed values. Generally, the calibration procedure consists of a combination of manual and automated calibrations. In this study, finding acceptable parameters was based on manual calibration through trial and error. Table 1 shows the calibrated parameters, and Table 2 shows the best Nash-Sutcliff efficiencies for each rainy season's flood event of 2011, 2012, 2013, and 2014. The simulation period, from 7 June to 23 August, was selected based on the accumulative rainfall data, as shown in Fig. 2. For the initial condition of the simulation, the water depth was set to zero after the dry season. The calibration process was conducted for different soil depths hd and different lateral saturated hydraulic conductivity ka values in the Bago River basin on a daily flow basis. These values were considered to depend on the soil texture and particle size distribution. The soil depth hd values depend on how much water can be stored in the soil conditions and the size of sediment materials in the basin area. As indicated in Eq. (4), the subsurface velocity of flux varies with the gradient of the water level. If large values of ka are used, the water can pass through the river in the earlier stages before saturating the soil. When the water depth exceeds the soil depth above an impermeable layer, such as bedrock, infiltration stops, and the surface water flows as described in Eq. (3). If the soil depth hd is high in the calculation, a large amount of water enters the river with ka=0, and only surface water goes into the river. On the other hand, if large values are used, the soil has storage space, and then the water slowly move into the river that the discharge will be decreased. This is the effect of ka and soil depth hd. Therefore, the depth of soil depth hd and lateral saturated hydraulic conductivity ka are important parameters for fixing these calibration events. A total of 80 numerical runs were conducted with perturbations of these parameters.
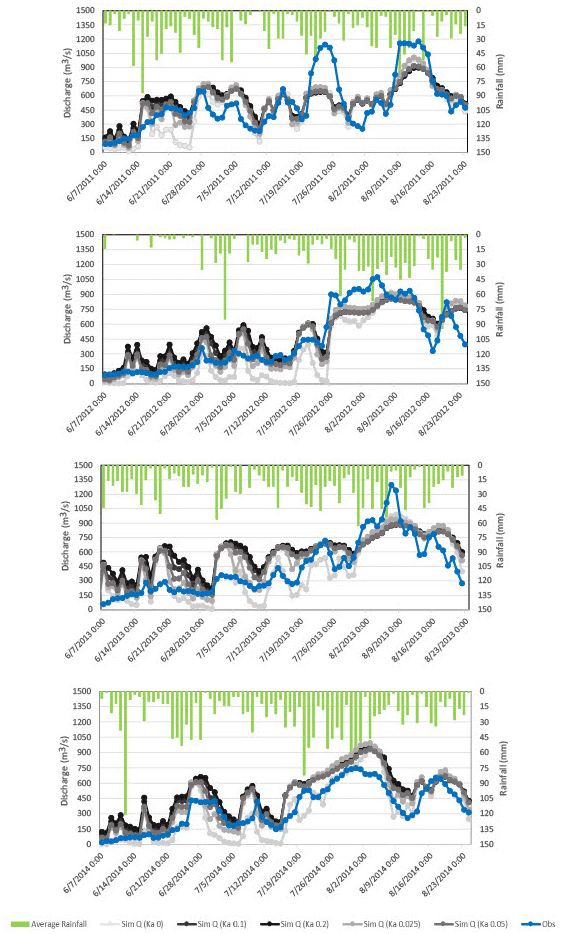
Figure 3Simulated Hydrographs with different ka values and calibrated soil depth hd for each year.
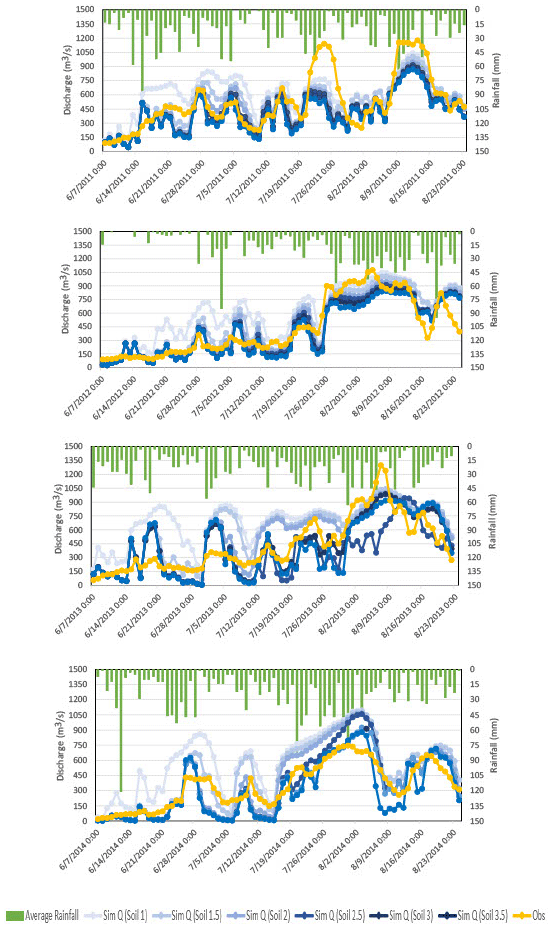
Figure 4The Simulated Hydrographs with different soil depth hd values and calibrated ka for each year.
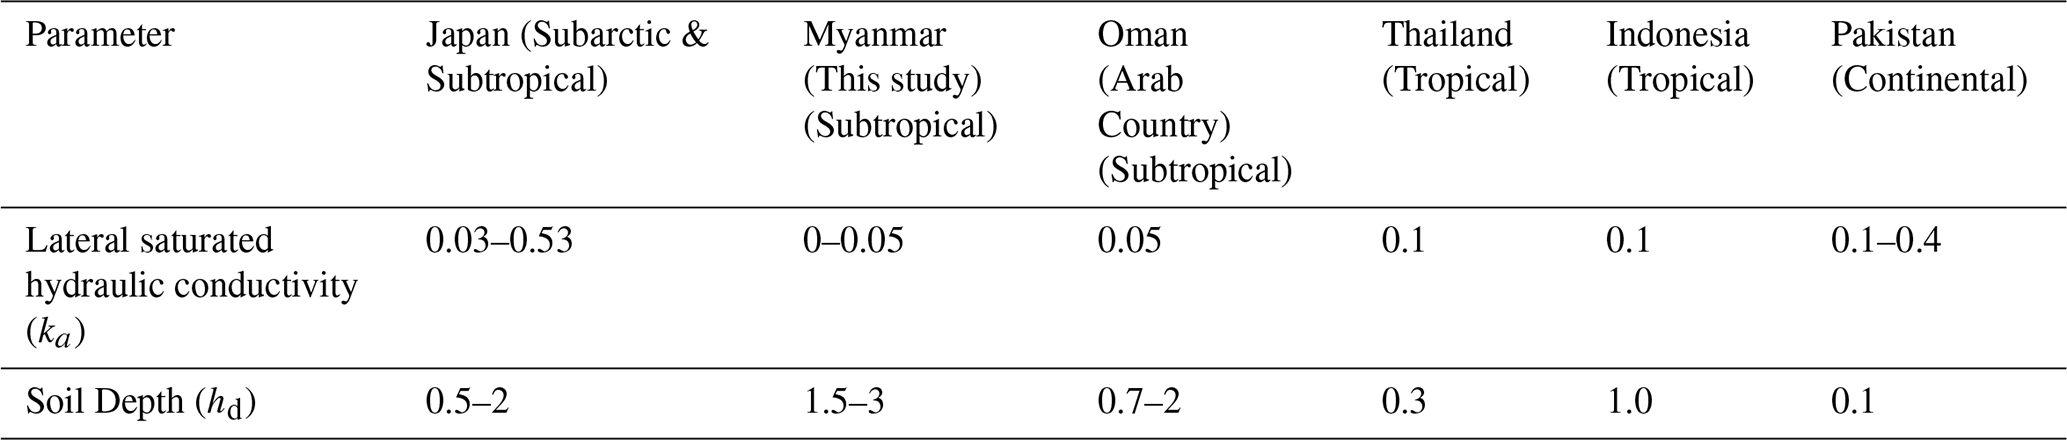
Table 3Comparison of the differences in ka values and soil depths hd among different countries.
In this study, the discharge hydrographs with different ka values and soil depths hd for this river basin were compared between Myanmar and other countries. The simulated hydrographs with different ka values and calibrated soil depth hd are shown in Fig. 3. For each year, increasing the ka value decreases the simulation discharge in the early stage but increases it in the late season because the river basin is already saturated. As a result, the water flows through the river on the water surface flows. If large values are used, the water can pass through the river in the earlier stage before saturating the soil. However, if very small ka values are used, the ground becomes saturated in the early rainy season.
The simulated hydrographs in different soil depth hd values and calibrated ka are shown in Fig. 4. When larger soil depth hd values are used for year, the discharge becomes close to the observed discharge because the soil depth is high in the calculation, allowing a large amount of water to enter the river.
According to the simulation results, Table 3 shows the calibrated values for ka and soil depth hd for a mountainous area in Japan, Myanmar, and other countries. When calculated using the Nash Sutcliffe Efficiency value, which indicates a close relationship between the observed and simulated flow, the model performance is good. As a result, the best Nash Sutcliffe Efficiency values for the 2011 event were found to be soil depth hd = 1.5 m and ka = 0.05 m s−1, hd = 2.5 m and ka = 0.05 m s−1 for the 2012 event, hd = 3 m and ka = 0 m s−1 for the 2013 event, and hd = 3 m and ka = 0 m s−1 for the 2014 event, indicating a close correlation between the observed and simulated flows. In Japan's case, for the mountainous area, the values of lateral saturated hydraulic conductivity ka ranged from 0.03 to 0.53 , and the soil depth hd values ranged from 0.5 to 2 (Sayama et al., 2020; Shimizu et al., 2019; Yagi et al., 2020). In Myanmar's case, for the mountainous area, the lateral saturated hydraulic conductivity ka values ranged from 0 to 0.05, and the values for the soil depth hd ranged from 1.5 to 3. In Oman's case, for the mountainous area, the values of lateral saturated hydraulic conductivity ka is 0.05, and the soil depth hd values ranged from 0.7 to 2 (Abdel-Fattah et al., 2018).
In Thailand's case, for the mountainous area, the values of lateral saturated hydraulic conductivity ka is 0.1, and the soil depth hd value is 0.3 (Sayama et al., 2017; Try et al., 2020). In Indonesia's case, for the mountainous area, the values of lateral saturated hydraulic conductivity ka is 0.1, and the soil depth hd value is 1.0 (Nastiti et al., 2018). In Pakistan's case, for the mountainous area, the values of lateral saturated hydraulic conductivity ka ranged from 0.1 to 0.4, and the soil depth hd value is 0.1 (Sayama et al., 2012).
Therefore, the values of lateral saturated hydraulic conductivity ka of Myanmar are smaller and the soil depth hd values are larger than those of other countries.
The best parameter range values and sensitive parameters will change for different countries due to the climate zone, geographical features, flood characteristics, river morphology and sediment size of the basin area.
According to the table, the parameter values for soil depth hd in Myanmar have a larger range than those in other countries, and the values of ka are smaller. When the gap between the soil and the sediment materials size is large, water can easily flow into the ground layer. In Myanmar's case, the size of the sediment materials is not too large, hence; water cannot easily flow into the ground layer.
In this study, the RRI model was applied to rainfall and flooding events that happened in Myanmar in 2011, 2012, 2013, and 2014. The hydrographs were created, demonstrating acceptable performance in simulating flood events and are closely related to meteorological hydrographs observed, indicating the usefulness of the RRI model for flood inundation analysis. In summary, this study investigated the differences in values of lateral saturated hydraulic conductivity ka and the soil depth hd between Myanmar and other countries. However, in terms of Myanmar's river basin, the ka value ranges from 0 to 0.05, and the soil depth hd ranges from 1.5 to 3. In this study, considering these two parameters, the evaluation of this model's simulation focuses on the infiltration process. Infiltration parameters vary with rainfall, soil porosity, and the topography of the study area. The rate of infiltration depends on measurable soil properties, such as hydraulic conductivity, and the soil depth hd. The effects of the parameters of lateral saturated hydraulic conductivity ka and the soil depth hd were investigated within the optimal range of ka=0 to 0.05 and hd=1.5 to 3, which indicate deep and compacted soil layers compared to other countries. Therefore, these two parameters were used to provide satisfactory output for measured data, and those coefficients closely match what is expected from the study basin area in Myanmar. Apart from that, the difference in these two parameters indicates the geographical features of Japan, Myanmar, and other countries where sediment deposits are deeply in large flat areas. As a result, Japan, and Oman's values range of ka and the soil depth hd are very close to Myanmar's case because they are in the same climate zone. More detailed investigation of the differences in parameters and geographical features is required for future research avenues.
The RRI model is accessible on the International Centre for Water Hazard and Risk Management (ICHARM) website: https://www.pwri.go.jp/icharm/research/rri/index.html (Sayama, 2024).
Meteorological and Hydrological data were provided by the Department of Meteorology and Hydrology (DMH) in Myanmar. The data sets are not publicly accessible.
PPP designed, planned, collected the data, systematized the processing and analysis of meteorological data, and wrote the original manuscript in consultation with TU. TU supervised the project, provided research tools, and edited the manuscript.
The contact author has declared that neither of the authors has any competing interests.
Publisher's note: Copernicus Publications remains neutral with regard to jurisdictional claims made in the text, published maps, institutional affiliations, or any other geographical representation in this paper. While Copernicus Publications makes every effort to include appropriate place names, the final responsibility lies with the authors.
This article is part of the special issue “ICFM9 – River Basin Disaster Resilience and Sustainability by All”. It is a result of The 9th International Conference on Flood Management, Tsukuba, Japan, 18–22 February 2023.
We acknowledge the Department of Meteorology and Hydrology (DMH) in Myanmar for providing the data of the Bago River.
This research has been supported by the Program for Japanese Grant Aid for Human Resource Development Scholarship (JDS) (Fellowship number B0012019MMR012).
This paper was edited by Mohamed Rasmy and reviewed by two anonymous referees.
Abdel-Fattah, M., Kantoush, S. A., Saber, M., and Sumi, T.: Rainfall-Runoff modelling for extreme flash floods in Wadi Samail, Oman, J. JSCE Ser. B, 74, I_691–I_696, https://doi.org/10.2208/jscejhe.74.5_I_691, 2018.
Asian Development Bank: Republic of the Union of Myanmar, Transformation of urban management – flood management component final report part 2 (part 2 of 7), 1–57, Project Number: 46496-001, 2016.
Bates, P. D. and De Roo, A. P. J.: A simple raster-based model for flood inundation simulation, J. Hydrol., 236, 54–77, https://doi.org/10.1016/S0022-1694(00)00278-X, 2000.
Bhagabati, S. S. and Kawasaki, A.: Consideration of the Rainfall-Runoff-Inundation (RRI) Model for flood mapping in a deltaic area of Myanmar, Hydrol. Res. Lett., 11, 155–160, https://doi.org/10.3178/hrl.11.155, 2017.
Collection of Hydraulic Formulas: 2018 Edition, JSCE, Maruzen, Japan, 2019.
Leandro, J., Chen, A. S., and Schumann, A.: A 2D parallel diffusive wave model for floodplain inundation with variable time step (P-DWave), J. Hydrol., 517, 250–259, https://doi.org/10.1016/j.jhydrol.2014.05.020, 2014.
Liu, L., Liu, Y., Wang, X., Yu, D., Liu, K., Huang, H., and Hu, G.: Developing an effective 2-D urban flood inundation model for city emergency management based on cellular automata, Nat. Hazards Earth Syst. Sci., 15, 381–391, https://doi.org/10.5194/nhess-15-381-2015, 2015.
Nastiti, K. D., An, H., Kim, Y., and Jung, K.: Large-scale Rainfall–Runoff–Inundation modeling for upper Citarum river watershed, Indonesia, Environ. Earth Sci., 77, 640, https://doi.org/10.1007/s12665-018-7803-x, 2018.
Sayama, T.: Rainfall-Runoff-Inundation (RRI) Model technical manual, Tsukuba, International Center for Water Hazard and Risk Management (ICHARM), ISSN 0386-5878, 2014.
Sayama, T.: Rainfall-Runoff-Inundation (RRI) Model, Tsukuba, International Center for Water Hazard and Risk Management (ICHARM), https://www.pwri.go.jp/icharm/research/rri/index.html, last access: 6 March 2024.
Sayama, T., Ozawa, G., Kawakami, T., Nabesaka, S., and Fukami, K.: Rainfall–Runoff–Inundation analysis of the 2010 Pakistan flood in the Kabul river basin, Hydrolog. Sci. J., 57, 298–312, https://doi.org/10.1080/02626667.2011.644245, 2012.
Sayama, T., Tatebe, Y., and Tanaka, S.: An emergency response-type Rainfall-Runoff-Inundation simulation for 2011 Thailand floods, J. Flood Risk Manage., 10, 65–78, https://doi.org/10.1111/jfr3.12147, 2017.
Sayama, T., Yamada, M., Sugawara, Y., and Yamazaki, D.: Ensemble flash flood predictions using a high-resolution nationwide distributed Rainfall-Runoff Model: case study of the heavy rain event of July 2018 and Typhoon Hagibis in 2019, Prog. Earth Planet Sci., 7, 75, https://doi.org/10.1186/s40645-020-00391-7, 2020.
Shimizu, R., Uchida, T., and Kawahara, Y.: Flood analysis in the Nuta river basin during the Western Japan heavy rain in July 2018, 38th IAHR World Congress, International Association for Hydro-Environment Engineering and Research (IAHR), 1614–1620, https://doi.org/10.3850/38WC092019-1332, 2019.
Shimizu, R., Kaida, K., Matsuda, M., Uchida, T., Sayama, T., and Kawahara, Y.: Enhanced Rainfall-Runoff flood simulation with RRI Model incorporating river vegetation resistance based on 2D numerical calculation results and slope direction surface flow flux, J. JSCE Ser. B, 77, 84–91, https://doi.org/10.2208/jscejhe.77.1_84, 2021a.
Shimizu, R., Uchida, T., Kawahara, Y., Yamashita, A., and Fukuda, T.: High-accuracy prediction of water level in Rainfall-Runoff analysis coupled with unsteady 2-D calculation results, Advan. River Eng., 27, 241–246, https://doi.org/10.11532/river.27.0_241, 2021b.
Try, S., Tanaka, S., Tanaka, K., Sayama, T., Oeurng, C., Uk, S., Takara, K., Hu, M., and Han, D.: Comparison of gridded precipitation datasets for Rainfall-Runoff and Inundation modeling in the Mekong river basin, PLoS ONE, 15, e0226814, https://doi.org/10.1371/journal.pone.0226814, 2020.
World Meteorological Organization.: Manual on flood forecasting and warning (WMO-No.1072), 1–142, https://library.wmo.int/idurl/4/35881 (last access: 6 March 2024), 2011.
Yagi, F., Uchida, T., and Kawahara, Y.: Numerical investigation of three-dimensional flow structures and turbulence energy distributions in bank erosion reaches during large flood events, J. JSCE Ser. B, 10, 136–144, https://doi.org/10.2208/journalofjsce.10.1_136, 2022.
- Abstract
- Introduction
- Background of the Study Area
- Methodology
- RRI model Calibration and Validation
- Results and Discussion
- Conclusions
- Code availability
- Data availability
- Author contributions
- Competing interests
- Disclaimer
- Special issue statement
- Acknowledgements
- Financial support
- Review statement
- References