the Creative Commons Attribution 4.0 License.
the Creative Commons Attribution 4.0 License.
The performance of rainwater harvesting systems in the context of deep uncertainties
Gabriela Cristina Ribeiro Pacheco
Conceição de Maria Albuquerque Alves
Rainwater harvesting systems (RHS) are a relevant alternative of water supply in urban areas with increasing water demand and limited water availability. But these systems depend on several parameters that present uncertainties as well-characterized uncertainties whose probability functions are known and deep uncertainty factors that doesn't have analytical representation of their variability. This study evaluates the influence of water demand, tariff and discount rate (deep uncertain factors) on the feasibility of RHS for different scenarios of uncertainties. The systems were evaluated using the following performance criteria: Satisfied Demand, Reliability, Percentage of Rainwater Harvesting, Net Present Value, Net Present Value Volume and Benefit Cost Rate. We simulated the RHS performance for sixteen system configurations, comprised of eight categories of residential buildings according to representative water consumption (ranging from 4.748 to 44.673 m3 per month) and two typical catchment areas for each of the eight groups of demands (ranging from 60 to 400 m2) in the city of Rio Verde located in the central of Brazil. Each system was evaluated under the context of 1000 States of the World (SOWs) defined using the Latin Hypercube Sampling (LHS) method (in the case of the deep uncertainty factors) and bootstrapping resampling (for precipitation). Results showed slight difference on performance criteria among precipitation scenarios, maybe due to the fact that the synthetic rainfall series preserved the pattern and the total rainfall volume among the series which is reasonable for the location. However, the water tariff and discount rate showed a significant influence in the performance criteria confirming the relevance of deep uncertainty factors in the evaluation of RHS performances.
- Article
(1558 KB) - Full-text XML
- BibTeX
- EndNote
Water conservation; rainwater harvesting; deep uncertainties; UPH 21; SDG 6
Climate, social and economic uncertainties pose greater challenges to water resources security in urban areas that already face limited water supply and urban sprawl and increasing water demand (AWWA, 2019). The universal access to water requires public policies adapted to local reality, in addition to supply management and water conservation practices such as Rainwater Harvesting Systems (RHS).
RHS consist of an ancient water supply technique in which rainfall is captured in the household, stored and used in non-potable or even potable uses in communities where there is limited water supply service. The system requires a collect surface area (roof or floor), a storage tank and a water quality control according to the final use of the collected rainwater. Due to the increase in the water demand associated to limited water availability, this technique has been rescued in some communities.
RHS have potential to save from 20 % to more than 50 % of the amount of water needed to supply household demands (Ghisi and Ferreira, 2007; Ennenbach et al., 2017; Cáceres et al., 2019; Custódio and Ghisi, 2019; Hofman-Caris et al., 2019). However, these benefits are variable with rainfall regime, local economic aspects and the RHS features. In order to get the best performance of a RHS one should consider on site feature demands and climate variability, as well as other uncertainties that could influence the performance of the system. The variability of the local precipitation regime has been proved to impact the performance of RHS especially due to climate change (Youn et al., 2012; Lash et al., 2014; Haque et al., 2016).
The variability in the rainfall regime is usually referred as well characterized uncertainties. However, there are other parameters that might have some impact in the performance of RHS and do not have their variability represented by any analytical expression. These parameters are defined in the literature as deep uncertainty factors (Knight, 1921; Kwakkel et al. 2016). There is no consensus of a conceptual model that portrays the long-term future of these factors, the probability distribution that describes a variable over time and how to evaluate the results and the importance of each one (Lempert et al., 2003).
In rainwater harvesting systems, water demand, tariff, discount rate and rate of increase in operation and maintenance costs may be considered as deep uncertainty factors (DU factors). The impact of deep uncertainty factors on system viability must be evaluated as soon as their inclusion in the assessment of management strategies reduces proposed measures vulnerabilities (Lempert, 2002; Trindade et al., 2019).
A recent National Water and Sanitation Law included the rainwater harvesting system as an important alternative to improve the access to clean and safe water in the country (Brazil, 2020). This study evaluates the influence of deep uncertainties factors on rainwater harvesting systems feasibility in the Rio Verde city in Central West region of Brazil. This city has socio and economic characteristics that represent most of the Brazilian medium size cities. Additionally, most of the households buildings and parcels have space to incorporate a RHS.
The influence of DU factors and precipitation variability on RHS performance were evaluated in the context of different States of the World (SOWs). 1000 scenarios of rainfall were created and associated with 1000 set of deep uncertainty factors generated using Latin Hypercube Sampling (LHS) method. Table 1 presents the lower and upper limits for each DU factor defined based on the variability of historical values of these parameters.
30-years daily rainfall series were generated through bootstrapping resampling from the 24-years observed daily rainfall serie. The hydrologic year in the simulation started in October, at the beginning of the wet season and in order to avoid the discontinuity between December and January in different years and to preserve event order in the bootstrap.
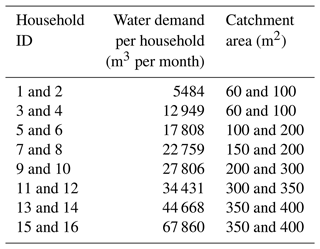
In addition, eight demand values were adopted corresponding to the consumption ranges of the normal residential category defined by the Water Utility. For each water demand level, we defined two sizes of typical catchment areas, according to the characteristics of the most frequent buildings in the city and the water consumption in residences. Each of the 16 RHS were evaluated for all 1000 SOWs of precipitation associated to 1000 vectors of DU factors, totalizing 16 000 scenarios.
2.1 The computational experiment
The methodology included four major steps: (1) the selection of the storage reservoir capacity; (2) the definition of the state of the world scenarios; (3) the economic evaluation of the RHS performance; (4) the computation of the selected RHS performance criteria. The steps were performed for each of the 16 000 scenarios.
The size of the reservoir in the RHS was computed according to a mass balance simulation, indicated in Eqs. (1) and (2), using the YAS method (Yield After Spillage – θ = 0). Three system performance metrics were computed for each selected storage volume, according to Eqs. (3), (4) and (5). The indicator Satisfied Demand (SD) corresponds to the percentage of overall demand met by the RHS, the Reliability (REL) refers to the number of days that the demand is fully met and the Rainwater Harvested (RH) is the percentage of rainwater volume that is actually consumed in the household.
Vc: consumed volume in the day (m3), Vr: volume of water in the reservoir in the day (m3), Vac: volume available for capture in the day (m3), D: daily demand in the day (m3), Vrinf: inferior reservoir volume, θ: moment of water use (0 ≤ θ ≤ 1) in this study θ = 0, SD: satisfied demand (%), REL: reliability (%), RH: rainwater harvested (%), t: day, T: simulation time (days).
In a second stage, the reservoirs economic evaluation in the considered SOWs was carried out, the systems cash flow and the economic indicators were calculated: Benefit Cost Rate (BCR), Net Present Value (NPV) and Net Present Value Per Volume Consumed (NPVV), as Eqs. (6), (7) and (8).
Fct: cash flow (USD), i: monthly discount rate (% per month), tvd: discount rate variation rate (%), m: month, Inv: initial investment (USD), BCR: Benefit-cost Rate, NPV: Net Present Value, NPVV: Net present value per volume consumed.
Finally, the model determined the indicators for the selected storage reservoir volume (reservoirs volumes that presented the highest NPV value). A set of minimum performance criteria was defined and the number of scenarios that satisfied this condition was computed.
2.2 Data considered in the analysis
The study was carried out for the municipality of Rio Verde. The 24-year historical series of rainfall data (starting in 1 October 1996) were taken from the National Institute of Meteorology (INMET).
Table 2 shows the sixteen configurations of households according to monthly demand and typical catchment area of the buildings defined in this study. Each household ID represents a water demand level associated to a size of roof area. We considered two typical catchment areas according to a visual search (using Geographic Information Systems) in remote sensing maps of the Rio Verde city. These demand values were established from the average monthly consumption values for each of the eight consumption ranges of typical household according to data from the water utility. Once the RHS supply water for non-potable demand, the RHS demand for each household was assumed to be 53 % of the average monthly demand according to the study of Sant'Ana (2011) for a city with similar climate.
The economic evaluation of the RHS was based on the December 2020 values of the National System for Research on Civil Construction Costs and Indexes (SINAPI) and the cost of 18 storage tanks volumes commercially available, pump, upper reservoir, filter and accessories. The analysis for the operation and maintenance costs included recommendations from the Brazilian Technical Regulations NBR 15527 (ABNT, 2019).
We considered the local water utility (Saneago) 2021 tariff structure in the revenues computation. The company also charges a fixed minimum cost of USD 2.45 (USD 1 = BRL 5.55) and a tariff of sewage, corresponding to 100 % of the water tariff.
The discount rate was based on the SELIC (basic interest rate of the Brazil economy) for November 2021, 7.65 % per year (0.6162 % per month) (Central Bank, 2021). For the RHS tanks sizing a surface runoff rate of 0.8 was adopted and an initial discharge of 2 mm.
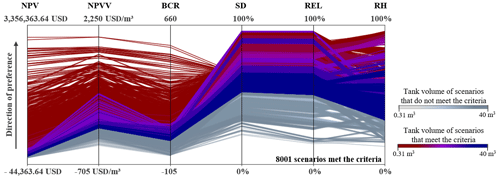
The performance criteria for the different scenarios and the number of scenarios that meet the defined performance criteria (NPV ≥ 0, NPVV ≥ 0, BCR ≥ 0 %, SD ≥ 50 %, REL ≥ 50 % and RH ≥ 30 %) was evaluated as indicated in Fig. 2. The lines indicate each scenario and connect the values of the performance criteria (that have different units) allowing the performance comparison among scenarios. The direction of preference indicates the direction of the goal expected for each performance criteria. From the 16 000 scenarios, 8.001 met the criteria. It is observed that the SD and REL values are similar for most of the scenarios.
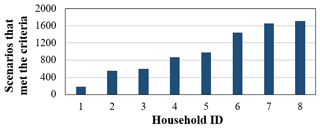
To assess how the results vary for different consumption ranges, the number of scenarios that meet the criteria for different consumption ranges were observed as indicated in Fig. 1. For households with lower demand, the number of scenarios that meet the criteria is reduced. There is a tendency for scenarios with lower demand for rainwater to present higher values of SD and REL. However, the economic indicators and the RH are lower in scenarios of higher demand values. This fact demonstrates that buildings with higher demands tends to present lower technical indicators (SD, REL) and higher economic indicators (NPV, NPVV) under the context of climate and deep uncertainties.
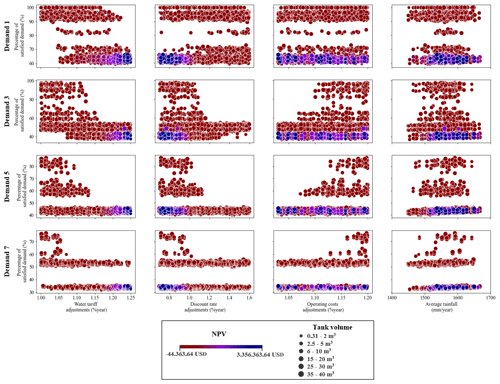
In Fig. 3 is illustrated the variation in the adopted tanks, NPV and SD with deep uncertainty factors for four of the eight categories of demands. The highest NPV values occur for the lowest discount rate and the highest water tariff. As already noted, the highest values of NPV occur for the lowest values of SD, including a reduction in the maximum values of this indicator as demand increases. It is also noted that larger storage volumes are associated with lower SD values. For households 5, 6, 9, 10, 13 and 14, there were only scenarios with high SD values for low water tariff, discount rate and high values of operational costs.
The variability of NPV and SD was evaluated for the different rainfall series and there is no clear influence of the precipitation regime in NPV and SD once the analysis considers the same location and the method to generate the precipitation series do not capture future variability.
This work evaluated the performance of different RHS configuration for the town of Rio Verde under the context of uncertainties related to climate and deep uncertainties. Sixteen categories of household were defined according to water demand and catchment area to capture rainwater. The RHS were considered to supply non-potable water uses. Initial results indicate the influence of deep uncertainties such as the water tariff and the discount rate, while the influence of operating costs was not noticed. The highest values of NPV occurred for the lowest values of discount rate and for the highest water tariffs.
The impact of these two parameters was more relevant than the impact of demand, catchment area and the rainfall regime, proving the importance of incorporating deep uncertainties in the evaluation of RHS.
Considering the performance criteria defined in the methodology, more than half of the 16 000 scenarios for the RHS in Rio Verde city were favourable. It is noteworthy that 50 % of service and reliability is compatible with RHS since the buildings have another source of water supply. The RHS functions as an alternative of water supply in these places, especially for non-potable uses. In any case, it is necessary to evaluate uncertainties impacts in sites with significantly different rainfall regimes, tariff structures and demand patterns.
The code is available at GitHub: https://github.com/gabrielacrpacheco/Rainwater-harvesting-feasibility (last access: 25 January 2023; https://doi.org/10.5281/zenodo.7566355, Pacheco and Alves, 2023).
Rainfall data are available at http://bdmep.inmet.gov.br/ (last access: 5 February 2021, login required; INMET, 2021). Demand and water tariff data are in the water utility data base and may be available by request to the authors by email.
All authors contributed to the study conception and design. The first draft was written by GCRP and CdMAA reviewed and improved it several times.
The contact author has declared that neither of the authors has any competing interests.
Publisher’s note: Copernicus Publications remains neutral with regard to jurisdictional claims in published maps and institutional affiliations.
This article is part of the special issue “IAHS2022 – Hydrological sciences in the Anthropocene: Past and future of open, inclusive, innovative, and society-interfacing approaches”. It is a result of the XIth Scientific Assembly of the International Association of Hydrological Sciences (IAHS 2022), Montpellier, France, 29 May–3 June 2022.
The authors acknowledge the financial support given by FAP-DF, University of Brasília Graduate School and Federal Institute of Goiás (IFG).
This research has been supported by FAP-DF, University of Brasília Graduate School and Federal Institute of Goiás (IFG).
This paper was edited by Christophe Cudennec and reviewed by two anonymous referees.
ABNT: NBR 15527: “Aproveitamento de água de chuva de coberturas para fins não potáveis – Requisitos”, Brazilian Association of Technical Standards, 2nd edn., Rio de Janeiro, ISBN 978-85-07-07999-6, 2019.
AWWA: State of the water industry report, https://www.awwa.org/Portals/0/AWWA/ETS/Resources/2019_STATE%20OF%20THE%20WATER%20INDUSTRY_post.pdf (last access: 3 January 2020), 2019.
Brazil: Lei n. 14.026, de 15 de julho de 2020, http://www.planalto.gov.br/ccivil_03/_Ato2019-2022/2020/Lei/L14026.htm, last access: 27 July 2020.
Cáceres, P. S., Ramos, S. R., and Sant'ana, D. R.: Potencial de redução da exploração dos recursos hídricos pelo aproveitamento de água pluvial em edificações residenciais no Distrito Federal, Cadernos de Arquitetura e Urbanismo – Paranoá 23, 11–19, https://doi.org/10.18830/issn.1679-0944.n23.2019.02, 2019.
Central Bank: Taxas de juros básicas - Histórico, https://www3.bcb.gov.br/sgspub/consultarvalores/consultarValoresSeries.do?method=get, last access: 15 December 2021.
Custódio, D. A. and Ghisi, A.: Assessing the Potential for Potable Water Savings in the Residential Sector of a City: A Case Study of Joinville City, Water, 11, 1–18, https://doi.org/10.3390/w11102074, 2019.
Ennenbach, M. W., Larrauri, P. C., and Lall, U.: County-scale rainwater harvesting feasibility in the United States: climate, collection area, density, and reuse considerations, J. Am. Water Resour. As., 54, 1–20, https://doi.org/10.1111/1752-1688.12607, 2017.
Ghisi, E. and Fereira, D. F.: Potential for potable water savings by using rainwater and greywater in a multi-storey residential building in southern Brazil, Build. Environ., 42, 2512–2522, https://doi.org/10.1016/j.buildenv.2006.07.019, 2007.
Haque, M. M., Rahman, A., and Samali, B.: Evaluation of climate change impacts on rainwater harvesting, J. Clean. Prod., 137, 60–69, https://doi.org/10.1016/j.jclepro.2016.07.038, 2016.
Hofman-Caris, R., Bertelkamp, C., Waal, L., Brand, T. V. D., Hofman, J., Aa, R. V. D., and Hoek, J. P. V.: Rainwater Harvesting for DrinkingWater Production: A Sustainable and Cost-Effective Solution in The Netherlands? Water, 11, 511, https://doi.org/10.3390/w11030511, 2019.
INMET: Rainfall data, Banco de Dados Meteorológicos, http://bdmep.inmet.gov.br/, last access: 5 February 2021.
Knight, F. H.: Risk, Uncertainty and Profit, University of Illinois at Urbana-Champaign's Academy for Entrepreneurial Leadership Historical Research Reference in Entrepreneurship, https://ssrn.com/abstract=1496192 (last access: 2 December 2021), 1921.
Kwakkel, J. H., Haasnoot, M., and Walker, W. E.: Comparing robust decision-making and dynamic adaptive policy pathways for model-based decision support under deep uncertainty, Environ. Model. Softw., 86, 168–183, https://doi.org/10.1016/j.envsoft.2016.09.017, 2016.
Lash, D., Ward, S., Kershaw, T., Butler, D., and Eames, M.: Robust rainwater harvesting: probabilistic tank sizing for climate change adaptation, J. Water Clim. Change, 5, 526–539, https://doi.org/10.2166/wcc.2014.080, 2014.
Lempert, R. J.: A new decision sciences for complex systems, P. Natl. Acad. Sci. USA, 99, 7309–7313, https://doi.org/10.1073/pnas.082081699, 2002.
Lempert, R. J., Popper, S. W., and Bankes, S. C.: Shaping the next one hundred years: new methods for quantitative, long-term policy analysis, MR-1626-RPC, RAND, Santa Monica, CA, ISBN 0-8330-3275-5, 2003.
Pacheco, G. C. R. and Alves, C. d. M. A.: Rainwater harvesting feasibility considering deep uncertainties, Zenodo [code], https://doi.org/10.5281/zenodo.7566355, 2023.
Sant'Ana, D. R.: A socio-technical study of water consumption and water conservation in Brazilian dwellings, PhD thesis, Oxford Brookes University, 2011.
Trindade, B. C., Reed, P. M., and Characklis, G. W.: Deeply uncertain pathways? Integrated multi-city regional water supply infrastructure investment and portfolio management, Adv. Water Resour., 134, 103442, https://doi.org/10.1016/j.advwatres.2019.103442, 2019.
Youn, S., Chung, E., Kang, W. G., and Sung, J. H.: Probabilistic estimation of the storage capacity of a rainwater harvesting system considering climate change, Resour. Conserv. Rec., 65, 136–144, https://doi.org/10.1016/j.resconrec.2012.05.005, 2012.


